Overview
We assembled and conducted experiments for each of the three components that constitute Xylego . Below, we present each section and the achievements for each.
Colonization Support
We found that Xylego can survive in a medium where xylitol is the sole carbon source by uptaking and metabolizing xylitol. Furthermore, it succeeded in surviving in an environment where other bacteria were present, indicating that it is not excluded by competitive displacement.
EGF Expression
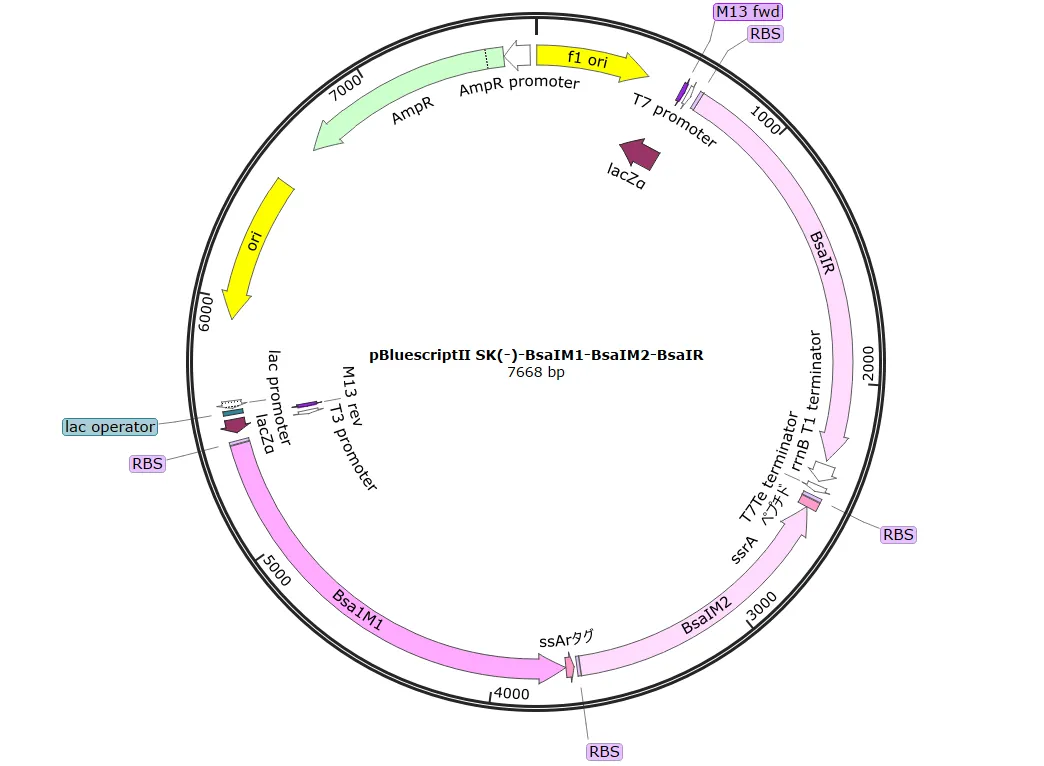
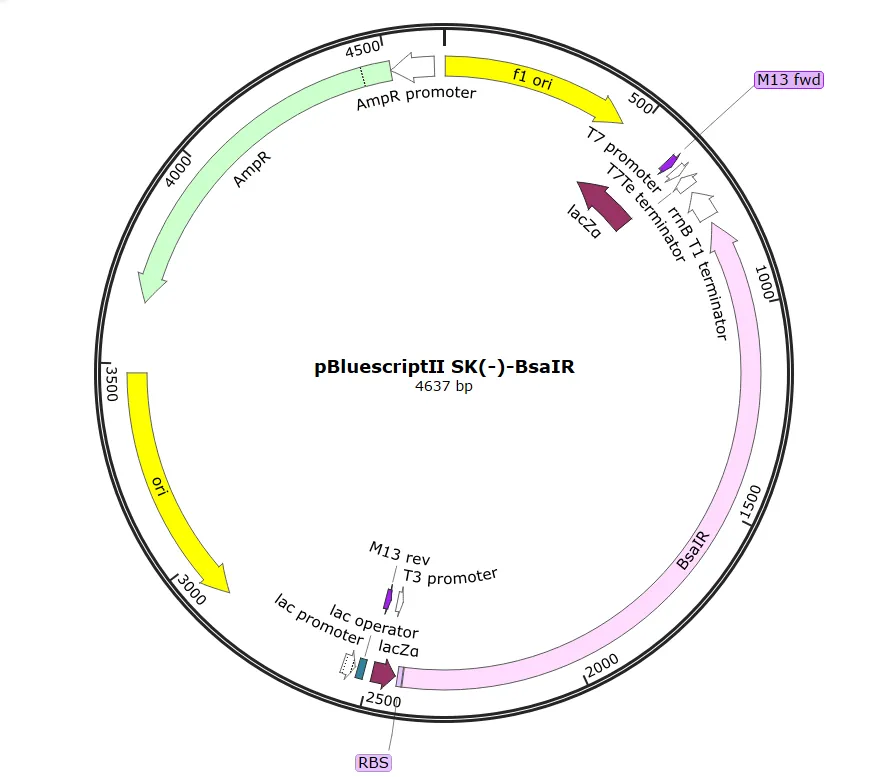
We successfully designed an E. coli strain harboring a plasmid for the production and secretion system of the 6xHis-EGF-LARD3 fusion protein . However, production and secretion could not be confirmed by the results of SDS-PAGE and Western Blotting . EGF has six cysteines and forms three disulfide bonds when properly folded. Therefore, the combination of a high-copy plasmid, pBluescript II SK(-) , and the T7 promoter , along with the induction conditions used, may have led to the formation of inclusion bodies . It is necessary to confirm that the correct plasmid was constructed through sequencing and to improve the system by reviewing the culturing and induction conditions .
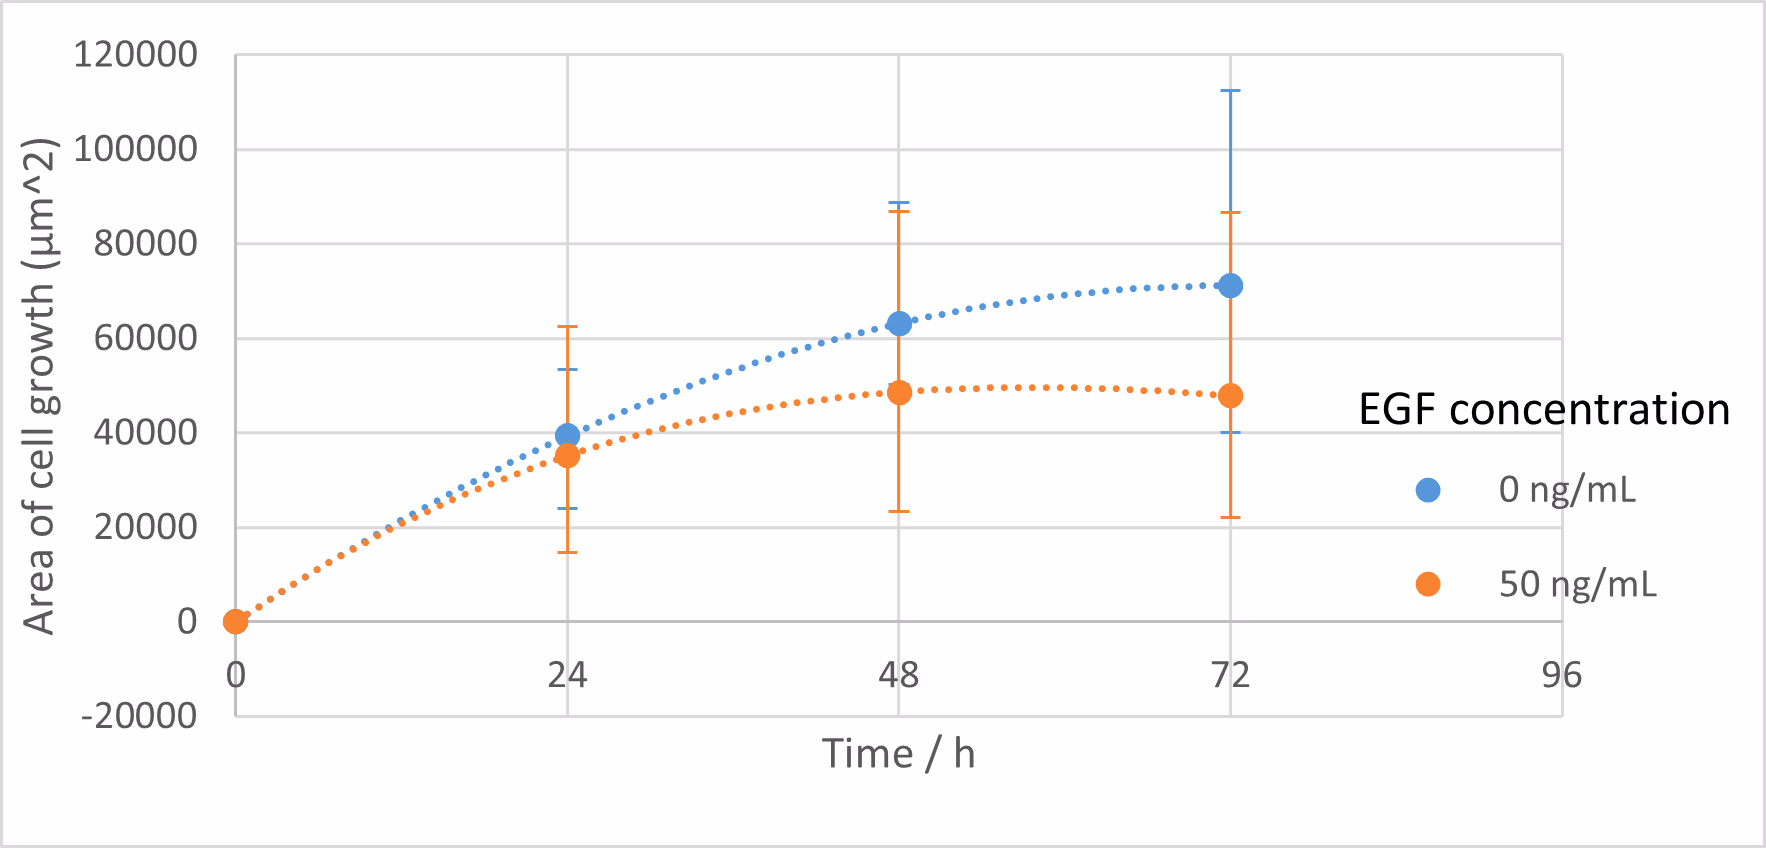
The experiment to confirm whether C2BBe1 cells, which are intestinal epithelial cells, proliferate with human EGF aimed to measure the recovery of a wound created by a p200 tip by measuring the wound area. To mimic the in vivo environment where growth factors are present, Dulbecco’s Modified Eagle Medium (DMEM) containing 10% Fetal Bovine Serum (FBS) was used. Although no significant results were obtained in the initial experiment, time-lapse photography revealed that 50 ng/mL of EGF promoted cell proliferation, and EGF concentrations of 100 ng/mL or more inhibited cell proliferation.
Kill Switch
We successfully designed an E. coli strain harboring a plasmid for the Kill Switch system. However, the kill switch did not actually activate, possibly due to promoter leakage . We found that it is necessary to further improve the promoter and the expression level of the restriction enzyme .
Conclusion
The results presented on this page demonstrated that Xylego enables coexistence with other bacteria by metabolizing xylitol . Furthermore, although we aimed for the production of the epithelial growth factor, EGF , we found that improvement is necessary by reviewing the culturing and induction conditions .
Although significant results were not obtained with the kill switch system either, we believe that the concept of Xylego is highly feasible and has great potential by making improvements to the promoter and other elements or by using a different kill switch system .
Colonization Support
Plasmid Construction
After obtaining the necessary elements for plasmid construction, we used HiFi assembly to construct two types of plasmids: pTf16-xytB-xytC-xytD-xytE , which contains the xylitol transporter genes (xyt), and pBluescript II SK(-) (pBl) -xylB-xdh-noxE , which contains the xylulokinase gene (xylB) and the xylitol dehydrogenase gene (xdh).


We transformed these plasmids into DH5α for amplification. Plasmid DNA was extracted from these clones using the Miniprep method , and analysis of the plasmid DNA by agarose gel electrophoresis confirmed that the size of these plasmids was correct.
Strain Construction
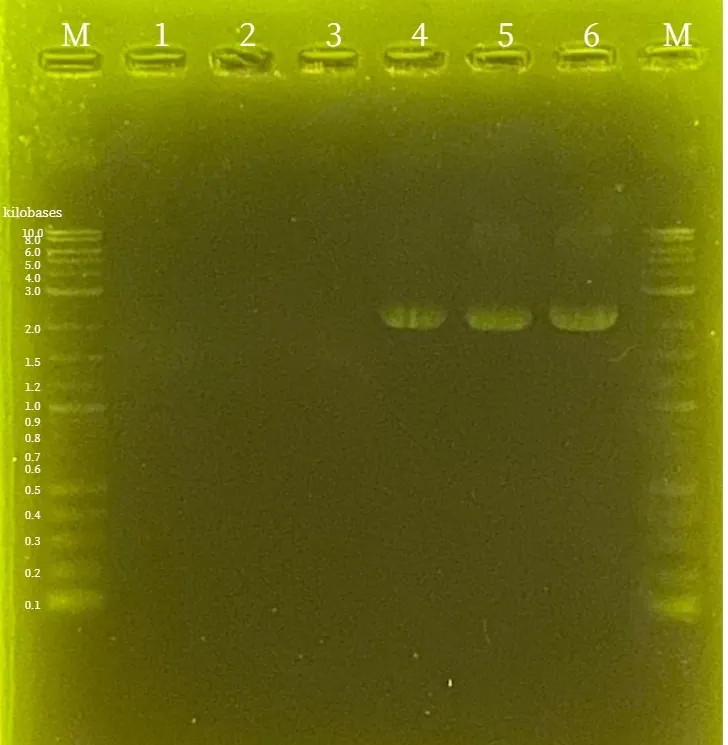
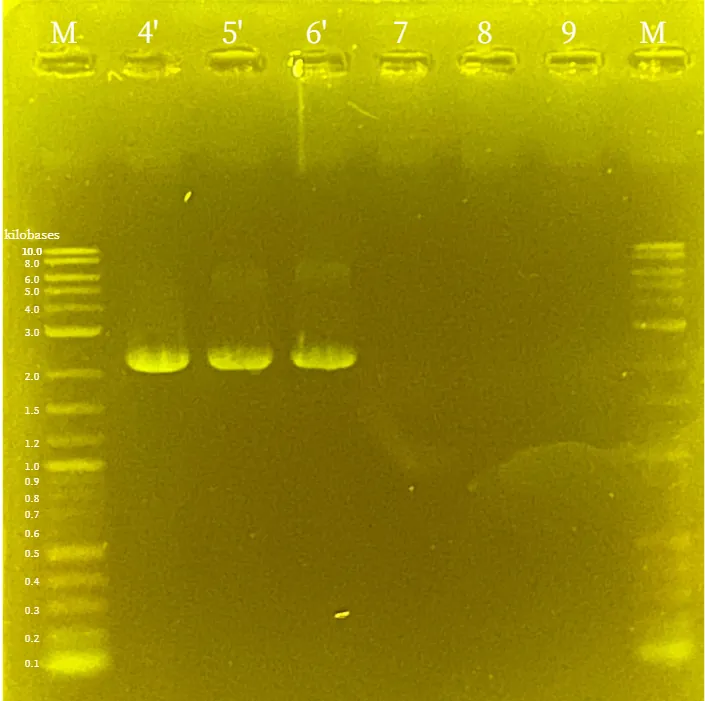
To create clones possessing both of the constructed plasmids, pTf16-xytB-xytC-xytD-xytE and pBl-xylB-xdh-noxE were introduced into BL21(DE3) . We performed colony PCR on the transformed BL21(DE3) and analyzed the results by agarose gel electrophoresis . As shown in the figures, it was confirmed that both pTf16-xytB-xytC-xytD-xytE and pBluescript II SK(-)-xylB-xdh-noxE were successfully introduced into the bacterial cells.


Validation Experiment
Confirmation of Growth with Xylitol as the Sole Carbon Source
In strains expressing the transporter, metabolism was insufficient with isopropyl β-D-1-thiogalactopyranoside(IPTG) induction alone. Therefore, strains were pre-induced for 3 hours with IPTG at a final concentration of 0.5 mM , washed, and then cultured for 72 hours in M9 medium with 0.1 mM IPTG . The experiment was performed under two conditions for the carbon source: one with a glucose concentration of 2 g/L and one with a xylitol concentration of 2 g/L .
The strains used were as follows:
| Strain | Role |
|---|---|
| Wild Type | Negative control |
| pTf16 | Negative control; to confirm the burden of carrying the plasmid |
| pBl-xylB-xdh-noxE | Introduced with the xylitol metabolizing enzyme cluster |
| pBl-xylB-xdh-noxE, pTf16-xytBCDE | Introduced with the xylitol transporter in addition to the xylitol metabolizing enzyme cluster |
The results after 72 hours of culture showed that only the strain introduced with the metabolizing enzymes grew in the medium where xylitol was the sole carbon source. Furthermore, the strain expressing both the xylitol metabolizing enzyme cluster and the transporter grew very little in both the glucose and xylitol media.


From this, it was determined that only the pBl-xylB-xdh-noxE strain, which was introduced with the xylitol metabolizing enzymes, was capable of metabolizing xylitol and growing . The strain introduced with the transporter along with the metabolizing enzymes likely had a high burden and could not grow. Additionally, since pBl-xylB-xdh-noxE had a growth rate that wasn’t significantly different compared to glucose, it’s thought that the transport system for xylose, which E. coli possesses naturally, is sufficient to uptake the amount of xylitol needed for growth.
Co-culture Experiment with a Strain Containing the pTf16 Empty Vector
The ultimate goal for Xylego is to establish it in the gut. A major intention behind designing this xylitol metabolic pathway is to enable coexistence with other gut bacteria by achieving niche separation . To confirm coexistence, we performed a co-culture experiment in M9 medium with 1 g/L xylitol and 1 g/L glucose , using our engineered strain and a strain containing only the pTf16 empty vector .
To simulate a situation where native gut bacteria are already established, we first inoculated the strain containing pTf16 and allowed it to grow overnight . Following this, we inoculated the pBl-xylB-xdh-noxE strain. The cultures were then incubated for 48 hours at 37 ∘C . The resulting culture broth was diluted, and 100 μL of each dilution was plated onto LB plates containing ampicillin and LB plates containing chloramphenicol to measure the CFUs of the pBl-xylB-xdh-noxE and pTf16 strains, respectively.
| No | Strain name | Dilution ratio | Colony count | Bacterial count (/mL) |
|---|---|---|---|---|
| 1 | pBl-xylB-xdh-noxE | 10^4 | 159 | 1.590×10^7 |
| 10^5 | 23 | 2.300×10^7 | ||
| 10^6 | 600 | 6.000×10^9 | ||
| 10^7 | 125 | 1.250×10^10 | ||
| pTf16 | 10^4 | overcrowding | ||
| 10^5 | 1052 | 1.052×10^9 | ||
| 10^6 | 0 | 0 | ||
| 10^7 | 2416 | 2.416×10^11 | ||
| 2 | pBl-xylB-xdh-noxE | 10^4 | 444 | 4.440×10^7 |
| 10^5 | 1824 | 1.824×10^9 | ||
| 10^6 | 1176 | 1.176×10^10 | ||
| 10^7 | 164 | 1.640×10^10 | ||
| pTf16 | 10^4 | overcrowding | ||
| 10^5 | overcrowding | |||
| 10^6 | overcrowding | |||
| 10^7 | 5000 | 5.000×10^11 | ||
| 3 | pBl-xylB-xdh-noxE | 10^4 | overcrowding | |
| 10^5 | 157 | 1.570×10^8 | ||
| 10^6 | 31 | 3.100×10^8 | ||
| 10^7 | 13 | 1.300×10^9 | ||
| pTf16 | 10^4 | overcrowding | ||
| 10^5 | 4000 | 4.000×10^9 | ||
| 10^6 | 584 | 5.840×10^9 | ||
| 10^7 | 331 | 3.310×10^10 |
| No | Strain name | Dilution ratio | Colony count | Bacterial count (/mL) |
|---|---|---|---|---|
| 1 | pBl-xylB-xdh-noxE | 10^4 | 352 | 3.520×10^7 |
| 10^5 | 52 | 5.200×10^7 | ||
| 10^6 | 2 | 2.000×10^7 | ||
| 10^7 | 0 | 0 | ||
| pTf16 | 10^4 | overcrowding | ||
| 10^5 | 271 | 2.710×10^8 | ||
| 10^6 | 34 | 3.400×10^8 | ||
| 10^7 | 2152 | 2.152×10^11 | ||
| 2 | pBl-xylB-xdh-noxE | 10^4 | 348 | 3.480×10^7 |
| 10^5 | 584 | 5.840×10^8 | ||
| 10^6 | 282 | 2.820×10^9 | ||
| 10^7 | 437 | 4.370×10^10 | ||
| pTf16 | 10^4 | overcrowding | ||
| 10^5 | overcrowding | |||
| 10^6 | 360 | 3.600×10^9 | ||
| 10^7 | 343 | 3.430×10^10 | ||
| 3 | pBl-xylB-xdh-noxE | 10^4 | 78 | 7.800×10^6 |
| 10^5 | 9 | 9.000×10^6 | ||
| 10^6 | 0 | 0 | ||
| 10^7 | 0 | 0 | ||
| pTf16 | 10^4 | overcrowding | ||
| 10^5 | 356 | 3.560×10^8 | ||
| 10^6 | 234 | 2.340×10^9 | ||
| 10^7 | 26 | 2.600×10^9 |
Based on these results, we concluded that the cell counts for pBl-xylB-xdh-noxE (in Table 2) and the cell count for pTf16 (in column 2 of Table 3) did not change significantly across different dilution factors. We therefore considered these results to be outliers, likely due to insufficient dilution.


These results demonstrate that our engineered strain can secure a nutritional niche and grow by utilizing xylitol as a prebiotic , even when the native bacteria (simulated by the empty vector strain) maintain a state of dominance.
Measurement of Individual Proteins by SDS-PAGE
E. coli cells were cultured until the OD600 reached 0.4 , at which point IPTG was added to a final concentration of 1 mM , and the cells were incubated for 3 hours at 37℃ . Cells were harvested by centrifugation at 6,000×g for 10 min , washed with PBS , and resuspended in SDS-PAGE sample buffer containing BPB , DTT , and SDS . Samples were heated at 95∘C for 3 min before electrophoresis. A 17.5% acrylamide gel was used and stained with Sypro Ruby . Lane ① contains the LMW marker , with a total of 4μg applied. Lane ⑫ is the negative control E. coli strain carrying pTf16 . Lane ⑬ carries pBl-xylB-xdh-noxE , and lane ⑭ carries both pBl-xylB-xdh-noxE and pTf16-xytB-xytC-xytD-xytE . For electrophoresis, lanes ⑫ and ⑬were ultimately concentrated 8-fold , and lane ⑭ was concentrated 120-fold .
Protein quantification was performed using Fiji and Band Peak Quantification [37]. By comparing with the marker, specifically using the 97, 66, 20.1, and 14.4 kDa bands, we were able to determine the relationship between the band signal and the amount of protein.
| protein | molecular weight (kDa) |
|---|---|
| XylB | 52.6 |
| Xdh | 27.8 |
| NoxE | 49 |
| XytB | 33.1 |
| XytC | 22.2 |
| XytD | 56 |
| XytE | 37.3 |

| protain | Protein concentration [µg/µL] | Number of molecules per cell |
|---|---|---|
| D-xylose Kinase (xylB) | 0.003044846 | 348594.3996 |
| xylitol dehydrogenase (xdh) | 0.005079611 | 1100338.715 |
| noxE | 0.003394896 | 417225.8262 |
| protein | Protein concentration [µg/µL] | Number of molecules per cell |
|---|---|---|
| D-xylose Kinase (xylB) | 0.000203225 | 23266.55632 |
| xylitol dehydrogenase (xdh) | 0.0000145 | 31409.69819 |
| noxE | 0.00029622 | 36404.89238 |
| xytB | 0.000122315 | 22253.21501 |
| xytC | 0.000139106 | 37734.00742 |
| xytD | 0.000126267 | 13578.18994 |
| xytE | Not detectable | Not detectable |
This data confirmed the advantage of pBl-xylB-xdh-noxE in xylitol metabolism, as it expressed the metabolic enzymes at nearly 10 times higher levels than the strain introduced with both the metabolic enzymes and the transporter (pBl-xylB-xdh-noxE, pTf16-xytB-xytC-xytD-xytE).
Furthermore, the results showed that the transporter was not sufficiently expressed in the strain that included it, confirming that the high metabolic burden likely prevented its effective production.
Confirmation Experiment for Precipitate
An experiment was conducted to determine the nature of the precipitate that occurred during the validation experiment for growth in the presence of xylitol. When EDTA and EGTA were added to the precipitate, about 80% of the precipitate dissolved in EDTA , while little dissolved in EGTA . Therefore, it is highly likely that this precipitate consists mostly of magnesium phosphate .

Mucosal Healing
Plasmid Construction
After obtaining the necessary elements for plasmid construction, we used HiFi assembly to construct two plasmids: one containing the epidermal growth factor (EGF) and another containing the secretion proteins PrtD, E, and F .


These plasmids were transformed into E. coli DH5 for amplification. Plasmid DNA was extracted from these clones using the Miniprep method .
Strain Construction
To create clones possessing two types of plasmids, we introduced pTf16-lac-PrtD-PrtE-PrtF and pBluescript II SK(-)-6xHis-EGF-Lard3 into BL21(DE3) , and pTf16-J23118-PrtD-PrtE-PrtF and pBluescript II SK(-)-6xHis-EGF-Lard3 into BL21(DE3) , creating two different strains. Colony PCR was performed on the transformed BL21(DE3) strains and analyzed by agarose gel electrophoresis . As shown in the figures, it was confirmed that two plasmids were successfully introduced into the bacterial cells for both combinations: pTf16-lac-PrtD-PrtE-PrtF with pBluescript II SK(-)-6xHis-EGF-Lard3 , and pTf16-J23118-PrtD-PrtE-PrtF with pBluescript II SK(-)-6xHis-EGF-Lard3 .


Validation Experiment
Cell Recovery Experiment
A monolayer of confluent C2BBe1 cells was scratched with a p200 tip , and the wound healing was observed using a phase-contrast microscope . The wound area was determined using Fiji with polygonal approximation.
- Cultured in DMEM containing 10% FBS. Measured at 3 locations, and images were taken at 0, 24, 48, and 72 h .
- Cultured in DMEM containing 10% FBS with EGF added to a concentration of 50 ng/mL. Measured at 3 locations, and images were taken at 0, 24, 48, and 72 h .
Results of wound healing assay


- Cultured in DMEM containing 10% FBS. Measured at 2 locations, and images were taken at 0, 24, and 48 h .
- Cultured in DMEM containing 10% FBS with EGF added to a concentration of 5 ng/mL. Measured at 2 locations, and images were taken at 0, 24, and 48 h .
- Cultured in DMEM containing 10% FBS with EGF added to a concentration of 10 ng/mL. Measured at 2 locations, and images were taken at 0, 24, and 48 h .
- Cultured in DMEM containing 10% FBS with EGF added to a concentration of 50 ng/mL. Measured at 2 locations, and images were taken at 0, 24, and 48 h .


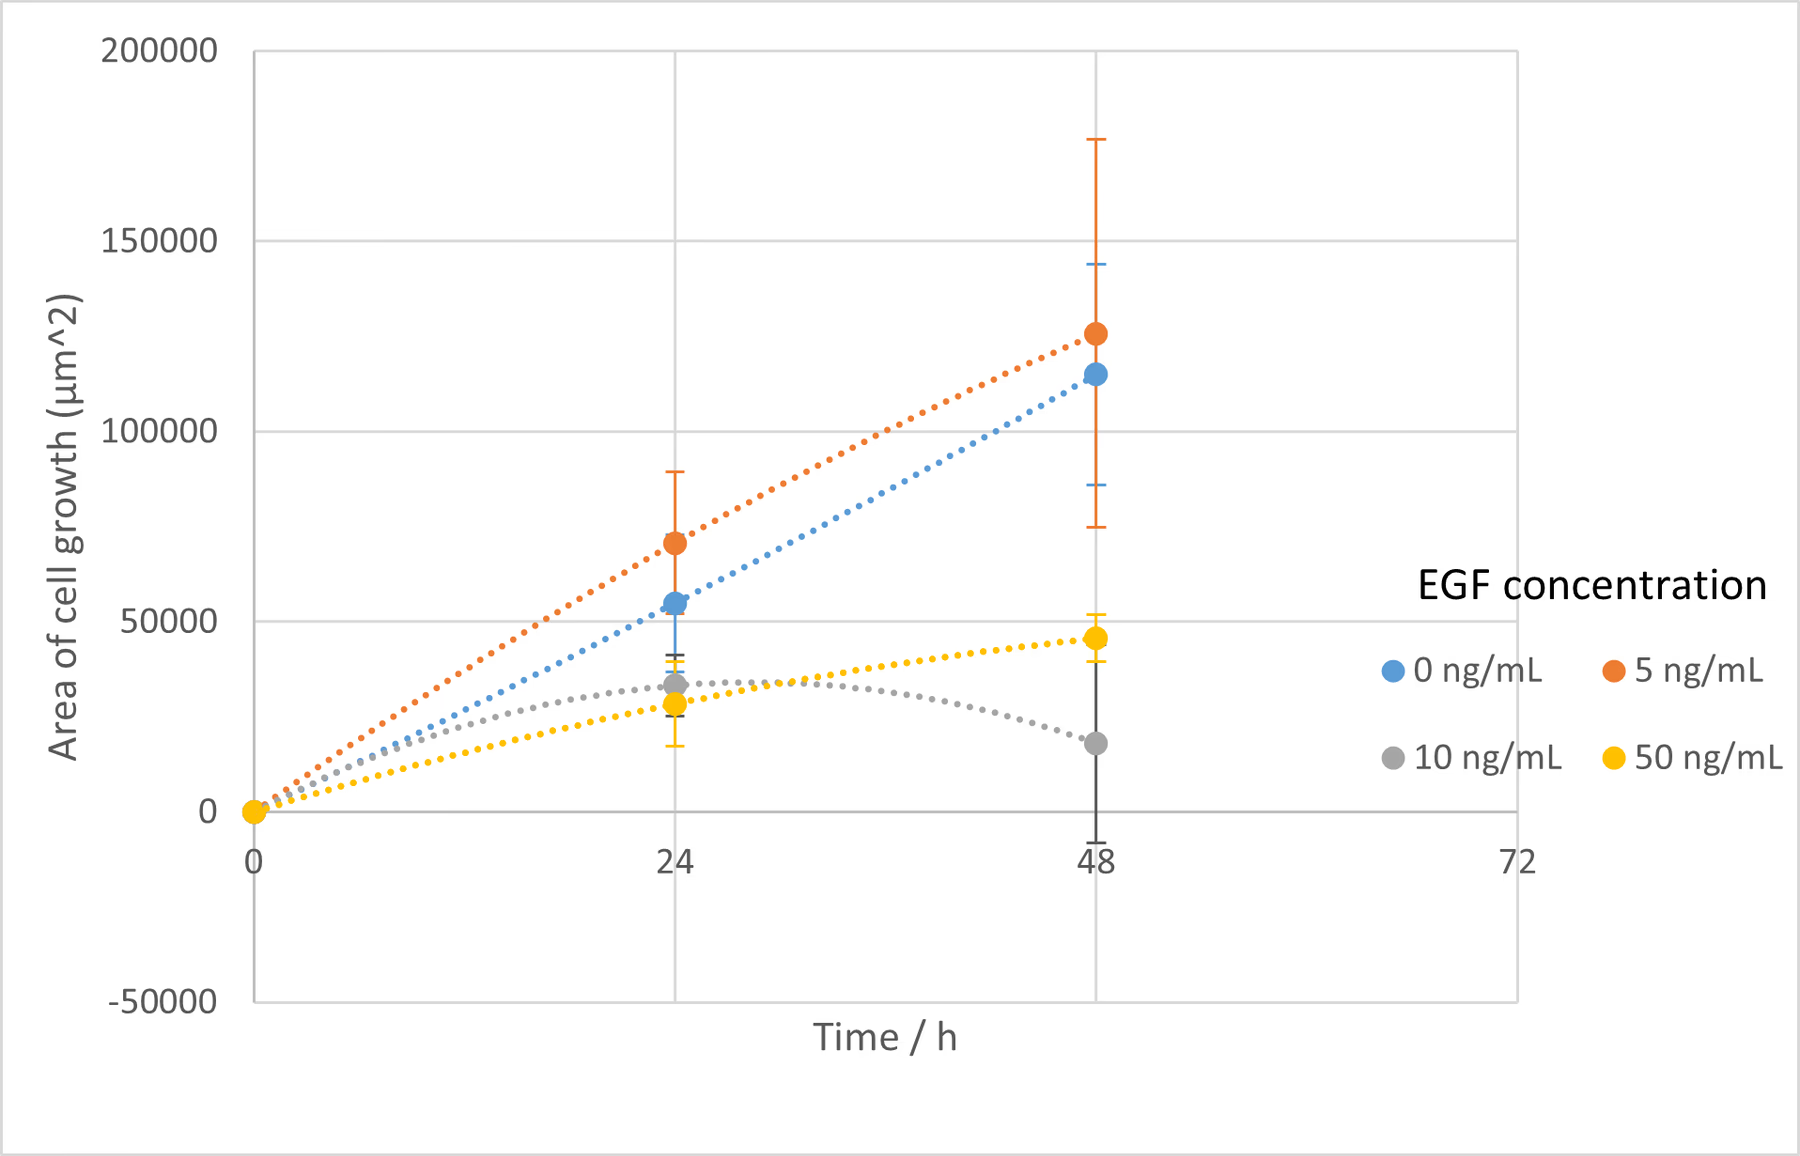
In this experiment, we were unable to accurately measure the area due to camera view shifts . Therefore, we utilized time-lapse photography for the next experiment.
- Cultured in DMEM containing 10% FBS. Images were taken every 3 h between 0–48 h .
- Cultured in DMEM containing 10% FBS with EGF added to 16 ng/mL. Images were taken every 3 h between 0–48 h .
- Cultured in DMEM containing 10% FBS with EGF added to 50 ng/mL. Images were taken every 3 h between 0–48 h .
- Cultured in DMEM containing 10% FBS with EGF added to 100 ng/mL. Images were taken every 3 h between 0–48 h .
- Cultured in DMEM containing 10% FBS with EGF added to 300 ng/mL. Images were taken every 3 h between 0–48 h .


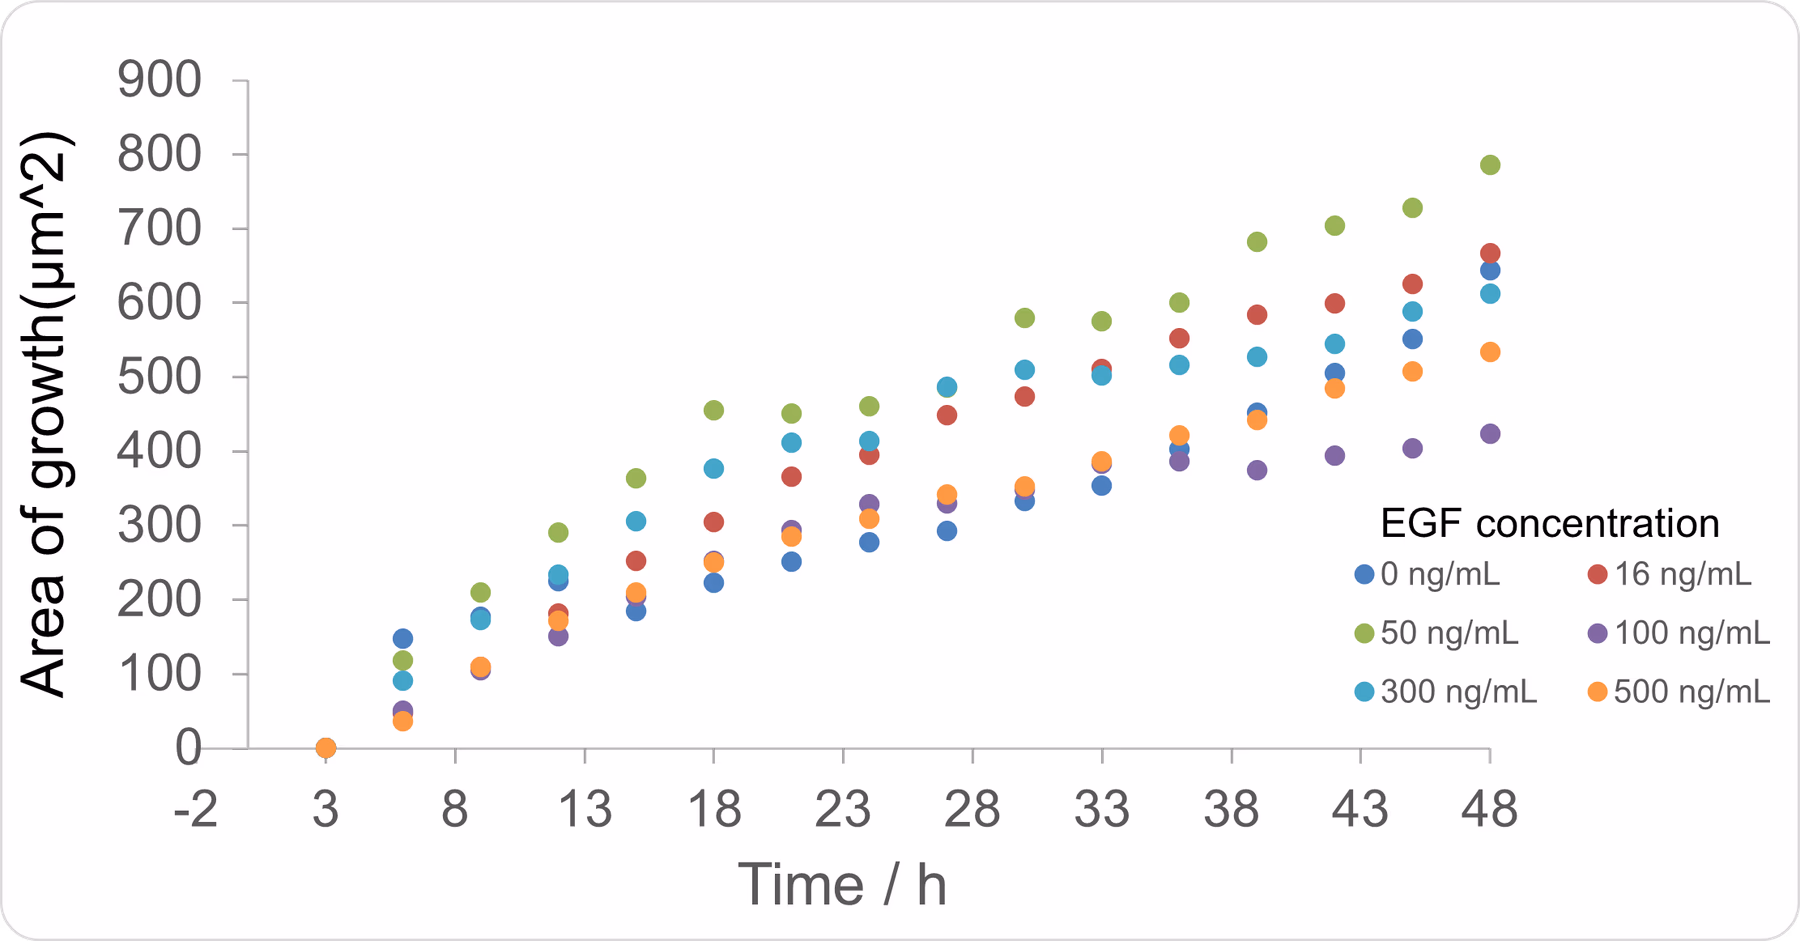
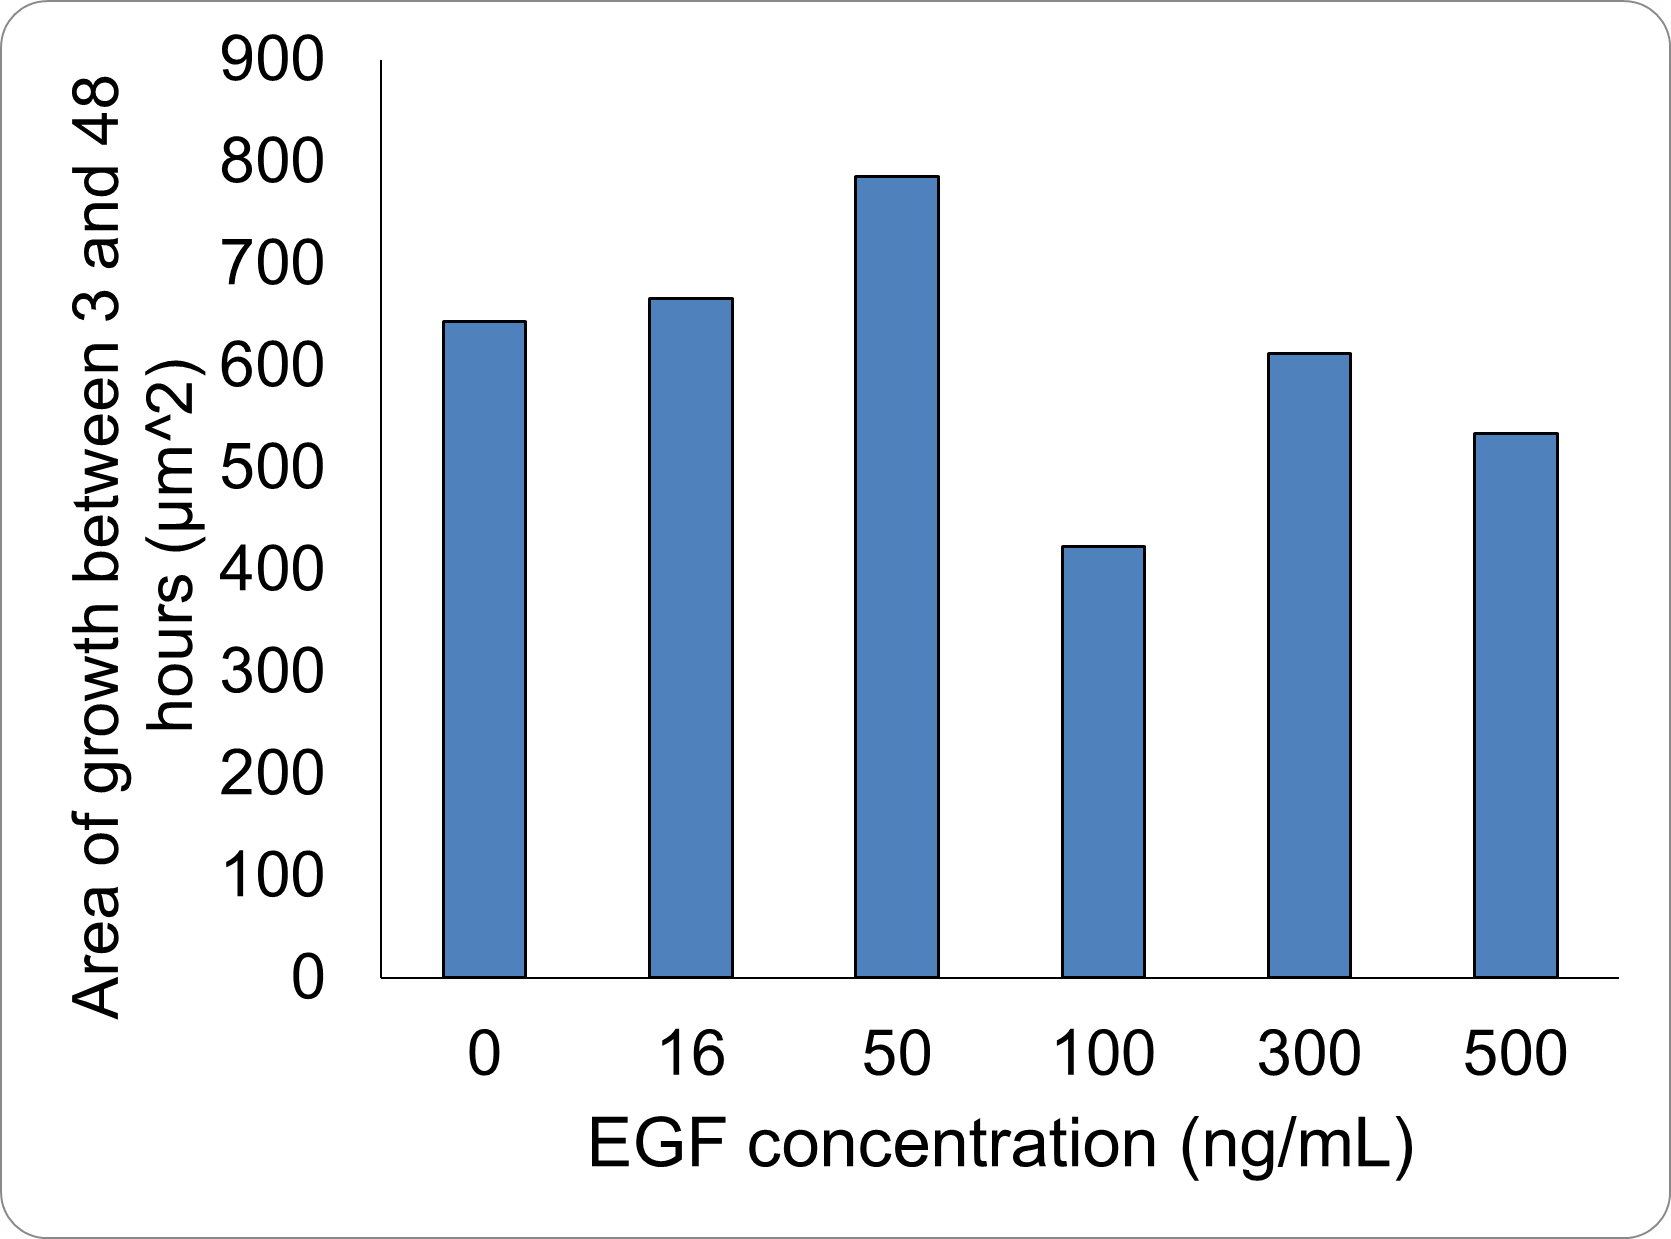
The wound area was determined using Fiji and the Wound healing size tool [38]. The cell wound recovered faster as the EGF concentration increased up to 50 ng/mL , and wound recovery was confirmed even at 16 ng/mL . At concentrations greater than 50 ng/mL , the recovery rate was actually slower. It has been reported that EGF above a certain concentration can inhibit cell proliferation , and a tendency for this inhibition was observed in our experiment above 50 ng/mL . The concentration at which this inhibition begins to take effect is lower when the cell’s EGFR expression level is high, a phenomenon often observed in cancer cells , which have high EGFR expression. Numerous literature values for this inhibitory concentration exist, such as 25 ng/mL and 100 ng/mL , depending on the cell type[39][40]. Since the C2BBe1 cells used here are derived from cancer cells, this phenomenon is likely to have occurred. It appears that 50 ng/mL is the most efficient concentration for promoting proliferation in the cells used in this study.
Furthermore, once EGF binds to EGFR and initiates signal transduction, a negative feedback loop causes the signal to attenuate as the EGF-bound EGFR is internalized[41]. In this case, signal transduction cannot occur again unless new EGFR is expressed. Therefore, the effect of EGF is temporary. In actual experiments using bacterial cells, EGF is constantly being released from the bacteria. Thus, by maintaining a steady concentration, continuous EGF production can be achieved, and a sufficient therapeutic effect can be expected.
Quantification of EGF Expression
IPTG
was added to a large volume E. coli culture to a final concentration of
0.8 mM
and incubated
overnight at 20℃
. Cells were harvested by centrifugation, subjected to
sonication
, and the
supernatant
was electrophoresed on a
15% acrylamide gel
. The cell sample was ultimately concentrated
30-fold
. It was then transferred to a
PVDF membrane
and detected using an
anti-6xHis antibody
.


The 6xHis-EGF-LARD3 fusion protein has a size of 18.7 kDa . A band of approximately 20 kDa is visible in lane ③ of the Western Blotting result(Figure41), which was considered to be the 6xHis-EGF-LARD3 fusion protein . Next, we determined the concentration of the 6xHis-EGF-LARD3 fusion protein. Band quantification was performed using Fiji and Band Peak Quantification [37]. Since the CBB-R staining could not accurately correlate the band signal with the protein amount of the LMW marker , the concentration was determined by selecting a single marker band.
| LMW marker bands | Calculated amount of loaded 6×His-EGF-LARD3 (μg) | Calculated concentration in growth medium (μg/mL) |
|---|---|---|
| 66 kDa | 0.40 | 0.67 |
| 45 kDa | 0.97 | 1.62 |
| 30 kDa | 1.03 | 1.71 |
| 20.1 kDa | 0.78 | 1.30 |
We were unable to confirm secretion in the previous experiment. In the current experiment, IPTG was added to a concentration of 1 mM when OD600 was around 0.4 , and the culture was incubated for 3 hours at 37℃ . Cells were harvested by centrifugation and washed with PBS (pH 7.2) . Cells were resuspended directly in Electrophoresis Sample Buffer and heated at 95 ∘C for 3 minutes . For electrophoresis, the cell samples (②,④,⑩,⑫) were concentrated 8-fold , ⑥ was concentrated 24-fold , and ⑧ was concentrated 120-fold . The culture supernatant was concentrated 30-fold by ultrafiltration to increase the concentration.
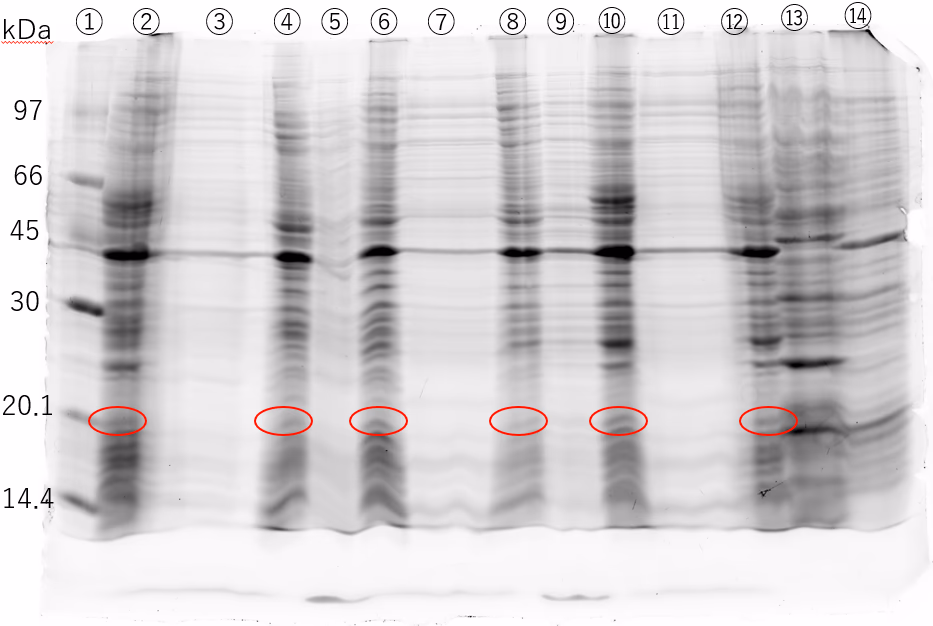
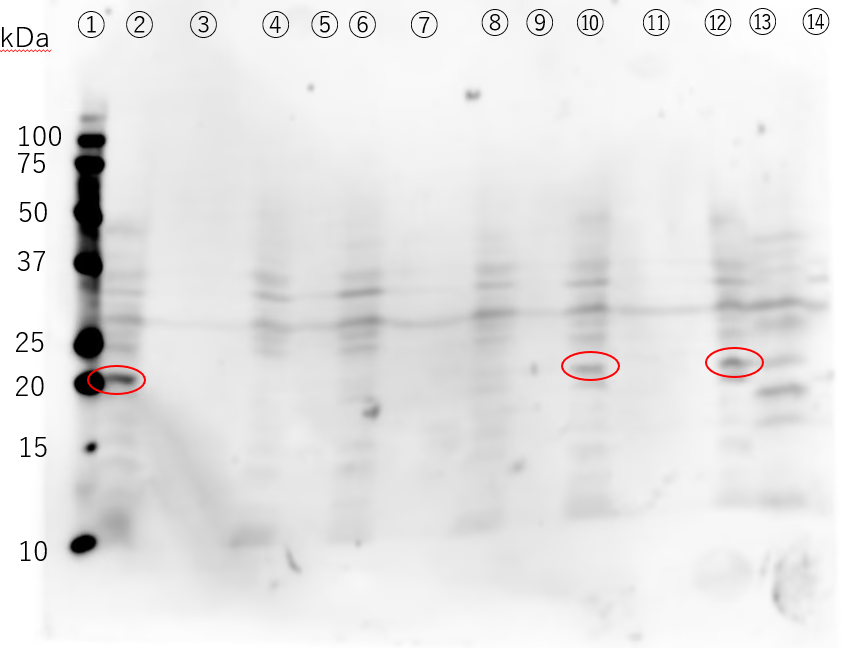
The Western Blotting results show a band around 20 kDa in lane ②. While this was expected to be 6xHis-EGF-LARD3 , a similar band is also visible in the negative controls, ⑩ and ⑫ (in the Figure). Since the antibody used in this experiment was HRP conjugated anti 6xHis antibody , there is a possibility that it detected proteins other than the target. Furthermore, there is no band around 20 kDa in the culture supernatants. To confirm the production of 6xHis-EGF-LARD3, it is necessary to sequence the constructed plasmid and use a different antibody . Additionally, the culturing conditions need to be reconsidered . Since EGF contains six cysteines , it’s thought to be prone to forming inclusion bodies . It is necessary to repeat the experiment, changing the IPTG concentration and the temperature after induction .
Kill Switch
Plasmid Construction
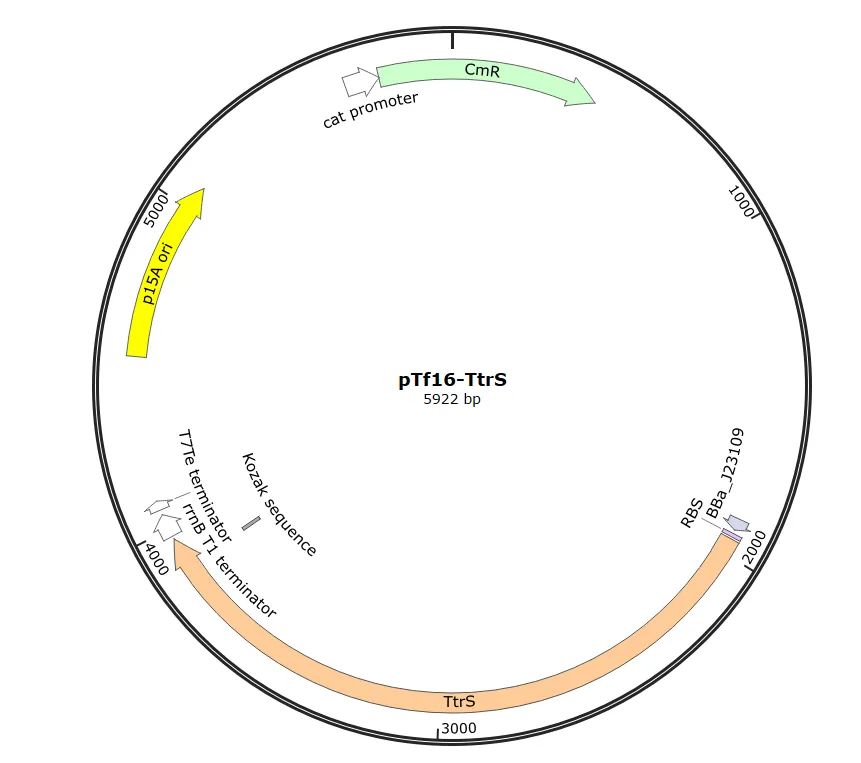
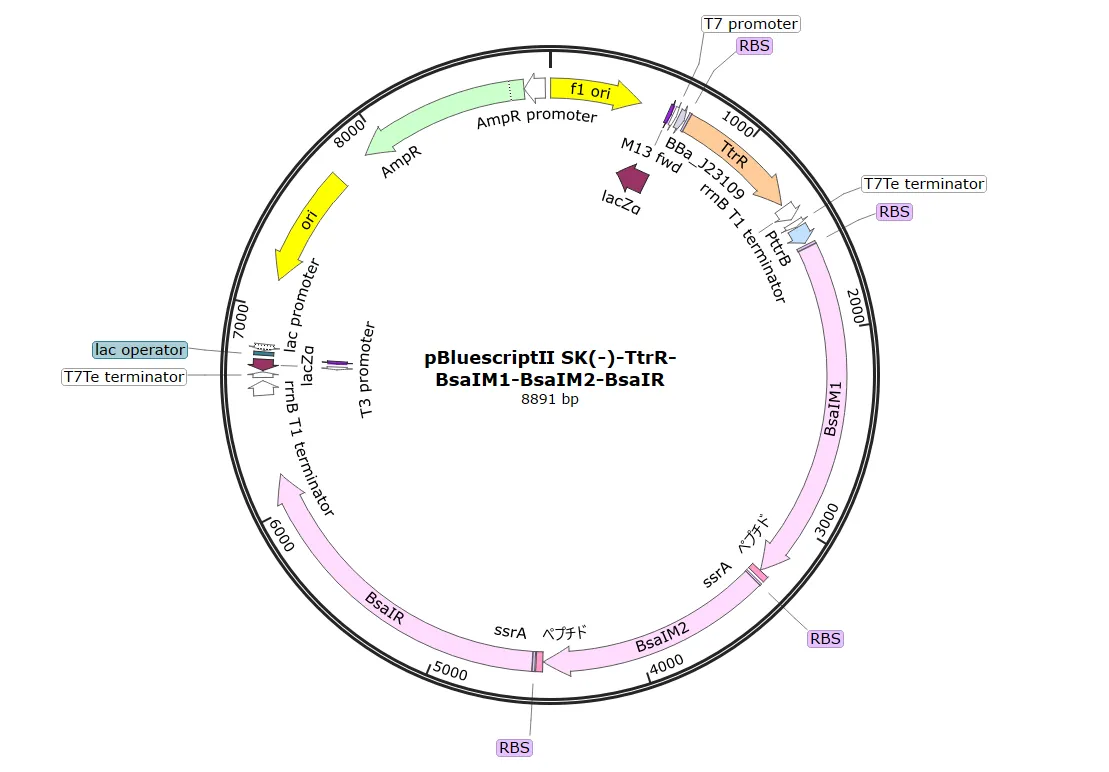
After obtaining the necessary elements for plasmid construction, we used HiFi assembly to construct two plasmids: one containing TtrS , which senses tetrathionate , and another containing the restriction enzyme BsaIR and the methylase BsaIM , among other elements.
These plasmids were transformed into DH5 for amplification. Plasmid DNA was extracted from these clones using the Miniprep method.
Strain Construction
To create clones possessing both constructed plasmids,
pTf16-TtrS
and
pBl-TtrR-BsaIM1-BsaIM2-BsaIR
were introduced into
BL21(DE3)
.
Colony PCR
was performed on the transformed
BL21(DE3)
and analyzed by
agarose gel electrophoresis
. As shown in the figure46 and figure47, it was confirmed that both
pTf16-TtrS
and
pBl-TtrR-BsaIM1-BsaIM2-BsaIR
were successfully introduced into the
BL21(DE3)
cells.
Validation Experiment1
Kill Switch Activation Experiment
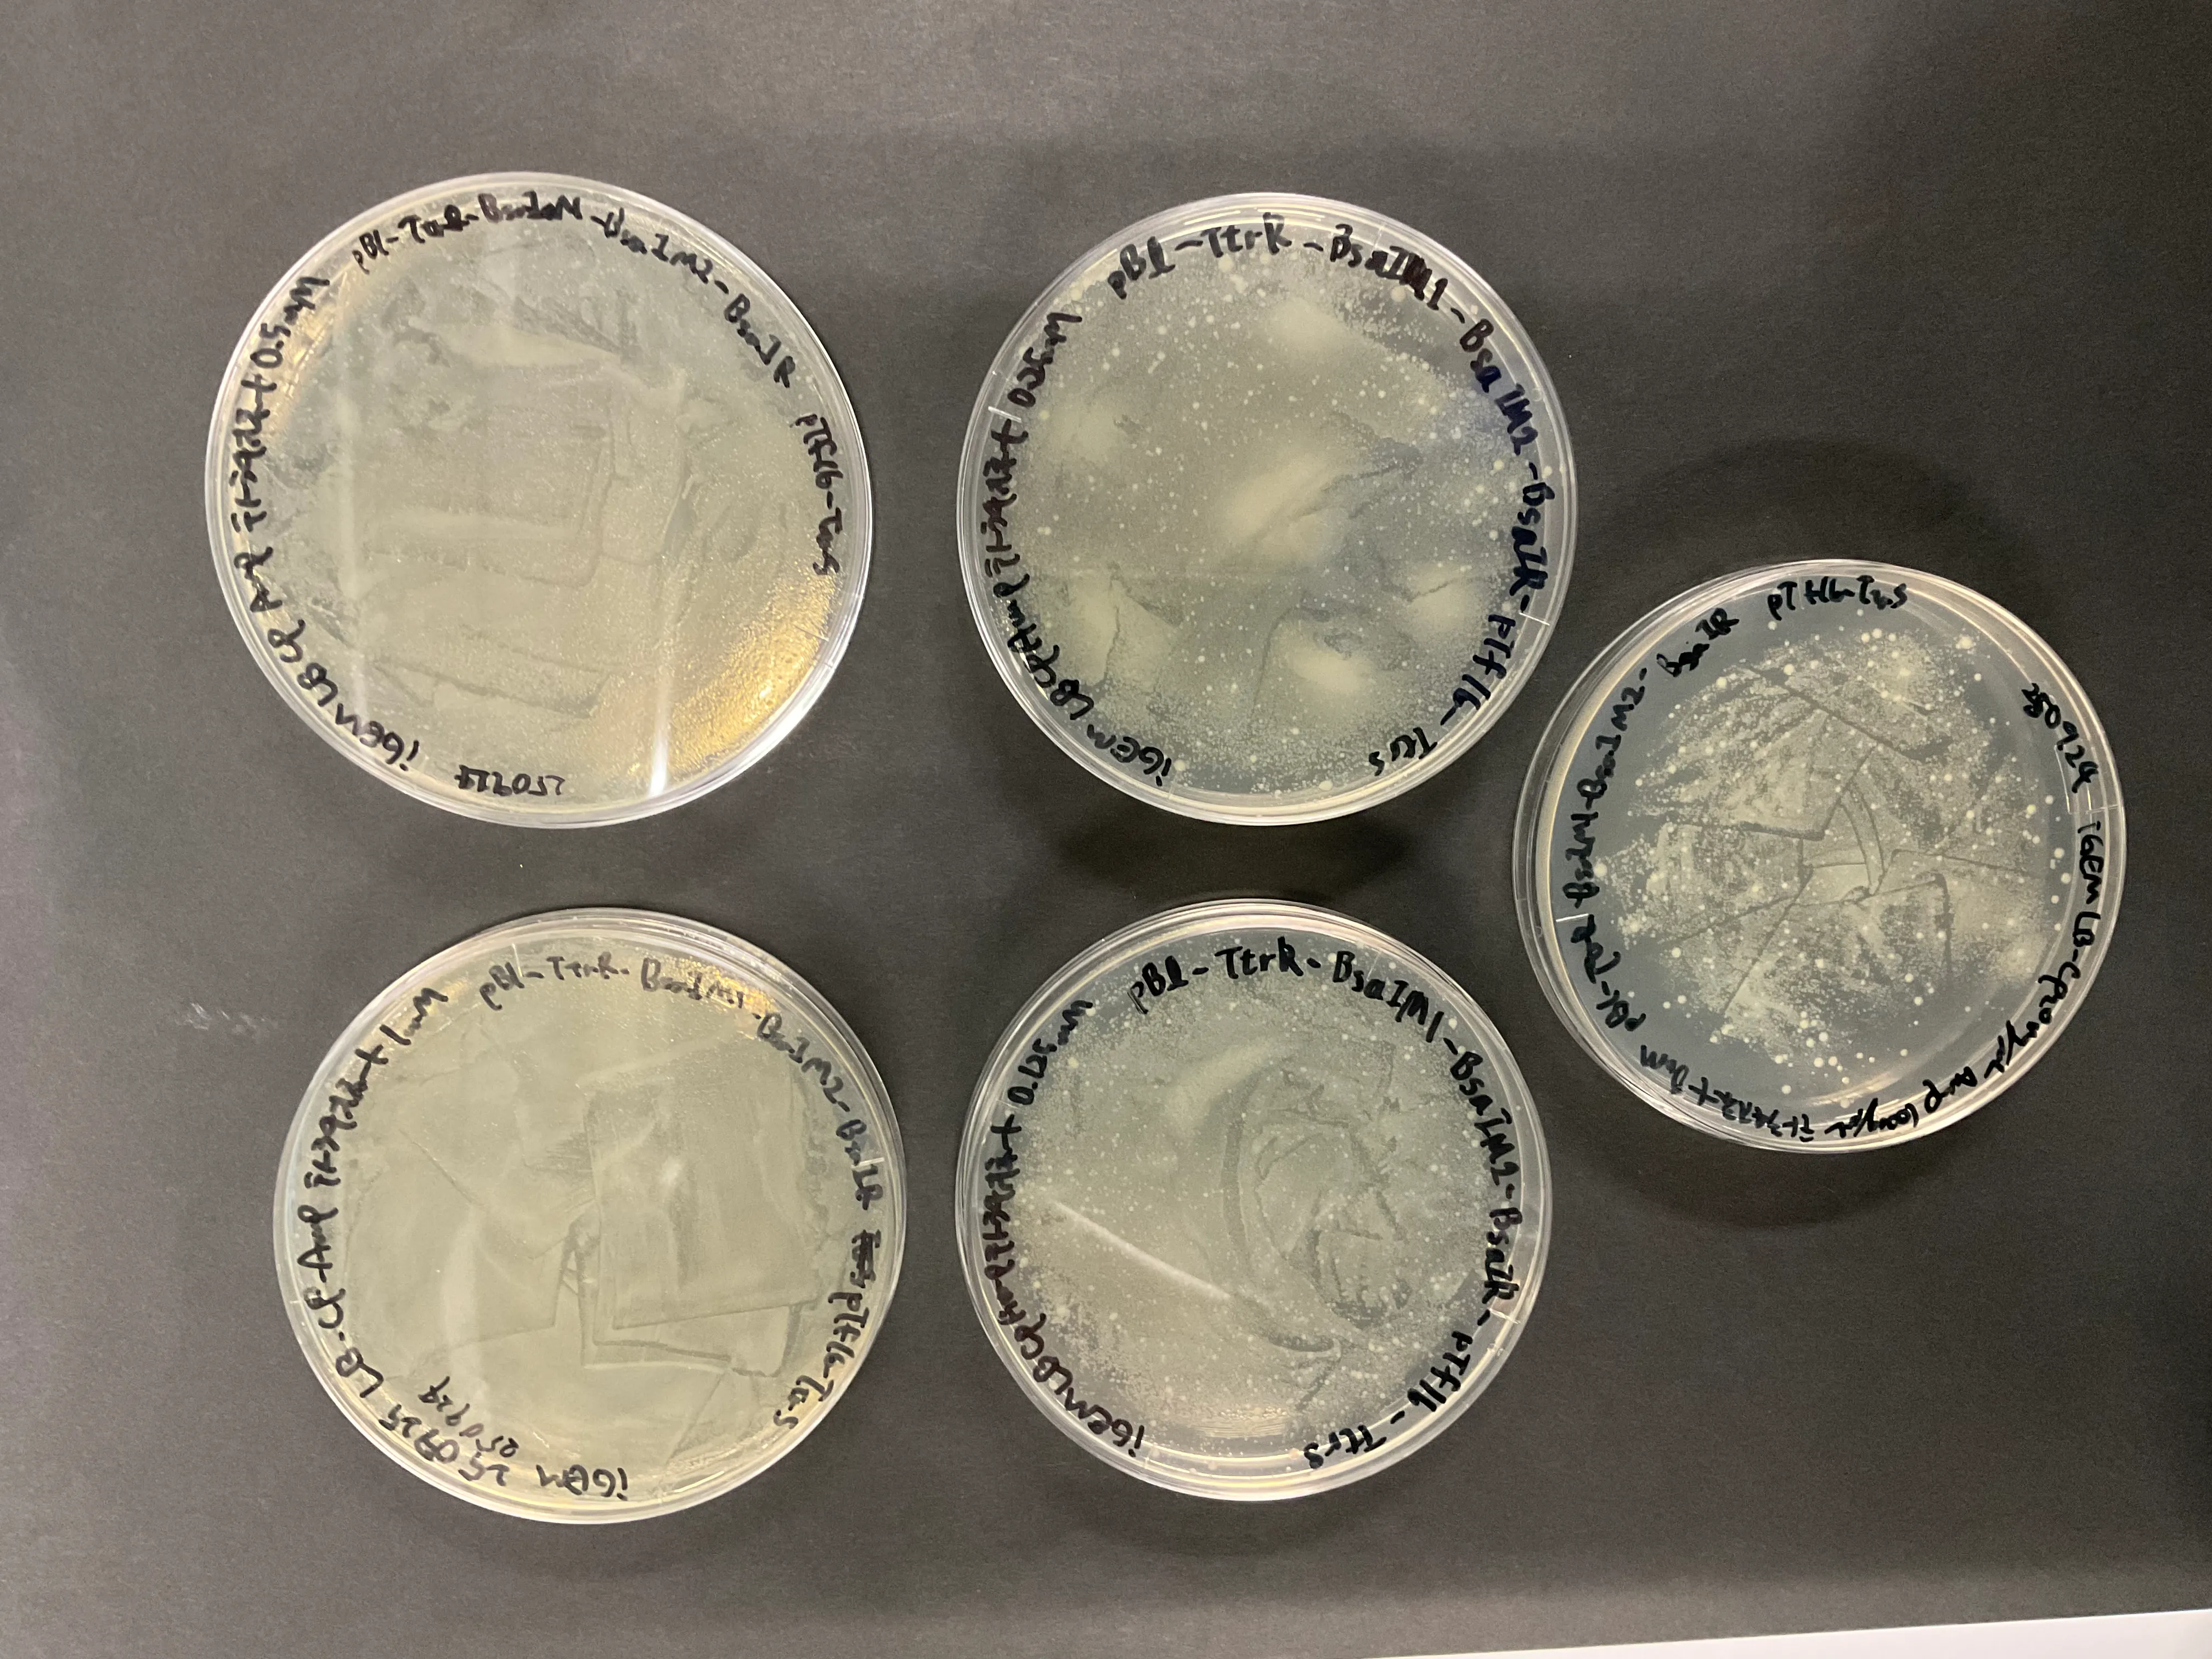
To verify the function of the Kill Switch , we cultured the strain in a medium with 1 mM tetrathionate and then plated it onto plates containing tetrathionate at concentrations of 1,0.5,0.25,0.125 mM . As a result, E. coli growth was confirmed on all plates , as shown in the picture below.
Our hypothesis was that the bacteria would grow on the 1 mM plate but not survive on the 0 mM plate, and the number of colonies would decrease in a concentration-dependent manner on the intermediate concentration plates[33].
This result suggests that the E. coli can survive even after the tetrathionate is gone (i.e., after treatment). Therefore, future experiments must clarify what prevents the bacteria from dying.
Creation of Validation Plasmids
To verify each component of the system, we newly constructed validation plasmids.
After obtaining the necessary elements for plasmid construction, we used HiFi assembly to construct plasmids containing (gene names).
These plasmids were transformed into DH5 for amplification. Plasmid DNA was extracted from these clones using the Miniprep method , and analysis of the plasmid DNA by agarose gel electrophoresis confirmed that the size of these plasmids was correct.
Additionally, these plasmids were each transformed into the BL21(DE3) strain.
Validation Experiment 2
Tetrathionate Sensing Experiment
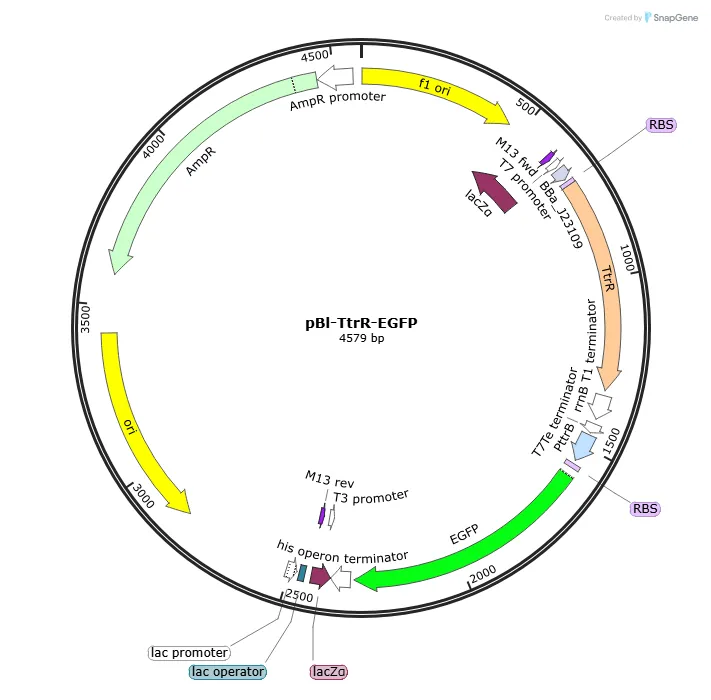
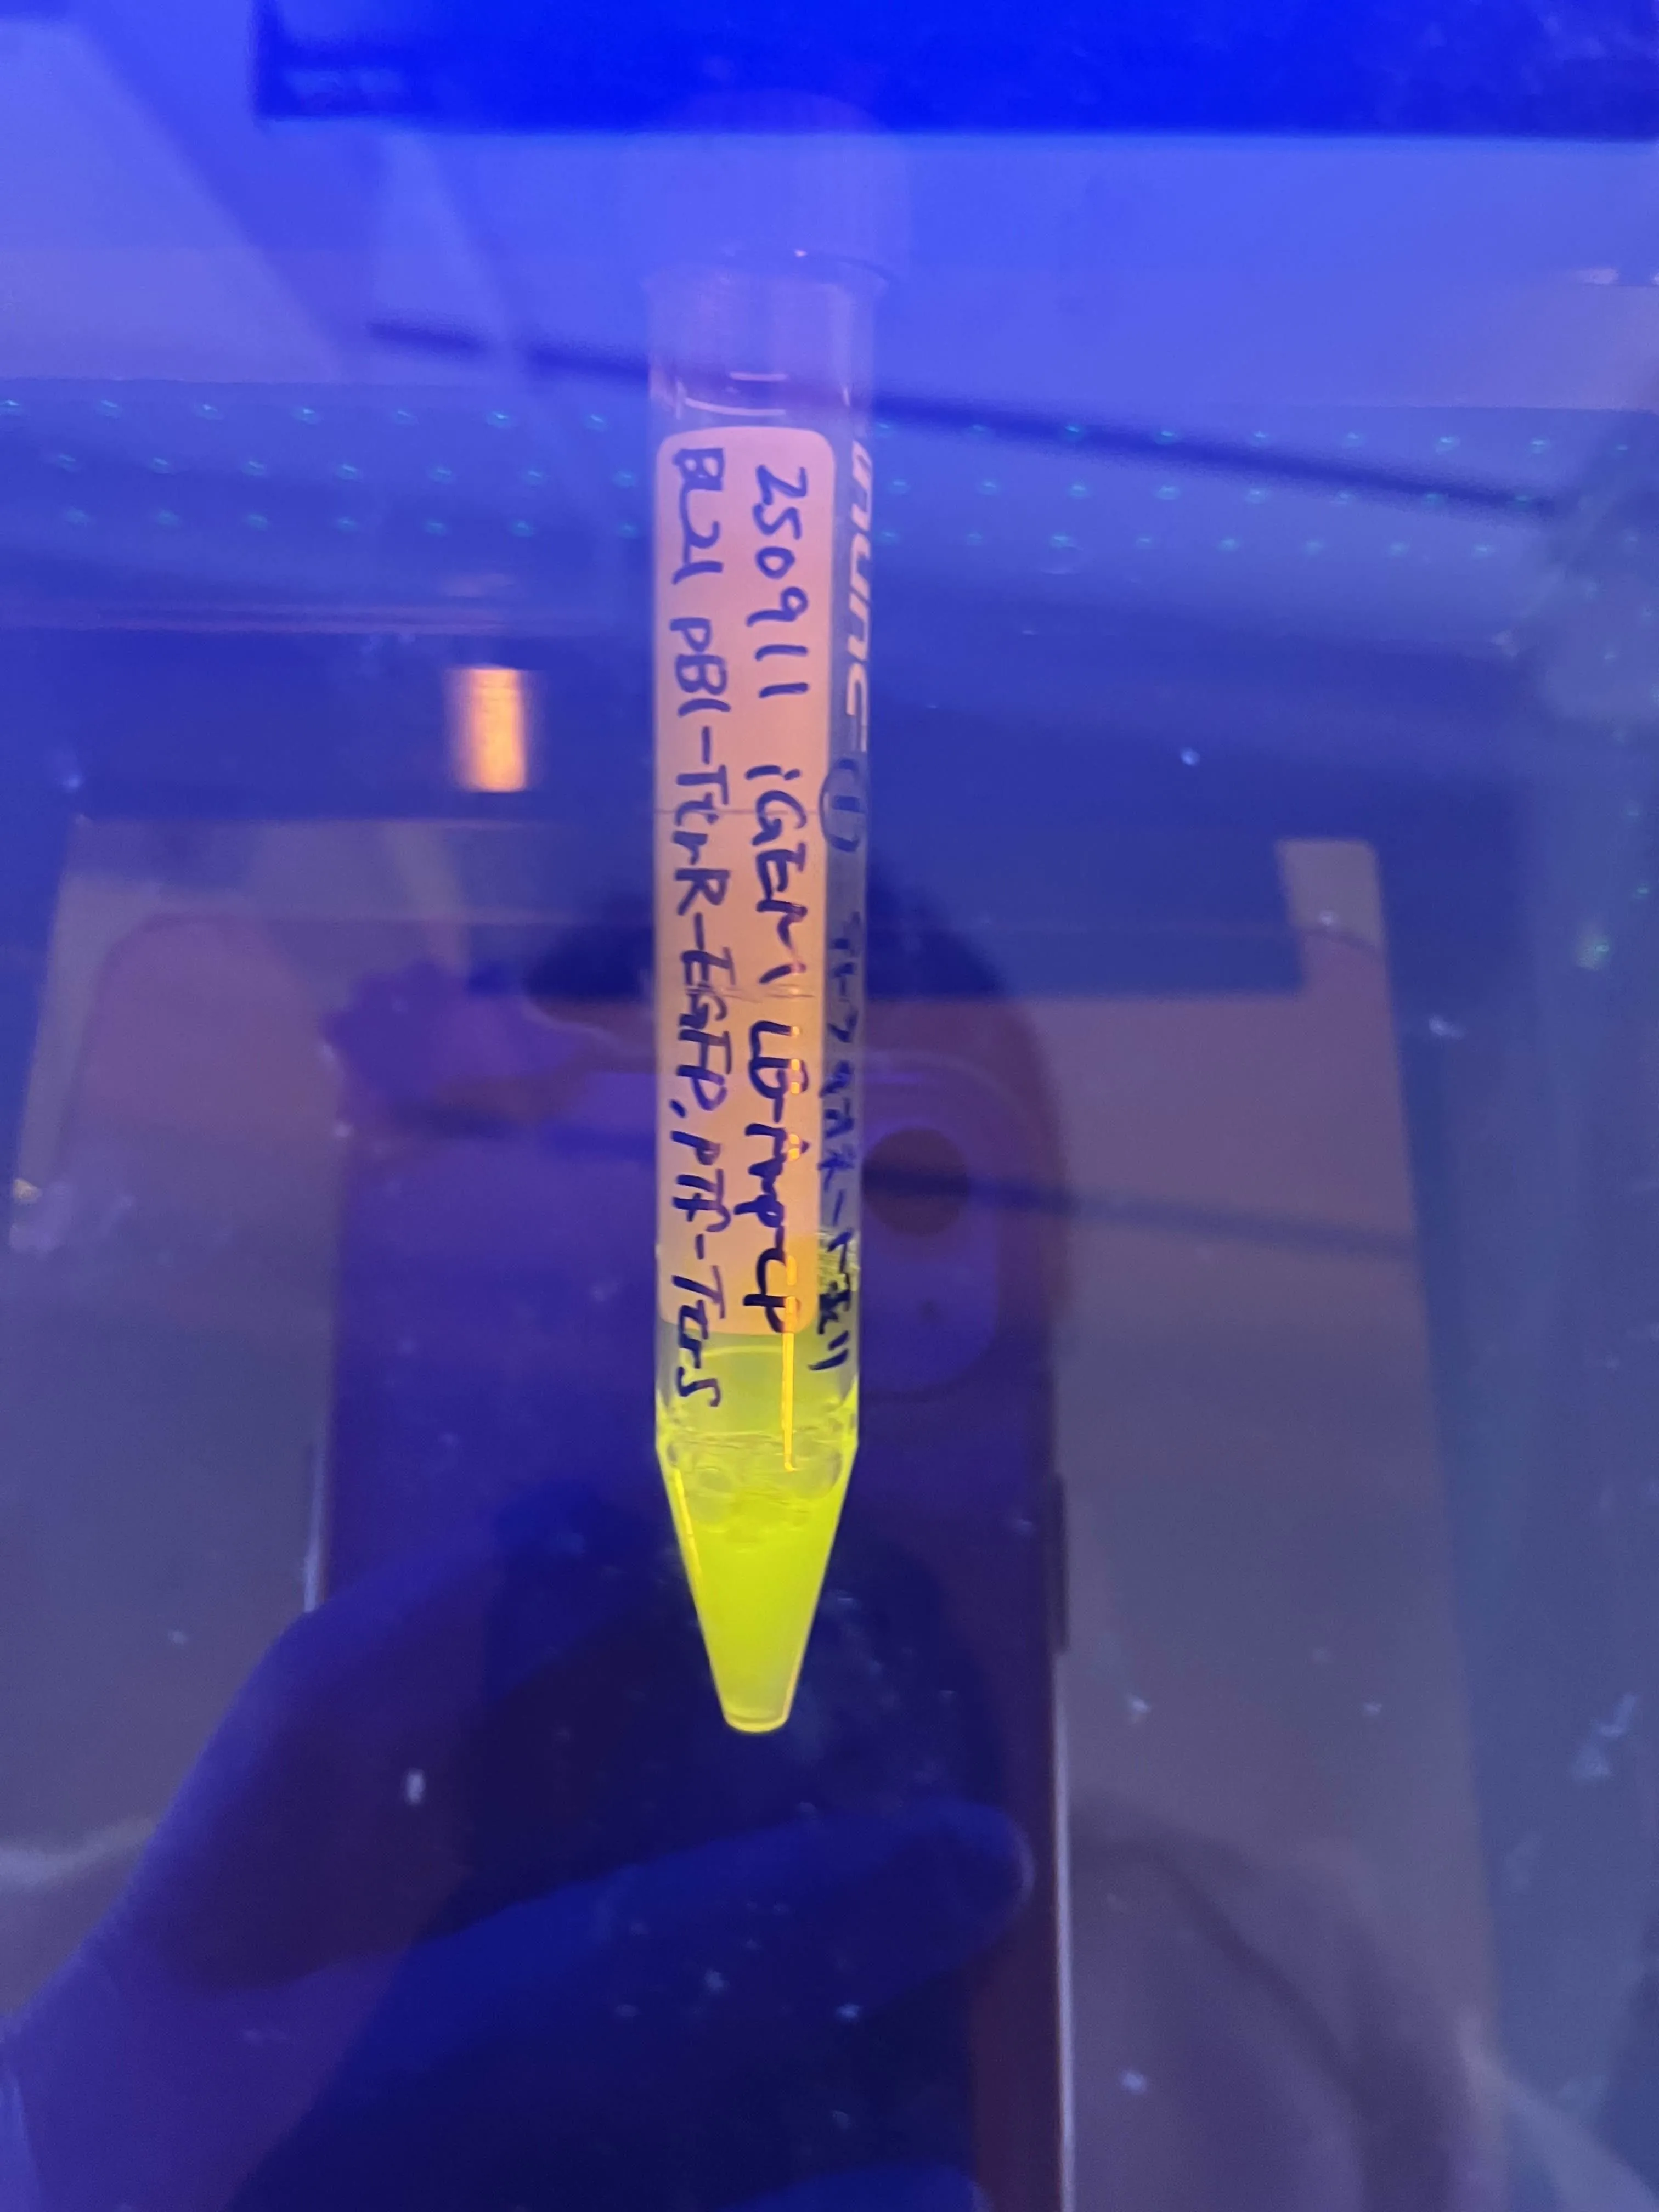
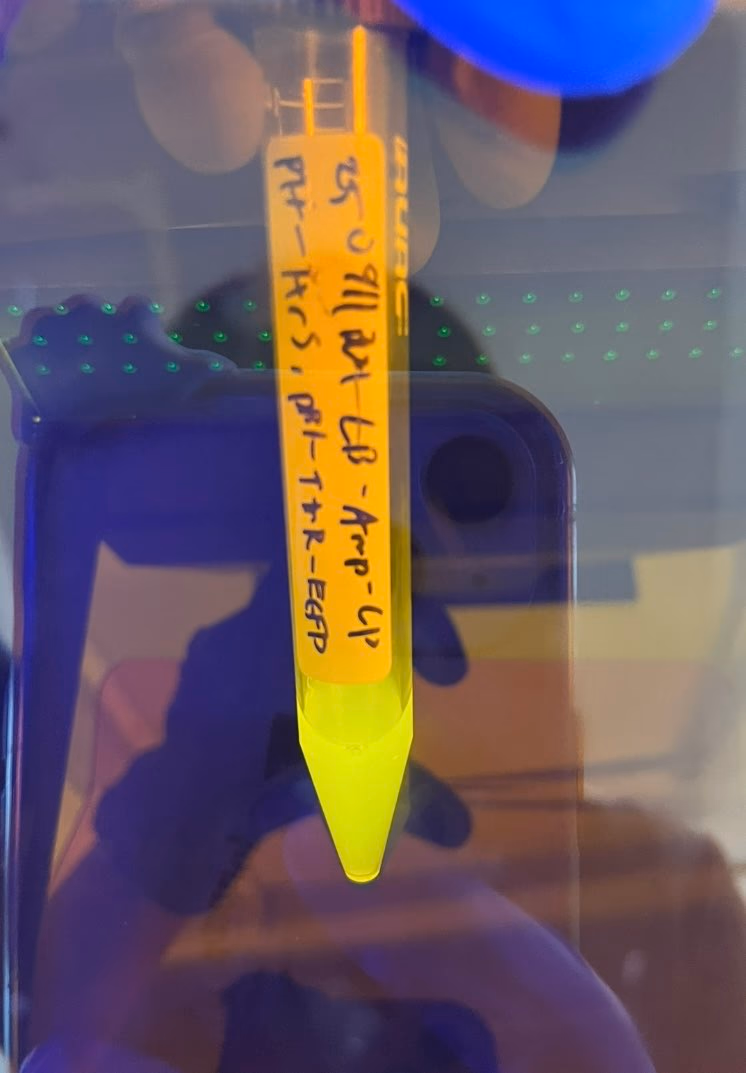
In the Kill Switch system we designed, TtrS senses tetrathionate and phosphorylates TtrR , which then activates the downstream promoter. When tetrathionate is no longer sensed, the promoter should stop, the modification enzymes should degrade faster than the restriction enzyme, and the bacteria should die. To confirm tetrathionate reception, we cultured a strain containing both pTf-TtrS and pBl-TtrR-EGFP overnight in a medium with 1 mM tetrathionate .
Fluorescence was confirmed in the tube after culturing. However, fluorescence was also confirmed in the medium without added tetrathionate .
This suggests that the promoter downstream of TtrR is leaking .
This promoter leakage is considered to be the reason why the E. coli that should have died in Validation Experiment 1 did not.
Restriction Enzyme Activation Experiment
Acknowledging the promoter leakage, we conducted an experiment using a plasmid with a different promoter to confirm that the restriction enzyme would function and kill the bacteria.
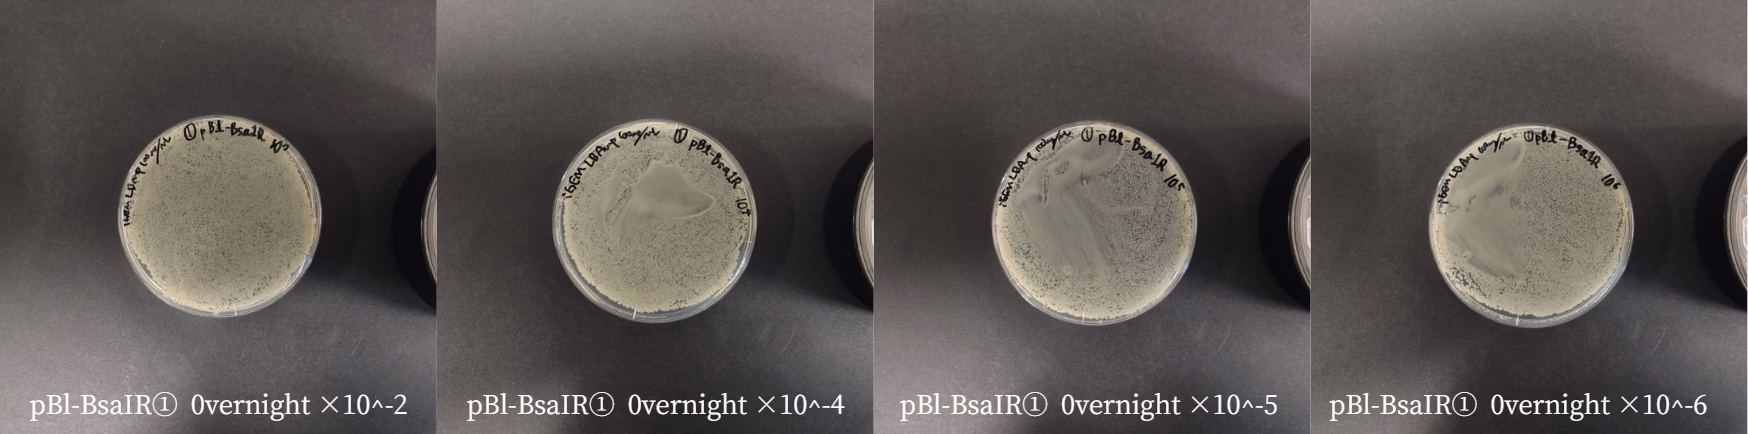
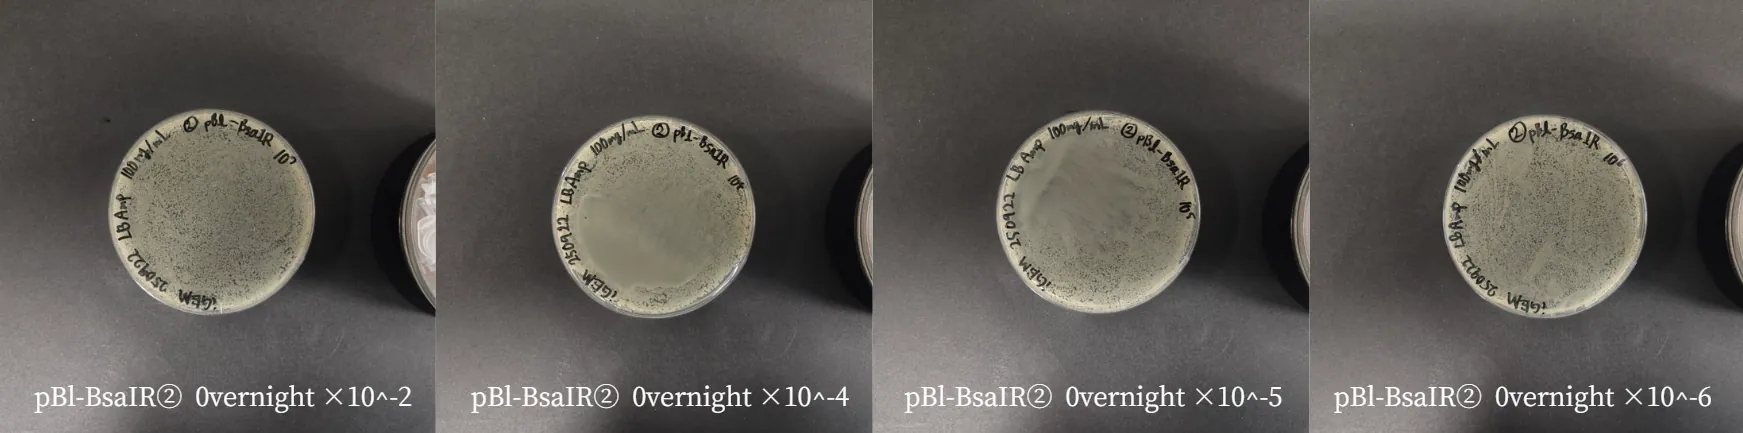
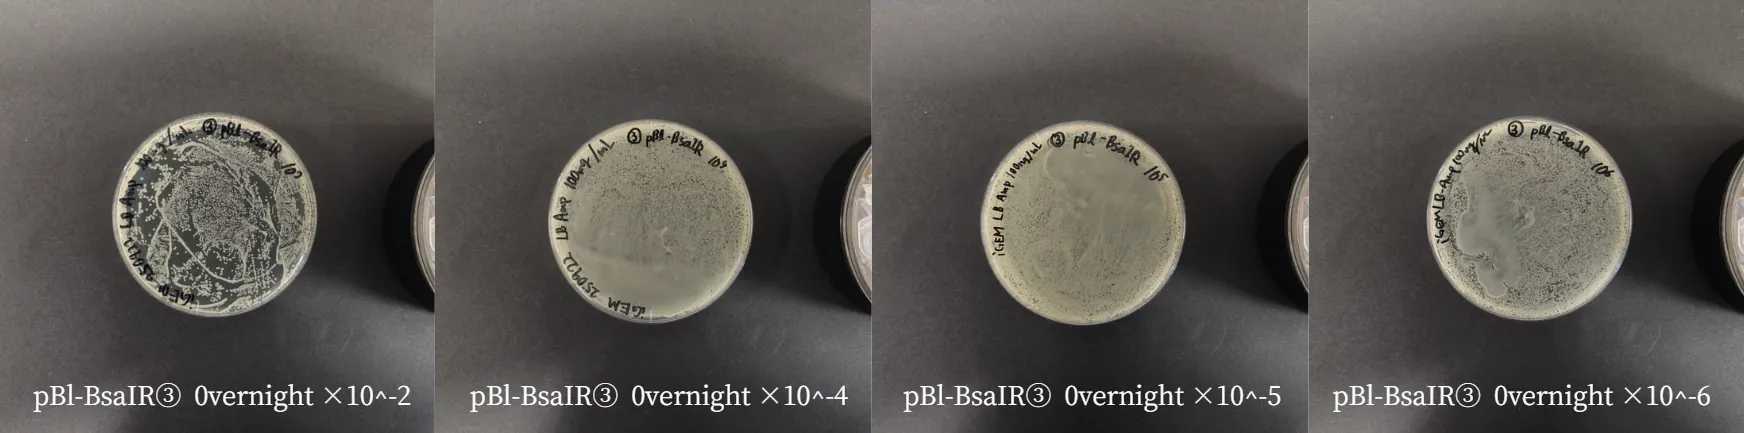
We pre-induced the expression in a strain containing only pBl-BsaIR for 3 hours with IPTG . After culturing this strain in liquid medium, it was diluted, plated, cultured overnight, and the CFU was measured.
As shown in the picture below(Figure54-56), colonies grew across the entire plate, making
CFU measurement impossible
. Furthermore, colonies grew across
all plates
, including the diluted ones, indicating that
cleavage of the plasmid and genome by BsaIR did not occur
. This experiment showed that the enzyme expression was either unsuccessful or the enzyme lacked activity.