MODEL

Model Overview
To estimate the degradation of the three tardigrade disordered proteins (TDPs) — CAHS, SAHS, and MAHS — during the recovery process, we constructed a kinetic model simulating protein degradation after auxin induction. Each protein was initialized to 1 (normalized amount), and the degradation process was driven by an auxin input of 20 μM.
Auxin-Induced Activation
We first used a Hill function to describe the activation of degradation activity θ, normalized between 0 and 1:
Here, p is the auxin concentration (20 μM), p₅₀ = 15 μM is the half-maximum activation constant, and n = 1.5 represents the Hill coefficient controlling curve steepness. From this, we obtain an initial θ ≈ 0.606.
Protein Competition in AID System
Since SAHS acts outside the cell and cannot be degraded by the AID system, only CAHS and MAHS were modeled as substrates competing within the same enzymatic system.
The denominator of the multi-substrate Michaelis–Menten equation was defined as:
where C and M represent the instantaneous normalized concentrations of CAHS and MAHS, and Mc, Mm are their Michaelis constants (10 μM each). The initial conditions (C = M = 1) yield D = 1.2, simulating a low-competition environment.
Multi-Substrate Degradation Kinetics
The degradation speeds of CAHS and MAHS were described using a modified Michaelis–Menten equation for multiple substrates:
The accessibility weights were set as σC = 1 for cytoplasmic CAHS and σM = 0.1 for mitochondrial MAHS. Catalytic constants Kc and Km were set to 0.7 min⁻¹, representing medium degradation efficiency.
Differential Equations and Decay
Naturally, protein degradation follows exponential decay. Incorporating both natural degradation and AID-induced degradation, the rate of change for CAHS and MAHS was given by:
For SAHS, which is not degraded by the AID system:
The natural degradation constants δC, δM, and δS were each set to 1/6 min⁻¹, corresponding to a half-life of approximately 7 hours.
Model Dynamics
The model creates a loop between D, C, M, and fluxes vC and vM. Auxin concentration determines θ through the Hill function, which influences D. The resulting degradation fluxes update protein concentrations over time, closing the dynamic cycle.
This approach couples variables without forming a true feedback system, similar to models used in enzymatic network studies. The simulation output (Fig. 1) visualizes the differing degradation rates of the three proteins.
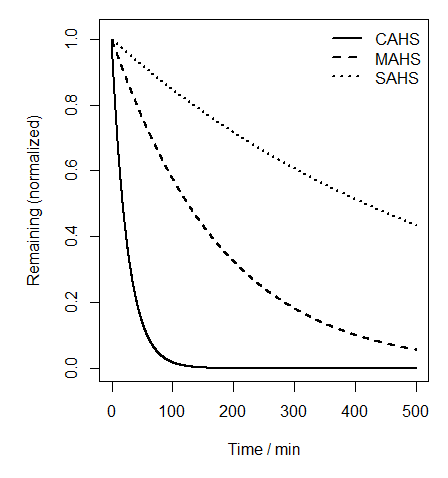
Fig. 1 – Predicted degradation rates of CAHS, MAHS, and SAHS after auxin induction.
Results and Discussion
Results indicate that SAHS, which is inaccessible to the AID system, degrades slowly, whereas CAHS exhibits rapid degradation due to its higher accessibility. MAHS shows intermediate degradation speed because of its mitochondrial localization and reduced access to AID components.
It is important to note that these results are based on estimated parameters drawn from previous empirical data, and future wet-lab experiments are required to validate and refine the model quantitatively.