


Measurements are critical to the development and communication of our project. We collected data to judge the efficacy and quality of our experimental outcome, and used this information to drive further experimentation. Our efforts in this regard focus on two key areas: the systematic optimization of parameters to produce ideal nanoparticle carriers, and the development of a straightforward visual criterion to assess the gene silencing effect of siRNA on plant tissue.
Producing the Ideal siRNA Carrier
Several iterations of chitosan nanoparticle production were carried out over the course of our experimentation to achieve the optimized conditions required for an siRNA carrier system. We aimed to produce nanoparticles that are stable enough to exist and deliver the siRNA while maintaining the release mechanism vital for siRNA uptake.
Low-molecular-weight chitosan from Sigma Aldrich (with a 75-85% degree of deacetylation). (Carvalho et al., 2019) developed a protocol that used 4.0 mg/mL of chitosan solution in 1% acetic acid using 2.4 mg/mL TPP solution as a cross-linker. The same procedure was followed using low-molecular-weight chitosan from Sigma Aldrich (with a 75-85% degree of deacetylation).
The following is a compilation of optimizations made to the protocol to achieve the ideal size, zeta potential, and polydispersity.
Requirements to Perform this Measurement
Horiba Scientific Nanopartica nanoparticle analyzer SZ-100
Input Parameters
Particle: Chitosan
Dispersion medium: Acetic acid
Particle refractive index: 1.320 - 1.670i
Refractive index of the dispersion medium: 1.371
Viscosity of the dispersion medium: 1.2200 mPa.s
Temperature: 20°C
Dielectric constant: 6.200
Henry coefficient: Smoluchowski
Molecular weight measurement: OFF

| Parameter/ Reagent | Effect |
|---|---|
| Chitosan (Low molecular weight, DD: 75–88%) | The material for nanoparticles and nanoformulation. |
| Acetic acid | Determines the protonation of chitosan and controls polycation formation and pH. |
| Sodium Tripolyphosphate (TPP) | A crosslinker that forms the polyanion and helps create the 3D structure for the nanoparticles. It also controls the pH. |
| Sodium hydroxide | Used for pH adjustment. |
| Filtration | Ensures uniformity in the particle size of the chitosan solution and TPP. |
| Flow rate of TPP | Controls the cross-linking and 3D network formation of the nanoparticle. |
| Stir speed | Determines the homogenization of chitosan in acetic acid and aids nanoparticle formation. |
| Sonication | Helps reduce the aggregation of nanoparticles and the polydispersity index (PI). |
| Centrifugation | Centrifugal forces push the macroparticles to the outer surface, making the decanted solution more uniform in size. |
| pH | Determines the stability and hence the zeta potential of the nanoparticle. |
| Hydrodynamic radius | Explains the size of the nanoparticles (120 to 300 nm) required to break P. capsici’s membrane. |
| Zeta potential | Determines the stability of the nanoparticles, which is highly controlled by pH. Should be +40 mV to disrupt P. capsici’s membrane. |
| Polydispersity Index (PI) | Should be <0.5. It indicates the aggregation of the nanoparticles. The efficacy decreases as PI increases. |
Zeta Potential and Size Range
A critical parameter while producing nanoparticle carriers is the zeta potential, which directly correlates to particle stability and complexation with siRNA. The ideal zeta potential for our nanoformulation was estimated to be greater than +20 mV (ideal range is +30 to +50 mV) (Katas et al., 2006).

The zeta potentials observed were 68.7 mV, 21.7 mV, 169 mV, and 184.5 mV in order of date.
We conducted iterative optimizations to determine the ideal concentrations of chitosan and acetic acid to be 0.4% and 1% respectively. Variations in these parameters produced offsets in particle size. Moreover, factors such as reaction time, temperature, homogenization, and pH were considered due to their critical impact on nanoparticle characteristics (Bavel et al., 2022).


The hydrodynamic radius observed was 88.5 nm, 130.1 nm, 95.1 nm, and 267.5 nm in order of the graphs. The ideal size range for the nanoparticles and the nanoformulation to be an effective carrier for our siRNA is discussed on our proof of concept page.
pH
Another crucial parameter to be measured while producing nanoparticles is the pH of the solution, as it governs the protonation of the chitosan amine groups (Bavel et al., 2022). We noticed that the pH of chitosan solutions was all between 2.2 and 2.8, considerably reducing the zeta potential. Adjusting the pH using 1N NaOH to 4.0 showed a significant increase in zeta potential readings (as high as 80.4 mV), while maintaining favourable size and polydispersity.
Producing the Nanoformulation
Encapsulating the siRNA within the nanoparticle requires adding a precise quantity and concentration of siRNA. We used a 1:666 ratio of siRNA to TPP, assuming that 10% of the volume complexed would effectively get encapsulated. 15μL of 100 μM siRNA was added to the TPP solution to achieve a final concentration of 37.5 nM. The size and zeta potential measured for this sample fell within the ideal range for an encapsulated nanoparticle.


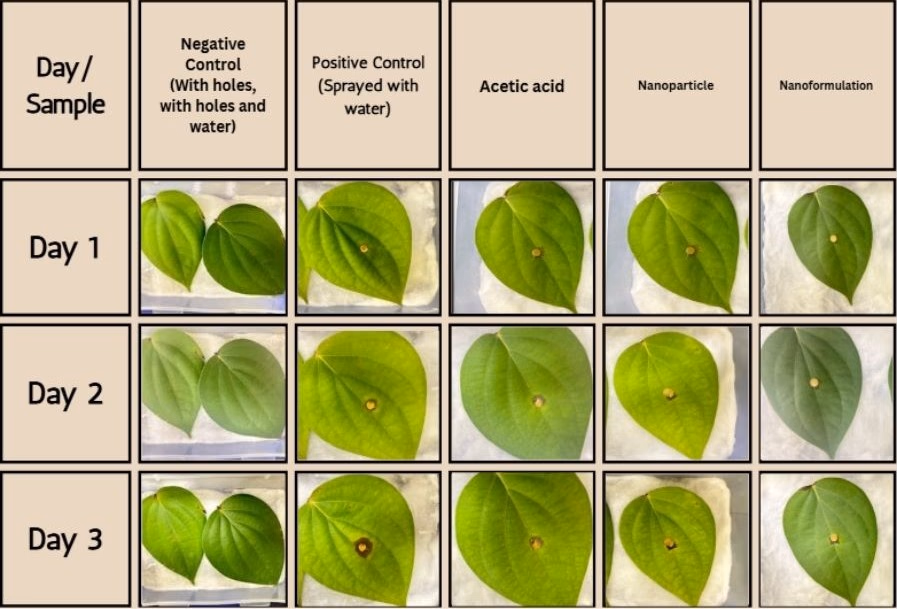
Detached Leaf Assays

The assay tracks phenotypic changes over time, visually verifying gene silencing. The usage of various controls while measuring lesion growth allows us to make valuable measurements. Graphical representation of this data is further discussed in our results page.
The percentage inhibition was calculated for the leaves using the following formula:
Inhibition (%) = Control lesion area – Sample lesion area Control lesion area × 100
(The control lesion area is that of the leaf sprayed with water)
Measuring the Efficacy of Chitosan Nanoparticles

| Sample | Lesion Area Progression | Percentage Inhibition |
|---|---|---|
| Negative control (untreated) | 2.83 cm² | 93.68% (should be 100%, yet contaminated leaf) |
| 1% acetic acid | 35.56 cm² | 20.53% |
|
Nanoparticle 1 (Zeta potential- 169.0 mV, PI- 0.454, size- 95.1 nm) |
6.23 cm² | 86.08% |
Measuring the Efficacy of siRNA Treatments

We observed that prophylactic treatment of the siRNA on the leaves produced a more significant result, which validates the preventative implementation the solution is intended for.
| Sample | Lesion Area Progression | Percentage Inhibition |
|---|---|---|
| Negative control (both with and without holes) | 2.83 cm² | 93.68% (slight contamination observed) |
| Control with 1% acetic acid | 4.76 cm² | 45.51% |
| Prophylactic Treatment (1 μM) |
0 cm² | 100.00% |
| Prophylactic Treatment (100 nM) |
0.99 cm² | 88.67% |
| Therapeutic Treatment (1 μM) |
4.5 cm² | 48.52% |
| Therapeutic Treatment (100 μM) |
2.09 cm² | 76.08% |
We can therefore infer that a 1 μM concentration of free siRNA is 100% effective when applied in a prophylactic manner.
Measuring the Efficacy of the Nanoformulation

| Sample | Lesion Area Progression | Percentage Inhibition |
|---|---|---|
| Negative control (both with and without holes) | 2.83 cm² | 93.68% (slight contamination observed) |
| 1% acetic acid | 35.56 cm² | 20.54% |
|
Nanoparticle 2 (Zeta potential: 184.5 mV, PI: 0.488, Size: 267.5 nm) |
6.38 cm² | 85.74% |
|
Nanoformulation 1 (Zeta potential: -4.0 mV, PI: 2.318, size: 6410.2 nm) |
11.31 cm² | 74.73% |
|
Nanoparticle 3 (Zeta potential: 89 mV, PI: 0.516, size: 130.1 nm) |
3.99 cm² | 91.08% |
|
Nanoformulation 2 (Zeta potential: 35.8 mV, PI: 0.509, Size: 401.7 nm) |
2.695 cm² | 93.977% |
Hence, we can conclude that the nanoformulation is the most effective at curbing infection.
Measuring the Efficacy of the Nanoformulation after 3 weeks
| Sample | Lesion Area Progression | Percentage Inhibition |
|---|---|---|
| Negative control (with holes, with holes and water) | 0 cm² | 100% |
| 1% Acetic Acid | 1 cm² | 58.33% |
|
Nanoparticle 2 (Zeta potential: 184.5 mV, PI: 0.488, Size: 267.5 nm) |
0.81 cm² | 66.25% |
|
Nanoformulation 2 (Zeta potential: 35.8 mV, PI: 0.509, Size: 401.7 nm) |
0.72 cm² | 70% |
A 70% inhibition was observed in the leaves treated with the nanoformulation, 3 weeks after its preparation. The progression of the lesion area was observed to be 0.72 cm².
This particular study demonstrates that although the effectiveness of the nanoformulation subsides over time, its inhibition remains greater than that of the alternative treatments currently being implemented.
References
De Carvalho, F. G., Magalhães, T. C., Teixeira, N. M., Gondim, B. L. C., Carlo, H. L., Dos Santos, R. L., De Oliveira, A. R., & Denadai, Â. M. L. (2019). Synthesis and characterization of TPP/chitosan nanoparticles: Colloidal mechanism of reaction and antifungal effect on C. albicans biofilm formation. Materials Science and Engineering: C, 104, 109885. https://doi.org/10.1016/j.msec.2019.109885
Katas, H., & Alpar, H. O. (2006). Development and characterisation of chitosan nanoparticles for siRNA delivery. Journal of Controlled Release, 115(2), 216-225. https://doi.org/10.1016/j.jconrel.2006.07.021
Pepper Research Station. (2023). Screening black pepper (Piper nigrum L.) genotypes against Phytophthora foot rot disease. The Pharma Innovation Journal (Vol. 12, Issue 4, pp. 602–606). https://www.thepharmajournal.com/archives/2023/vol12issue4/PartG/12-3-199-517.pdf
Van Bavel, N., Issler, T., Pang, L., Anikovskiy, M., & Prenner, E. J. (2022). A Simple Method for Synthesis of Chitosan Nanoparticles with Ionic Gelation and Homogenization. Molecules, 28(11), 4328. https://doi.org/10.3390/molecules28114328