


Our goal this year was to establish a preventative, sustainable, and efficacious biocontrol strategy for pepper foot rot. This process involved the integration of multiple components that are individually effective into a system that is superior to current methods of treatment. Furthermore, every element of this system has been tested extensively against the pathogen, P. capsici, to ensure it performs its respective functions. By demonstrating the effectiveness of this particular system and the siRNA design pipeline and model, we hope to make it easier for future researchers to implement similar systems for the many infections that plague the agricultural economy.
Designing the siRNA
After a thorough review process for identifying effective gene targets in P. capsici and an assessment of the off-target effects, secondary structures, and stability of the siRNA-mRNA duplex, we identified a set of viable candidates, two of which were to be used for the experimentation process (Figure 1). We ensured these sequences adhered to standards such as the Ui-Tei, Reynolds, and Amarzguioui design rules.


DuplexFold: Predicts how well the siRNA guide strand binds to its target mRNA. The figure shows a stable helix with strong base pairing and low free energy value, indicating a stable interaction– an essential factor for effective silencing. This result also tells us that the siRNA duplex itself is structurally stable.
MaxExpect: Predicts the target mRNA’s most likely secondary structure. The paired sections and loops demonstrate the accessibility of bases for siRNA binding. Decreased free energy values indicate a steady and realistic folding pattern.
P. capsici Growth Measurements in Potato Dextrose Agar and Carrot Agar
To ensure that the cultures used for our experiments are grown under ideal conditions, a comparison was drawn between potato dextrose agar (PDA) and carrot agar (Figures 3 and 2). We observed that a steady and quick increase in growth was observed in carrot agar in comparison to PDA (Chemeltorit et al., 2017). It took 4-5 days for the fungal mat to cover the plate with an ideal growth pattern.


Lactophenol Blue Staining
Lactophenol blue staining allowed us to get a closer look at the morphology of Phytophthora capsici. Singular hyphae were observed under 40x magnification (Figure 4).

Chitosan Nanoparticle Production
After designing the siRNA that performs the gene silencing, we aimed to produce and optimize the characteristics of our delivery system - the chitosan nanoparticles, focusing mainly on their size, zeta potential, and polydispersity. Many iterations of this process were carried out, varying parameters such as chitosan and acetic acide concentrations, TPP to chitosan ratios, and homogenization until we obtained the ideal carrier for our siRNA.
By the end of this process, we were able to obtain an ideal combination of parameters for our nanoparticles. The zeta potential was observed to be 89 mV, with the size being 130 nm, along with a polydispersity index of 0.516 (Figures 7 and 8).
More details on the effect of parameters on nanoparticle characteristics are discussed in the measurement page.


The Nanoformulation
The nanoformulation is the culmination of these components into one robust system. It integrates the specificity of the siRNA with the enhanced stability, uptake, and antifungal activity provided by the nanoparticle.
We produced our nanoformulation following the ionic gelation protocol optimized thus far, and analyzed the parameters using a Particle Size Analyzer. We were able to obtain a complex with a zeta potential of 35.8 mV, having a size of 401.7 nm with a 0.509 polydispersity index (Figures 7 and 8). Based on these close to ideal parameters, we were able to gauge that the nanoformulation could effectively be implemented for gene silencing.


Detached Leaf Assay
To understand the first-hand effect of our system and its individual components on P. capsici, we conducted a series of assays involving P. nigrum leaves (of Panniyur-1 variety). Mature leaves that were sprayed with the nanoparticle, naked siRNA, and nanoformulation were inoculated with a mycelial plug of P. capsici. We established a series of controls, such as untreated leaves and leaves sprayed with water and acetic acid, to gauge the difference in lesions.
We first observed that the lesion growth was significantly reduced in the case of the chitosan nanoparticle (Figure 9). The same was true for the nanoformulation we produced. Moreover, on applying 10 μL of naked siRNA (of 100 nM and 1 μM concentration) and placing a mycelial plug on the leaf 3 days later, we found that there was no lesion at all in the case of 1 μM siRNA compared to the controls, indicating a complete stoppage of infection (Figure 10).
This prophylactic treatment is akin to how our solution will be implemented in pepper fields. The result visually shows the measurable decrease in infection, and also proves that each component is successfully performing its function in curbing the infection.
| Name | Date prepared | Polydispersivity Index | Hydrodynamic Radius | Zeta Potential |
|---|---|---|---|---|
| Nanoparticle 1 | 4th September | 0.454 | 95.1 nm | 169.0 mV |
| Nanoparticle 2 | 6th September | 0.488 | 267.5 nm | 184.5 mV |
| Nanoparticle 3 | 10th September | 0.516 | 130.1 nm | 89.0 mV |
| Nanoformulation 1 | 27th September | 2.318 | 6410.3 nm | -4.0 mV |
| Nanoformulation 2 | 29th September | 0.509 | 401.7 nm | 35.8 mV |


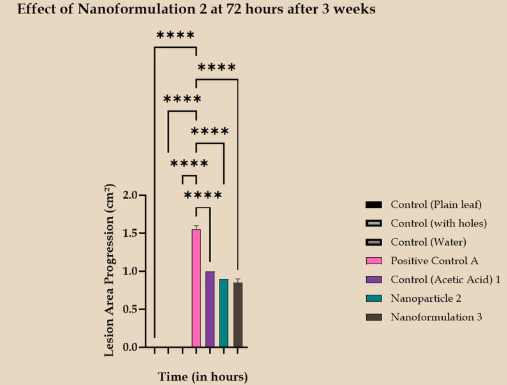
Detached Leaf Assay (Post Wiki Freeze)
Mature leaves were sprayed with nanoparticles and nanoformulation. A mycelial plug of P. capsici was placed over them. A set of controls included untreated leaves, leaves with only pricks, and leaves sprayed with a mixture of acetic acid and water. Lesion growth in these leaves was then measured.
Over a three-day period, it was observed that the lesion growth was minimal when 10 μL of the nanoformulation was applied. Although the application of just the chitosan nanoparticles also reduced lesion growth, the results were comparable to those obtained with acetic acid. These results are consistent with previous DLA findings. It indicates that the nanoformulation, produced with 15 μL of 100 μM siRNA, has remained stable over a three-week period and continues to be the most effective at reducing lesion growth.
Evaluating the Cytotoxicity of siRNA
To establish the safe concentration range of the siRNA, and ensure that the reduction in infection is due to the intended mechanism (and not due to toxicity from the siRNA itself), a cytotoxicity assay was carried out wherein 10 μL of bZIP1 target gene’s siRNA (at concentrations 1.5 nM, 50 nM, 100 nM, 1 μM and 100 μM) was applied on P. nigrum leaves to observe any unintended effects. No such effect was observed over a duration of 3 days.
SEM Analysis
SEM analysis provided us with key insights into the morphology and size of our nanoparticles and nanoformulations. At magnifications higher than 100000x, the chitosan nanoparticles and nanoformulation appeared as spherical beads in clusters (Figures 17, 20, and 24). Variations in size and shape were observed between the samples, due to the time period between their production and characterization.


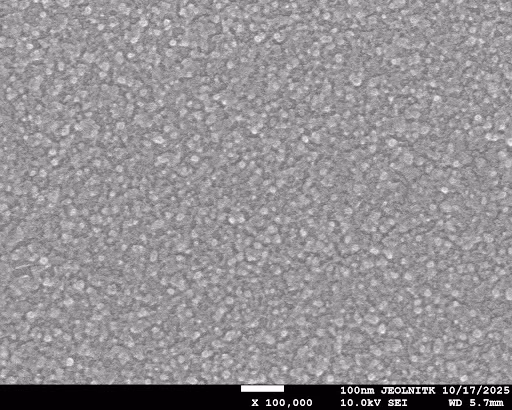
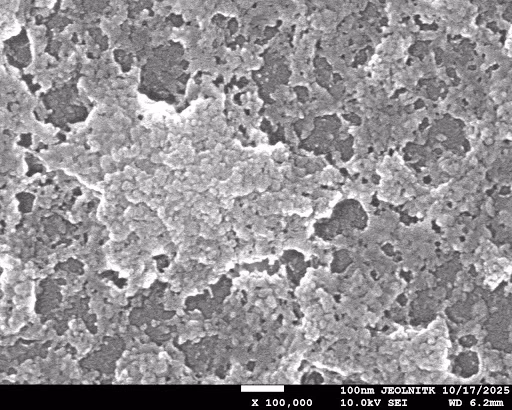
SEM analysis (Post Wiki Freeze)
The SEM analysis shows that siRNA encapsulation alters the morphology of the chitosan nanoparticles. All the nanoparticle and nanoformulation samples appeared as spherical beads in clusters. The nanoparticles appear uniform and well-dispersed, whereas the nanoformulation samples exhibit surface irregularity, aggregation, and the formation of cavity-like structures, which indicate successful encapsulation. The 10 µL sample exhibits a denser and more compact distribution with more clustering, whereas the 5 µL sample has less aggregation with clear particle boundaries. Overall, the changes in the surface texture validate the loading of siRNA into the chitosan nanoparticles.


Entrapment Efficiency
The calculation of entrapment efficiency gives the percentage of siRNA successfully encapsulated within the nanoparticles. A high encapsulation efficiency is imperative to the effective release of siRNA within P.capsici, and to also confer stability to the complex in the soil environment.
The encapsulation efficiency was calculated using the formula:
Entrapment Efficiency (%) = × 100
Csample (20.778 μg/mL) was the concentration of siRNA added, and Csupernatant (2.2 μg/mL) was the siRNA concentration in the supernatant.
The entrapment efficiency was found to be 89.41%, indicating a high percentage of siRNA encapsulation.
Gel Retardation Assay
A gel retardation assay was performed to visualize the encapsulation of the siRNA within the nanoparticle (Katas et al., 2006).
We ran our samples on a 4% agarose gel for 2 hours. Positive (RNase-treated nanoformulation, nanoparticle) and negative (free siRNA) controls were established. The ladder used was a 1kb DNA ladder from GeneDireX.
Upon visualization of the gel under a UV transilluminator it was observed that the 100 nM siRNA was observed as a faint band due to its low concentration. No bands were observed for the nanoformulation, nanoformulation treated with RNase and the chitosan nanoparticle. Successful encapsulation was indicated by the entrapment of the siRNA in the well.

P. capsici Sporulation
Effective silencing of the bZIP gene within P. capsici zoospores causes a reduction in zoospore motility (Blanco & Judelson, 2005).
To visualize this confirmatory effect, zoospores were isolated from P. capsici cultures and treated with the following:
- 1% acetic acid
- Chitosan nanoparticle solution
- 7.23 µM siRNA (total siRNA in the sample was 40 ng/ml) (Cheng et al., 2022)
- 100 µM siRNA
- Nanoformulation (prepared on 29th September)
The samples were incubated for 30 minutes and visualized at 100x magnification using an Olympus CX-43 upright trinocular phase contrast microscope.
Motile zoospores were observed in the untreated, 1% acetic acid, and nanoparticle-treated samples. Zoospore samples treated with 7.23 µM siRNA, 100 µM siRNA, and the nanoformulation showed total reduction in zoospore motility.
The observed effect over zoopore motility confirmed gene silencing by the siRNA and nanoformulation.
Fluorescence Microscopy
To further visualize the uptake of siRNA within P. capsici zoospores, the siRNA was tagged with 6-FAM, a fluorescent dye. The absorption and emission wavelengths are 495 nm and 517 nm, respectively.
Zoospore samples were incubated with naked siRNA and the nanoformulation for 90 minutes, following which they were visualized using an Olympus IX 73 Fluorescent Microscope at 40x, 60x, and 100x.
Fluorescent structures were clearly visible at 100x magnification, which were comparable to the zoospores observed through phase contrast microscopy. This indicated successful internalization of the siRNA within the zoospores, as well their intended release from the nanoparticle complex.


Right - Internalization of the 6-FAM tagged siRNA within P. capsici zoospores, visualized using fluorescence microscopy
The Software Model
Our software model works as a screening tool that evaluates the binding between an siRNA sequence and the chosen nanoparticle.
The XGBoost outperformed Lasso and Random Forest by RMSE of 33.30 and an R² value of 0.7459, explaining approximately 75% of the variance in the docking scores. The model extracted 217 features based on the nucleotide sequence, such as position, GC Content and etc, allowed to be attributed when a new sequence is inputted. The model resulted in generating docking scores for the new sequences that had a maximum error of ± 40.
| Seq. No. | Sequence (Both 5' → 3') | Docking Score for Chitosan | Docking Score for Lipid | Error Calc for Chitosan | Error Calc for Lipid |
|---|---|---|---|---|---|
| 1. | GGUACUACAACUAGUGUGACU UCACACUAGUUGUAGUACCAG |
-215.51 | -114.75 | +36 | -20 |
| 2. | CAGAGCUGAAGGAUAUGAAGA UUCAUAUCCUUCAGCUCUGUG |
-246.64 | -137.74 | +11 | -4 |
| 3. | GGAGACAGCGACAAGUUGUCG ACAACUUGUCGCUGUCUCCAA |
-215.24 | -106.34 | +39 | -31 |
| 4. | CCCGAGUGCGGUUUCACUAGG UAGUGAAACCGCACUCGGGUG |
-292.31 | -158.95 | -38 | +21 |
| 5. | GGGAGAGACUGGUGAUGAAGG UUCAUCACCAGUCUCUCCCCC |
-281.82 | -151.31 | -27 | +14 |

References
Blanco, F. A., & Judelson, H. S. (2005). A bZIP transcription factor from Phytophthora interacts with a protein kinase and is required for zoospore motility and plant infection. Molecular Microbiology, 56(3), 638–648. https://doi.org/10.1111/j.1365-2958.2005.04575.x
Chemeltorit, P.P., Mutaqin, K.H. & Widodo, W. Combining Trichoderma hamatum THSW13 and Pseudomonas aeruginosa BJ10–86: a synergistic chili pepper seed treatment for Phytophthora capsici infested soil. Eur J Plant Pathol 147, 157–166 (2017). https://doi.org/10.1007/s10658-016-0988-5
Cheng, W., Lin, M., Chu, M., Xiang, G., Guo, J., Jiang, Y., Guan, D., & He, S. (2022). RNAi-Based Gene Silencing of RXLR Effectors Protects Plants Against the Oomycete Pathogen Phytophthora capsici. Molecular Plant-Microbe Interactions, 35(6), 440–449. https://doi.org/10.1094/mpmi-12-21-0295-r
Katas, H., & Alpar, H. O. (2006). Development and characterisation of chitosan nanoparticles for siRNA delivery. Journal of Controlled Release, 115(2), 216–225. https://doi.org/10.1016/j.jconrel.2006.07.021