Basket Bird BirdWithPepper

LOADING...

Notebook

Week 1 - 25th July to 1st August

P. capsici Subculturing 1

+

P. capsici Subculturing 1

25th July

Preparation of Media Plates for Subculturing

To subculture the Phytophthora capsici received from the Indian Institute of Spices Research, potato dextrose agar (PDA) and carrot agar were prepared in autoclaved glassware.

Preparation of Carrot Agar:

  1. 20 g of carrot was blended and ground using a mortar and pestle.
  2. 60 mL of distilled water was added to the carrot puree in a beaker.
  3. The mixture was then boiled in a microwave.
  4. The froth that developed on top was discarded to get a clear solution.
  5. The mixture was then filtered through a muslin cloth, resulting in a clear, slightly orange solution.
  6. The filtrate’s volume was then made up to 100 mL in a measuring flask using distilled water.
  7. The carrot solution was combined with 1.8 g of agar in a conical flask.

Preparation of PDA:

2.4 g potato dextrose broth powder was combined with 100 mL distilled water and 1.8 g agar in a conical flask.

The prepared nutrient media were autoclaved along with the cork borer.

Fig 1. Carrot agar media and PDA before autoclaving

26th July

Culturing P. capsici using Carrot Agar and PDA

  1. The laminar air flow (LAF) chamber was cleaned, and the apparatus required for P. capsici culturing (disposable inoculation loops, agar plates, cork borer, etc.) was placed under the UV.
  2. Four plates of carrot agar and PDA were made, of which three plates of each medium were designated for culturing. The cork borer technique was practiced on the additional PDA plate that was prepared.
  3. Disks were cut from the parent culture using the cork borer, ensuring that they were not positioned too close to each other due to the disrupted hyphal network near the cut regions. The cut disks were then lifted using disposable inoculation loops.
  4. Each disk was inverted before being placed on the agar plate to ensure that the mycelium was in contact with the agar. Some disks were difficult to remove due to the dense mycelial network.
  5. One plate of each medium was also used to check the colony diameter from the centrally placed disk.
  6. Two plates each of PDA and carrot agar were utilized for subcultures. Two disks were positioned at the periphery of the plates, ensuring ample separation from the edge. The procedure was conducted under the observation and guidance of the PI.
  7. The plates were then initially placed in a cupboard, following which they were positioned in a dark incubator at 28°C incubated upright (lid on top) to prevent the disks from losing contact with the agar.
Fig 2. Phytophthora capsici plate received from IISR
Fig 3. Close-up picture of the mycelial plug

P. capsici Growth Curve 26th July - 1st August

+

Colony Diameter Measurement (Growth Curve)

27th July (Day 1)

A divider and ruler was used to measure the diameter of the growing colony.

Plug diameter: 8mm

Growth Curve PDA Day 1 (24 hours)

Y axis: 2.3 cm
X axis: 2.55cm

Final reading: 1.625 cm

Growth Curve Carrot Agar Day 1 (24 hours)

Y axis: 3.6 cm
X axis: 3.6 cm

Final reading: 2.8 cm

The decontaminated cork borer was soaked in soap solution and cleaned with distilled water. It was then autoclaved for future use.

Conclusion:

The growth of the culture was observed to be more rapid on carrot agar compared to PDA.

28th July (Day 2)

Plug diameter: 8mm

Growth Curve PDA Day 2 (48 hours)

Y axis: 4.3 cm
X axis: 4.1 cm

Final reading: 3.4 cm

Growth Curve Carrot Agar Day 2 (48 hours)

Y axis: 6.2 cm
X axis: 6.3 cm

Final reading: 5.45 cm

29th July (Day 3)

Plug diameter: 8mm

Growth Curve PDA Day 3 (72 hours)

Y axis: 5.95cm
X axis: 6.1 cm

Final reading: 5.225 cm

Growth Curve Carrot Agar Day 3 (72 hours)

Y axis: 8.2 cm
X axis: 8.2 cm

Final reading: 7.4 cm

30th July (Day 4)

Plug diameter: 8 mm

Growth Curve PDA Day 4 (96 hours)

Y axis: 7.8 cm
X axis: 7.7 cm

Final reading: 6.97 cm

Growth Curve Carrot Agar Day 4 (96 hours)

Y axis: 8.2 cm
X axis: 8.2 cm

Final reading: 7.4 cm

31st July (Day 5)

Plug diameter: 8 mm

Growth Curve PDA Day 5 (120 hours)

Y axis: 7.8 cm
X axis: 7.7 cm

Final reading: 6.95 cm

Growth Curve Carrot Agar Day 5 (120 hours)

Y axis: 8.2 cm
X axis: 8.2 cm

Final reading: 7.4 cm

1st August (Day 6)

Growth Curve PDA Day 6 (144 hours)

Y axis: 7.8 cm
X axis: 7.7 cm

Final reading: 6.95 cm

Growth Curve Carrot Agar Day 6 (144 hours)

Y axis: 8.2 cm
X axis: 8.2 cm

Final reading: 7.5 cm

Lactophenol Blue Staining

+

Lactophenol Blue Staining

26th July

Lactophenol blue staining:

  1. A microscope slide was labelled, and a drop of Lactophenol Blue stain was placed at its center.
  2. A small sample of the culture was carefully collected using a disposable inoculation loop, ensuring that the sporangium was not damaged. It was then spread onto the stain.
  3. A cover slip was gently placed over the stained sample to prevent the formation of air bubbles.
  4. The slide was then observed under a microscope at 10x and 40x magnifications.
  5. Hyphae were observed under 40x magnification.
Fig 4. P. capsici hyphae observed under 40x

29th July

Fig 5. P. capsici observed under 40x

P. capsici Water Storage

+

Water Storage for P. capsici

29th July

P. capsici water storage:

  1. ⁠1 mL of autoclaved sterile water was added to a 2 mL Eppendorf tube.
  2. 4 fungal plugs were added to each tube.
  3. The tubes were then parafilmed and stored at 15-28°C.

Testing Chitosan Solubility

+

Chitosan nanoparticle production

30th July

Chitosan nanoparticle production preparation

  1. The low molecular weight chitosan (Sigma Aldrich 448869-50G) was tested for its solubility.
  2. 2 samples of 4 mg chitosan in 1 mL of distilled water and 1% acetic acid solution were prepared. They were subjected to vortexing for 3 minutes.
  3. The chitosan in the 1% acetic acid solution completely dissolved, whereas the water sample still had suspended chitosan particles.
  4. To produce nanoparticles, a 2.4 mg/mL of Sodium Tripolyphosphate (TPP) solution was prepared and allowed to drop from a burette, to achieve the ideal flow rate of 60 mL/hr. The duration between two consecutive drops to achieve this was determined to be 6-7 seconds.
  5. The volume of chitosan nanoparticles to be prepared was adjusted by determining the magnetic bead size and the container in which the nanoparticles would be prepared (30-40 mL in 100 mL beakers).
Fig 6: Chitosan in 1% acetic acid
Fig 7: Chitosan in sterile water (did not dissolve)

Conclusion:

The chitosan solution had better dissolution in 1% acetic acid than in distilled water. To achieve the desired flow rate, the duration between two drops must be between 6-7 seconds.

Chitosan Nanoparticle 1

+

Chitosan Nanoparticle Production

31st July

  1. To prepare 4 mg/mL of chitosan solution, 120 mg of chitosan was added to 30 mL of 1% acetic acid solution.
  2. The chitosan solution was subjected to stirring using a magnetic stirrer at its maximum stable speed. On observing the lack of dissolution after a few hours, it was subjected to overnight stirring.
  3. 30 mL of 2.4 mg/mL of TPP solution was prepared. The solution was passed through a 0.22 micron PVDF filter and kept ready for usage.

1st August

  1. 30 mL of 0.4% chitosan solution was made the previous day; however, the volume had reduced to 20 mL upon overnight stirring, due to which the solution was brought up to 30 mL by the addition of 1% acetic acid solution.
  2. The solution was then subjected to magnetic stirring. Syringe filtration was attempted; however, the process could not be performed due to the following reasons:
    • Solution being highly viscous
    • A 0.22 micron pore size filter was used, which increased the risk of clogging.
    After 1 hour of syringe filtration, less than 5 mL of the filtrate was obtained.
  3. The solution was subjected to filtration using a syringe pump. This did not work since:
    • The solution was too viscous
    • The volume of the solution to be filtered was very low
  4. On the recommendation of the PI, 1 mL of acetic acid was added to the solution and magnetic stirring was carried out.
  5. The solution was filtered using regular filter paper, but the process was unsuccessful as the solution was absorbed into the filter paper.
  6. As Whatman filter paper was not available, the chitosan-acetic acid solution was stored in a 50 mL Falcon tube.
  7. 30 mL of 0.1% chitosan-acetic acid solution was prepared and left for stirring overnight.

Conclusion:

Chitosan solution is highly viscous and cannot be filtered effectively using syringe filtration.

Week 2 - 2nd August to 8th August

Chitosan Nanoparticle 2

+

Chitosan Nanoparticle Production

2nd August

  1. 0.4% and 0.1% chitosan solutions were prepared in 1% acetic acid and stirred overnight.
  2. The volume of both solutions was brought up to 30 mL by adding 1% acetic acid. The adjustment was necessary because the volume had decreased from 30 mL to less than 20 mL due to evaporation during stirring, as the solutions were not covered.
  3. The 0.1% chitosan solution was filtered using filter paper. Owing to the viscosity of the 0.4% solution, an additional 1mL of acetic acid was added to it to reduce the viscosity.
  4. The TPP solution was freshly prepared and filter sterilized using a 0.22 μm PVDF filter.
  5. Using a burette, 6mL of TPP solution was added dropwise to 20 mL each of the 0.1% and 0.4% chitosan solutions under constant stirring at maximum stable speed. This ensured a 1:3 ratio of TPP to chitosan.
  6. It was observed that the flow rate in the burette reduced as time passed. An attempt was made to ensure that the duration between two drops was 6–10 seconds.
  7. Both solutions were allowed to stir for an additional 10 minutes post the addition of TPP. It was observed that the chitosan solution went from clear to opalescent, indicating the presence of nanoparticles.
  8. 2 mL of each solution was analyzed at the Manipal Institute of Applied Physics, using a Particle Size Analyzer (Horiba Scientific Nano Partica SZ-100).

Results:

0.1% Chitosan Solution in 1% Acetic Acid (1:3 TPP to Chitosan ratio):

Hydrodynamic Radius (Z avg): 141.7 nm
PI: 0.428
Zeta Potential (mean): 9.9 mV

0.4% Chitosan Solution in 1% Acetic Acid (1:3 TPP to Chitosan ratio):

Hydrodynamic Radius (Z avg): Couldn’t be determined
PI: Couldn’t be determined
Zeta Potential (mean): 26 mV

Conclusions:

The hydrodynamic radius of the 0.1% nanoparticle solution was ideal, but the zeta potential was significantly low. The 0.4% solution’s particle size was much higher than expected, due to the formation of aggregates and insufficient filtration. Its Zeta potential was also much lower than expected.

The Zeta potential could be increased by altering the amount of acetic acid used, whereas the stirring duration would optimise the nanoparticle size, along with proper filtration of the chitosan solution.

Fig 8. Chitosan solutions before and after the addition of TPP (left to right)(1) Fig 8. Chitosan solutions before and after the addition of TPP (left to right)(2)
Fig 8. Chitosan solutions before and after the addition of TPP (left to right)
Fig 18. Experimental setup for ionic gelation
Fig 9. Experimental setup for ionic gelation

P. capsici Growth Curve 2nd August - 8th August

+

Colony Diameter Measurement (Growth Curve)

2nd August (Day 7)

Growth Curve PDA Day 7 (168 hours)

Y axis: 8.3 cm
X axis: 8.3 cm

Final reading: 7.5 cm

Growth Curve Carrot Agar Day 7 (168 hours)

Y axis: 8.2 cm
X axis: 8.2 cm

Final reading: 7.4 cm

3rd August (Day 8)

Growth Curve PDA Day 8 (192 hours)

Y axis: 8.3 cm
X axis: 8.3 cm

Final reading: 7.5 cm

Growth Curve Carrot Agar Day 8 (192 hours)

Y axis: 8.2 cm
X axis: 8.2 cm

Final reading: 7.4 cm

4th August (Day 9)

Growth Curve PDA Day 9 (216 hours)

Y axis: 8.3 cm
X axis: 8.3 cm

Final reading: 7.5 cm

Growth Curve Carrot Agar Day 9 (216 hours)

Y axis: 8.2 cm
X axis: 8.2 cm

Final reading: 7.4 cm

5th August (Day 10)

Growth Curve PDA Day 10 (240 hours)

Y axis: 8.3 cm
X axis: 8.3 cm

Final reading: 8.2 cm

Growth Curve Carrot Agar Day 10 (240 hours)

Y axis: 8.2 cm
X axis: 8.2 cm

Final reading: 7.4 cm

Conclusions:

Over the course of the ten days, it was observed that the P. capsici showed faster growth on the carrot agar plate as compared to the potato dextrose agar plate. The carrot agar plate showed uniform growth and was identical to the original P. capsici plate we had received from IISR, Kozhikode.

Chitosan Nanoparticle 3

+

Chitosan Nanoparticle Production

3rd August

  1. 30 mL of 0.4% chitosan solution was prepared in 1% acetic acid solution. The solution was subjected to overnight stirring.

4th August

  1. The 0.4% chitosan solution kept for stirring overnight was opalescent, with fine suspended particles observed. This was due to improper cleaning of the beakers, which might have contained residual TPP solution.
  2. A fresh 0.4% chitosan solution was prepared and kept for overnight stirring.
  3. As seen in Fig. 23, the chitosan solution became foamy and opaque after stirring overnight.
Fig 10. Chitosan solution after magnetic stirring overnight.

Chitosan Nanoparticle 4

+

Chitosan Nanoparticle Production

5th August

  1. The overnight 0.4% chitosan solution was observed to be foamy the next morning, and therefore passed through filter paper.
  2. TPP solution was freshly prepared and passed through a 0.22 μm PVDF filter.
  3. 6 mL of TPP solution was added to 20 mL of the 0.4% chitosan solution using a burette. On average, the time between drops was adjusted to 7–10 seconds.
  4. The solution was allowed to stir throughout the process, and for an additional 25 minutes post the addition of TPP.
  5. The samples were tested using the Particle Size Analyzer.

Results:

0.4% Chitosan Solution in 1% Acetic Acid (1:3 TPP to Chitosan ratio):

Hydrodynamic Radius (Z avg): Couldn’t be determined
PI: Couldn’t be determined
Zeta Potential (mean): 1 mV

Subsequently, two chitosan solutions (0.1% chitosan in 1% acetic acid and 0.2% chitosan in 1% acetic acid) were prepared to further optimize the concentrations for nanoparticle production.

Conclusions:

The 0.4% chitosan solution was ruled out for nanoparticle production, as aggregation was inferred from the Particle Size Analyzer results.

Chitosan Nanoparticle 5

+

Chitosan Nanoparticle Production

7th August

  1. The overnight 0.1% chitosan solutions were filtered.
  2. A 2.4 mg/mL TPP solution was prepared and filtered using a 0.22 μm PVDF filter.
  3. A glass column with precise flow control was used to maintain a constant flow rate of 7.2 seconds between TPP drops. The 1:2 and 1:3 TPP to chitosan solutions were prepared by adding 7.5 mL and 5 mL of TPP to 15 mL of chitosan solutions, respectively.
      Fig 11. Glass column setup to achieve the ideal TPP flow rate
    Fig 11. Glass column setup to achieve the ideal TPP flow rate
  4. Both solutions were subjected to magnetic stirring throughout the process. They were allowed to stir for an additional 20 minutes post-TPP addition.
  5. The samples were tested using the Particle Size Analyzer.

Results:

0.1% Chitosan Solution in 1% Acetic Acid (1:2 TPP to Chitosan ratio):

Hydrodynamic Radius (Z avg): Couldn’t be determined
PI: Couldn’t be determined
Zeta Potential (mean): 16.3 mV

0.1% Chitosan Solution in 1% Acetic Acid (1:3 TPP to Chitosan ratio):

Hydrodynamic Radius (Z avg): 1808.0 nm
PI: 2.515
Zeta Potential (mean): 9.8 mV

 Fig 12. The chitosan nanoparticle solutions that were subjected to analysis
Fig 25. The chitosan nanoparticle solutions that were subjected to analysis

Subsequently, two 30 mL 0.1% chitosan solutions of 1.22% and 0.8% acetic acid were prepared. The solutions were stirred overnight.

Conclusions:

The non-ideal values for polydispersity, hydrodynamic radius, and zeta potential could be due to insufficient mixing during nanoparticle formation. A fine suspension observed in the solutions indicates the same. The solutions must be subjected to sonication after the addition of TPP.

Chitosan Nanoparticle 6

+

Chitosan Nanoparticle Production

8th August

  1. The overnight chitosan solutions were passed through filter paper.
    Fig 13. Foamy chitosan solution before filtering
    Fig 13. Foamy chitosan solution before filtering
  2. A 2.4 mg/mL TPP solution was prepared and filtered through a 0.22 μm PVDF filter.
  3. The addition of TPP was done using the glass column, with a constant flow rate of 8 seconds between drops. 6mL of TPP was added to each of the 20 mL chitosan solutions to make 1:3 nanoparticle solutions.
  4. The solutions were stirred throughout the process. They were allowed to spin for 20 minutes post-TPP addition.
  5. The samples were tested using the Particle Size Analyzer.

Results:

0.1% Chitosan Solution in 0.8% Acetic Acid (1:3 TPP to Chitosan ratio):

Hydrodynamic Radius (Z avg): Couldn’t be determined
PI: Couldn’t be determined
Zeta Potential (mean): 14.4 mV

0.1% Chitosan Solution in 1.22 % Acetic Acid (1:3 TPP to Chitosan ratio):

Hydrodynamic Radius (Z avg): Couldn’t be determined
PI: Couldn’t be determined
Zeta Potential (mean): 16.5 mV

Subsequently, two chitosan solutions (0.1% chitosan in 1% acetic acid) were prepared. The volume was increased to 40 mL to account for losses during overnight stirring.

Conclusions:

A fine suspension was observed yet again in the solutions, indicating insufficient mixing during ionic gelation. This confirms that sonication of the sample for a period of 10 minutes (10 seconds ON/OFF) at 50% amplitude is necessary.

P. capsici Subculturing 2

+

P. capsici Subculturing 2

8th August

  1. The LAF and apparatus (inoculation loops, carrot agar plates, cork borer, etc) were cleaned and sterilized through UV treatment.
  2. Mycelial discs from the primary culture were made and inverted onto 3 fresh carrot agar plates, using the cork borer and inoculation loops. These plates were used to study the growth of the culture.
  3. One plate was set with 2 mycelial discs to serve as the subculture.
  4. The plates were then placed in the dark incubator at 28°C.

Week 3 - 9th to 15th August

Chitosan Nanoparticle 7

+

Chitosan Nanoparticle Production

9th August

  1. Chitosan nanoparticles were prepared using 0.1% and 0.2% chitosan solutions, keeping the acetic acid concentration constant, and a chitosan to TPP ratio of 1:3.
  2. The overnight stirred chitosan solutions of 0.1% and 0.2% were used. The 0.1% solution was less foamy relatively.
  3. 2.4 mg/ml of TPP solution was prepared. The solution was filtered using a 0.22 μm PVDF filter. A total volume of 40 mL of chitosan in acetic acid was put for magnetic stirring, and 30 mL was measured to make the nanoparticles and account for any losses during filtration.
  4. Using the glass cylinder with a valve, a constant flow rate of 8 seconds was maintained between consecutive drops. Both solutions were stirred on separate magnetic stirrers, and after adding TPP, they were allowed to spin for an additional 20 minutes.
  5. The samples were then sonicated for 10 minutes with 50% amplitude, a 10 seconds ON/OFF pulse cycle.

Results:

0.1% Chitosan Solution in 1% Acetic Acid (1:3 TPP to Chitosan ratio):

Hydrodynamic Radius (Z avg): 146.5 nm
PI: 0.287
Zeta Potential (mean): 13.5 mV

0.2% Chitosan Solution in 1% Acetic Acid (1:3 TPP to Chitosan ratio):

Hydrodynamic Radius (Z avg): Couldn’t be determined
PI: Couldn’t be determined
Zeta Potential (mean): 21.1 mV

0.1% Chitosan solution in 0.8% Acetic Acid (1:3 TPP to Chitosan ratio):

Hydrodynamic Radius (Z avg): 148.1 nm
PI: 0.471
Zeta Potential (mean): 15.1 mV

0.1% Chitosan solution in 1.22% Acetic Acid (1:3 TPP to Chitosan ratio):

Hydrodynamic Radius (Z avg): 113.3 nm
PI: 0.376
Zeta Potential (mean): 19.7 mV

Conclusions:

A fine suspension of particles was observed in both solutions, indicating insufficient mixing.

The chitosan solutions must be subjected to sonication for 10 minutes, with 10 seconds ON/OFF off pulse at 60% amplitude.

The nanoparticle samples made on 8th August were also subjected to sonication with the same parameters before characterization.

Nanoformulation Production

+

Nanoformulation Production

Lorem ipsum dolor sit amet consectetur adipisicing elit. Mollitia nemo aliquid itaque ut, sed exercitationem magnam fuga explicabo esse corporis eum porro molestias, culpa aliquam debitis! Veritatis enim atque Lorem ipsum dolor sit, amet consectetur adipisicing elit. Architecto pariatur placeat tempore ipsa suscipit similique corrupti laboriosam voluptas maiores. Adipisci ipsum iusto earum natus quis libero quas aut voluptates sit.

Lorem ipsum dolor sit amet consectetur adipisicing elit. Mollitia nemo aliquid itaque ut, sed exercitationem magnam fuga explicabo esse corporis eum porro molestias, culpa aliquam debitis! Veritatis enim atque Lorem ipsum dolor sit, amet consectetur adipisicing elit.

Nanoformulation Production

+

Nanoformulation Production

Lorem ipsum dolor sit amet consectetur adipisicing elit. Mollitia nemo aliquid itaque ut, sed exercitationem magnam fuga explicabo esse corporis eum porro molestias, culpa aliquam debitis! Veritatis enim atque Lorem ipsum dolor sit, amet consectetur adipisicing elit. Architecto pariatur placeat tempore ipsa suscipit similique corrupti laboriosam voluptas maiores. Adipisci ipsum iusto earum natus quis libero quas aut voluptates sit.

Lorem ipsum dolor sit amet consectetur adipisicing elit. Mollitia nemo aliquid itaque ut, sed exercitationem magnam fuga explicabo esse corporis eum porro molestias, culpa aliquam debitis! Veritatis enim atque Lorem ipsum dolor sit, amet consectetur adipisicing elit.

Gel Retardation Assay

+

Gel Retardation Assay

Lorem ipsum dolor sit amet consectetur adipisicing elit. Mollitia nemo aliquid itaque ut, sed exercitationem magnam fuga explicabo esse corporis eum porro molestias, culpa aliquam debitis! Veritatis enim atque Lorem ipsum dolor sit, amet consectetur adipisicing elit. Architecto pariatur placeat tempore ipsa suscipit similique corrupti laboriosam voluptas maiores. Adipisci ipsum iusto earum natus quis libero quas aut voluptates sit.

Lorem ipsum dolor sit amet consectetur adipisicing elit. Mollitia nemo aliquid itaque ut, sed exercitationem magnam fuga explicabo esse corporis eum porro molestias, culpa aliquam debitis! Veritatis enim atque Lorem ipsum dolor sit, amet consectetur adipisicing elit.

Entrapment Efficiency

+

Entrapment Efficiency

Lorem ipsum dolor sit amet consectetur adipisicing elit. Mollitia nemo aliquid itaque ut, sed exercitationem magnam fuga explicabo esse corporis eum porro molestias, culpa aliquam debitis! Veritatis enim atque Lorem ipsum dolor sit, amet consectetur adipisicing elit. Architecto pariatur placeat tempore ipsa suscipit similique corrupti laboriosam voluptas maiores. Adipisci ipsum iusto earum natus quis libero quas aut voluptates sit.

Lorem ipsum dolor sit amet consectetur adipisicing elit. Mollitia nemo aliquid itaque ut, sed exercitationem magnam fuga explicabo esse corporis eum porro molestias, culpa aliquam debitis! Veritatis enim atque Lorem ipsum dolor sit, amet consectetur adipisicing elit.

Storage Stability Test

+

Storage Stability Test

Lorem ipsum dolor sit amet consectetur adipisicing elit. Mollitia nemo aliquid itaque ut, sed exercitationem magnam fuga explicabo esse corporis eum porro molestias, culpa aliquam debitis! Veritatis enim atque Lorem ipsum dolor sit, amet consectetur adipisicing elit. Architecto pariatur placeat tempore ipsa suscipit similique corrupti laboriosam voluptas maiores. Adipisci ipsum iusto earum natus quis libero quas aut voluptates sit.

Lorem ipsum dolor sit amet consectetur adipisicing elit. Mollitia nemo aliquid itaque ut, sed exercitationem magnam fuga explicabo esse corporis eum porro molestias, culpa aliquam debitis! Veritatis enim atque Lorem ipsum dolor sit, amet consectetur adipisicing elit.

Detached Leaf Assay

+

Detached Leaf Assay

Lorem ipsum dolor sit amet consectetur adipisicing elit. Mollitia nemo aliquid itaque ut, sed exercitationem magnam fuga explicabo esse corporis eum porro molestias, culpa aliquam debitis! Veritatis enim atque Lorem ipsum dolor sit, amet consectetur adipisicing elit. Architecto pariatur placeat tempore ipsa suscipit similique corrupti laboriosam voluptas maiores. Adipisci ipsum iusto earum natus quis libero quas aut voluptates sit.

Lorem ipsum dolor sit amet consectetur adipisicing elit. Mollitia nemo aliquid itaque ut, sed exercitationem magnam fuga explicabo esse corporis eum porro molestias, culpa aliquam debitis! Veritatis enim atque Lorem ipsum dolor sit, amet consectetur adipisicing elit.

Fluorescence Microscopy

+

Fluorescence Microscopy

Lorem ipsum dolor sit amet consectetur adipisicing elit. Mollitia nemo aliquid itaque ut, sed exercitationem magnam fuga explicabo esse corporis eum porro molestias, culpa aliquam debitis! Veritatis enim atque Lorem ipsum dolor sit, amet consectetur adipisicing elit. Architecto pariatur placeat tempore ipsa suscipit similique corrupti laboriosam voluptas maiores. Adipisci ipsum iusto earum natus quis libero quas aut voluptates sit.

Lorem ipsum dolor sit amet consectetur adipisicing elit. Mollitia nemo aliquid itaque ut, sed exercitationem magnam fuga explicabo esse corporis eum porro molestias, culpa aliquam debitis! Veritatis enim atque Lorem ipsum dolor sit, amet consectetur adipisicing elit.

SEM Analysis

+

SEM Analysis

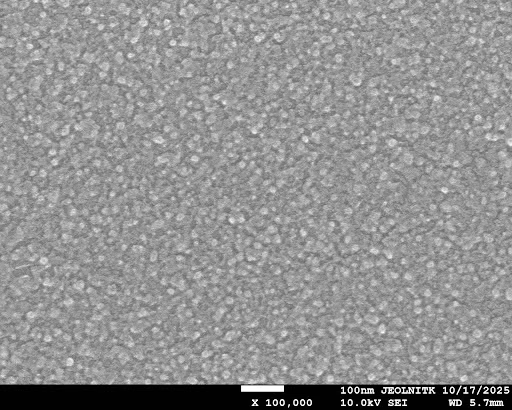
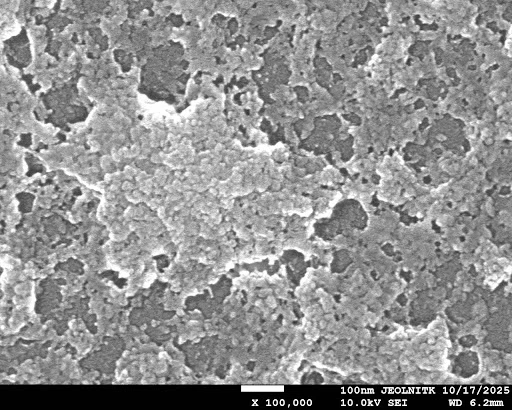
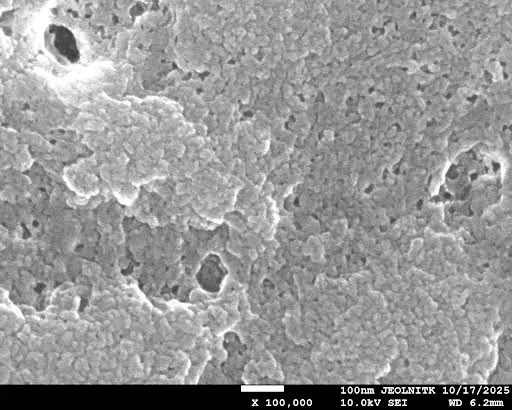
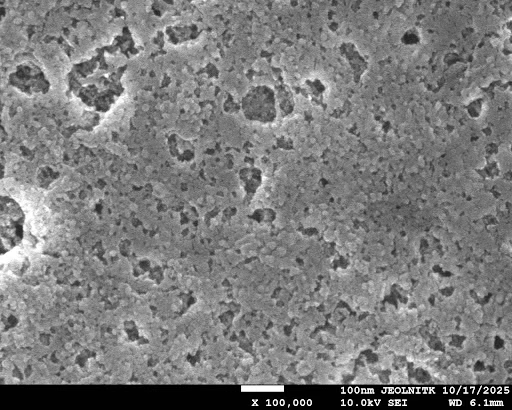
Lorem ipsum dolor sit amet consectetur adipisicing elit. Mollitia nemo aliquid itaque ut, sed exercitationem magnam fuga explicabo esse corporis eum porro molestias, culpa aliquam debitis! Veritatis enim atque Lorem ipsum dolor sit, amet consectetur adipisicing elit. Architecto pariatur placeat tempore ipsa suscipit similique corrupti laboriosam voluptas maiores. Adipisci ipsum iusto earum natus quis libero quas aut voluptates sit.

Lorem ipsum dolor sit amet consectetur adipisicing elit. Mollitia nemo aliquid itaque ut, sed exercitationem magnam fuga explicabo esse corporis eum porro molestias, culpa aliquam debitis! Veritatis enim atque Lorem ipsum dolor sit, amet consectetur adipisicing elit.

P. capsici Zoospore Testing

+

P. capsici Zoospore Testing

Lorem ipsum dolor sit amet consectetur adipisicing elit. Mollitia nemo aliquid itaque ut, sed exercitationem magnam fuga explicabo esse corporis eum porro molestias, culpa aliquam debitis! Veritatis enim atque Lorem ipsum dolor sit, amet consectetur adipisicing elit. Architecto pariatur placeat tempore ipsa suscipit similique corrupti laboriosam voluptas maiores. Adipisci ipsum iusto earum natus quis libero quas aut voluptates sit.

Lorem ipsum dolor sit amet consectetur adipisicing elit. Mollitia nemo aliquid itaque ut, sed exercitationem magnam fuga explicabo esse corporis eum porro molestias, culpa aliquam debitis! Veritatis enim atque Lorem ipsum dolor sit, amet consectetur adipisicing elit.

Zoospore Mobility Assay

+

Zoospore Mobility Assay

Lorem ipsum dolor sit amet consectetur adipisicing elit. Mollitia nemo aliquid itaque ut, sed exercitationem magnam fuga explicabo esse corporis eum porro molestias, culpa aliquam debitis! Veritatis enim atque Lorem ipsum dolor sit, amet consectetur adipisicing elit. Architecto pariatur placeat tempore ipsa suscipit similique corrupti laboriosam voluptas maiores. Adipisci ipsum iusto earum natus quis libero quas aut voluptates sit.

Lorem ipsum dolor sit amet consectetur adipisicing elit. Mollitia nemo aliquid itaque ut, sed exercitationem magnam fuga explicabo esse corporis eum porro molestias, culpa aliquam debitis! Veritatis enim atque Lorem ipsum dolor sit, amet consectetur adipisicing elit.