To study molecular interactions under realistic conditions, we employ molecular dynamics (MD) simulations using GROMACS1 to analyze CC-domains, protease AvrRpt2, and COR triggered fused protein complex assembly in the signaling pathways. AvrRpt2 cleaves RIN4 sequences in linkers connecting weakly associated CC-domain peptides, thereby allowing the strongly interacting peptide pairs to associate and mediate downstream signaling. Therefore, the differential binding affinities among CC-domains and the efficient cleavage activity of AvrRpt2 play a crucial role in the recognition of Pst. COR stabilizes the interaction between COI1 and JAZ1, thereby facilitating the association of the two split PPVp domains and enabling their catalytic cleavage activity, which is also worth detailed investigation.
MD allows us to reproduce the laboratory environment on a computer, including water, ions, temperature, and pressure, so that proteins, peptide complexes, and other biomolecules can adopt conformations closer to their natural states. Beyond static structural predictions or docking, MD provides dynamic trajectories that show how molecules move, stabilize, or rearrange over time, especially during production MD simulation. This makes it possible to examine interaction strength, structural stability, and even residue-level contributions to binding free energy. In this way, GROMACS serves as a powerful tool to validate molecular interactions and to uncover the detailed mechanisms behind stability and recognition in protein or peptide systems.
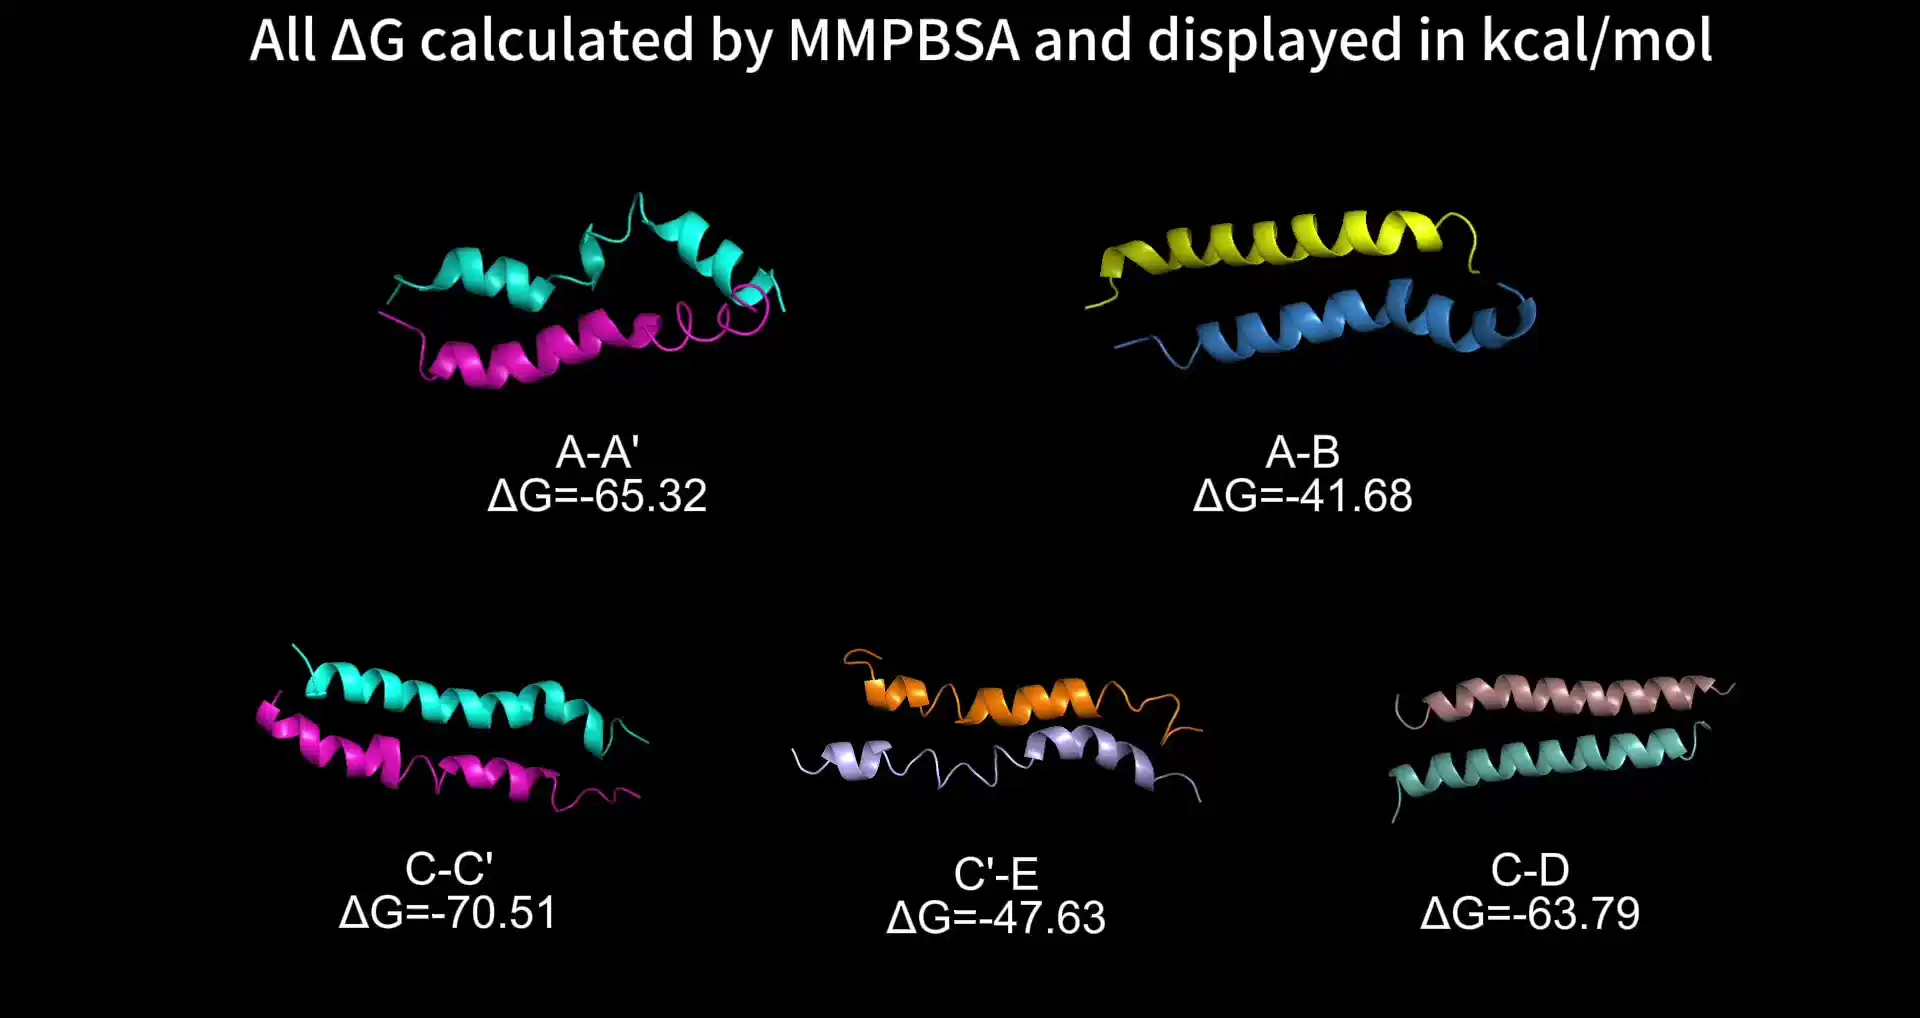
Fig.1 The signal route including AvrRpt2, A-A', A-B, C-C', C-D, and C'-E
Cleavage of RIN4 by AvrRpt2
Pst AvrRpt2 (AvrRpt2PS) is an effector protease that specifically cleaves the linkers between leucine zippers in our designed signaling routes, thereby controlling downstream responses. Understanding how this enzyme recognizes and processes its substrates is crucial for interpreting the molecular basis of the signal cascade. We aimed to confirm the binding stability and identify key residues involved in substrate recognition in this part. To address this, we carried out simulations to capture its binding dynamics under near-physiological conditions. We evaluated the energy of the enzyme–substrate binding state and the examined structure interface. Such interactions are closely related to the positioning of the cleavage site and may therefore influence the cleavage efficiency.
System Assembly
Basic Idea
Although no experimental structure is currently available for AvrRpt2PS, the resolved structure of Erwinia amylovora AvrRpt2 (AvrRpt2EA) provides a reliable template for homology modeling. After AvrRpt2PS undergoes autocleavage, it reaches the mature sequence and shows high sequence similarity with the reference AvrRpt2EA structure 6HQZ2.
The catalytic triad in AvrRpt2PS is residues Cys122–His208–Asp2263, which can be set as the active core site for the cleavage sequence of RIN4 to bind.
Procedure
Structure Preparation
We downloaded the AvrRpt2PS structure (predicted) from AlphafoldDB4 as chain A. The linker (including RIN4 minimum cleavage sequence) structural model was obtained from Robetta5 as chain B.
Cys122, His208, and Asp226 in AvrRpt2 and RIN4 sequence VPKFGNW were defined as active residues, ensuring that the RIN4 peptide fragment is properly oriented near the proteolytic site to generate realistic binding conformations.
Molecular Dynamics
Simulation
We used a combination of steepest descent (SD) and conjugate gradient (CG) to minimize the energy of the system, followed by NVT and NPT equilibration with a gradient reduction of position constraint. The production MD lasts 100 ns, output 50000 frames.
Trajectory Processing
Results
Overall Stability
We carried out Root Mean Square Deviation (RMSD) analysis of the protein complex, which shows the deviation of the whole complex from the reference structure (frame 1 of the trajectory) during the production MD simulation.
Fig.2 Cα RMSD of the protein complex relative to the initial structure after least-squares fitting to the Cα atoms. The red line shows the moving average smoothed over a 300-frame window.
Relative to the initial conformation, the system’s RMSD value gradually increases during the production simulation, reaching a plateau around 0.75 nm after 50 ns with slight fluctuations, and indicating the complex becomes stable and experiences less conformational change during the last 25 ns as shown in fig.2.
We adopted Molecular Mechanics Poisson–Boltzmann Surface Area (MMPBSA)7 to calculate the energy of the complex. MMPBSA is a post-process method used to calculate ΔG of complexes based on molecular dynamics trajectories gained from MD simulation. The ΔG calculated here included gas-phase molecular mechanics energy (ΔGgas) and solvation free energy (ΔGsolv), without entropy contribution.
Based on the RMSD result, we calculated MMPBSA from 50 ns to 100 ns, and set dt=250 ps to get a sample of 200 frames.
Fig.3 Total ΔG, calculated by MMPBSA using the normal PB model.
The binding free energy of the protein system rises from approximately –120 kcal/mol to around –90 kcal/mol, where it fluctuates, indicating that the system has converged to a steady low-energy state as depicted in fig.3.
Fig.4 Energy component decomposition of ΔG calculated by MMPBSA using the normal PB model.
The ΔGgas decomposition includes van der Waals interactions (VDWAALS) and electrostatic energy (EEL), while ΔGsolv consists of the polar solvation term (EPB) and the nonpolar solvation term (ENPOLAR). Van der Waals interactions arise from close packing and dispersion forces, while electrostatic energy results from complementary charge interactions. Both VDWAALS and EEL are negative, reflecting the favorable attractive forces between the enzyme and substrate. EPB represents the polar solvation penalty, which is positive because desolvating polar groups upon binding is energetically costly, partially offsetting the favorable gas-phase interactions. ENPOLAR is slightly negative, reflecting favorable nonpolar interactions with the solvent that are retained upon binding. Overall, the total binding free energy ΔG, which is the sum of ΔGgas and ΔGsolv, remains negative, indicating that the enzyme–substrate complex formation is thermodynamically favorable.
Overall, the binding structure is well supported by the calculated energetic profile, consistent with a stable protein–protein interaction.
Binding Interface and Energy Distribution
To examine the residues located at the protein–protein interface and their contributions to ΔG, we used a residue decomposition in MMPBSA. Residues were defined as interface residues if any of their heavy atoms were within 6 Å of at least one heavy atom from the opposite chain at a given frame. This criterion ensured that only residues in direct spatial contact were included in the analysis.
Residues with lower (more negative) ΔG values contribute more strongly to stabilizing the binding, while higher values indicate weaker or destabilizing contributions.
Fig.5 Per-residue decomposition of ΔG calculated by MMPBSA using the normal PB model, A for chain A, B for chain B.
Two of the three catalytic triad residues—Cys122 and Asp226—are included, both showing negative contributions to binding free energy. In addition, several other residues exhibit relatively large contributions to ΔG, and they are Gln115, Asn117, and Glu135 in chain A, as well as Gly1 and Trp21 in chain B.
We also looked into the Root Mean Square Fluctuation (RMSF) of the complex, which calculates how much a residue fluctuates around its average position over the course of the simulation, and mapped it on the structure. Regions with higher RMSF values are more flexible, while regions with lower values are more rigid and stable.
Fig.6 RMSF of the complex. The color scale ranges from blue to white to red, representing RMSF values from low to high.
AvrRpt2 and its bound cleavage sequence exhibit relatively constrained fluctuations around their reference conformations, in contrast to the higher flexibility of the GS motif. The enhanced mobility of the free GS sequence likely accounts for the elevated RMSD compared with typical levels, and this flexibility in turn facilitates the proper engagement of AvrRpt2 with its cleavage site.
In summary, the per-residue energy decomposition highlights the key residues that stabilize binding, while RMSF analysis reveals that flexibility is mainly concentrated in the linker region. Together, these results support the expected binding mode and provide a clear picture of how structural dynamics contribute to the interaction.
Peptide affinity in water
For the CC-domain peptides in our signal routes, we applied MD analysis to check whether their binding affinities match expected theoretical values. First, structural models of peptide pairs were generated through prediction and docking. These complexes were then placed in explicit water with ions, equilibrated, and simulated with GROMACS. The production runs provided trajectories of peptides from which we analyzed stability and calculated binding free energies (ΔG). These ΔG values allow us to compare peptide pairs quantitatively and can be related to dissociation constants (Kd). Moreover, apart from confirming the expected ranking of affinities, the simulation can also reveal which residues play the largest role in stabilizing or weakening peptide binding, providing a reference for mutation design.
System Preparation
5 pairs of CC-domains - AA’, AB, CC’, CD, and CE - were involved. The structures of single chains were obtained from Robetta and put into HADDOCK for docking.
Molecular Dynamics
Simulation
All the structures were placed in GROMACS, and the simulation setup involved defining the simulation box, solvating the system, adding counterions for neutralization, followed by energy minimization, NVT equilibration, and NPT equilibration.
We carried out 50 ns of production MD simulation to let the peptides relax and adopt energetically favorable structures.
Trajectory Processing
This step is to make the entire complex whole by combining the fractions caused by periodic boundary conditions and to center it within the solvent box.
Results
We conducted MMPBSA mainly to compare the ΔG of different CC-domains. We use the negative value of ΔG to reflect binding strength. ΔG is the free energy released during the binding process - the greater the energy release, the more stable the resulting complex. Thus, a more negative ΔG indicates stronger binding affinity, allowing us to compare and rank the relative affinities of different complexes.
Table1. ΔG decomposition (kcal·mol⁻¹) of A-A' and A-B.
ΔGgas
ΔGsolv
ΔG
A-A'
-364.86
299.53
-65.32
A-B
-223.57
181.90
-41.68
Table2. ΔG decomposition (kcal·mol⁻¹) of C-C', C-D, and C'-E.
ΔGgas
ΔGsolv
ΔG
C-C'
-197.78
127.26
-70.51
C-D
-178.08
114.29
-63.79
C'-E
-201.35
153.72
-47.63
The two charts indicate that A–A′ binds more strongly than A–B, and that C–C′ binds more strongly than C–D or C′–E.
Fig.7 Full simulation trajectory of the five CC domains over the production simulation run.
Though the ΔG values are lower than the normal level for reasons which would be discussed later, the relative ranks in both groups support that the binding affinity difference is true under simulated lab conditions and can be applied to experiments.
As for the abnormally low ΔG, the factors listed below have been considered:
Entropy (TΔS) not considered
We did not include the entropy contribution, which normally increases the system ΔG.
Sensitivity of electrostatic or solvation parameters
Analysis of the Two Lowest-ΔG CC-domains
We selected A–A′ and C–C′ as the two representative CC-domain pairs for detailed analysis, as they showed the strongest binding within their respective groups. To characterize their structural stability and binding energetics, we examined their RMSD trajectories and binding free energies from molecular dynamics (MD) simulations and MMPBSA calculations.
Below are the RMSD values of the two CC-domains as a function of time during the production MD simulation.
Fig.8 Cα RMSD of CC-domain A-A' relative to the initial structure after least-squares fitting to the Cα atoms. The red line shows the moving average smoothed over a 300-frame window.
Fig.9 Cα RMSD of CC-domain C-C' relative to the initial structure after least-squares fitting to the Cα atoms. The red line shows the moving average smoothed over a 300-frame window.
Both A–A′ and C–C′ exhibit an initial increase in RMSD within the first 25 ns, indicating structural adaptation from their starting conformations. Afterward, the moving average reaches a relatively stable plateau, suggesting that both complexes achieve equilibrium. However, A–A′ displays larger fluctuations during the final 25 ns, implying greater flexibility, while C–C′ stabilizes at a higher RMSD (~0.8 nm), consistent with a more adjusted overall conformation.
The ΔG of the equilibrated portion of the trajectories (frames 1500–5000, corresponding to 15–50 ns) was evaluated using the MMPBSA method with the normal Poisson–Boltzmann (PB) model.
Fig.10 Total ΔG of A-A', calculated by MMPBSA using the normal PB model.
Fig.11 Total ΔG of C-C', calculated by MMPBSA using the normal PB model.
Although fluctuations exist, the average ΔG values of both systems remain stable over time, confirming a converged and equilibrated region. The overall energy profiles suggest comparable binding stability, with subtle differences arising from sequence-specific interactions and conformational flexibilities.
We performed a decomposition analysis of ΔG to examine the contributions of individual residues in A–A′ and C–C′, as well as how these contributions fluctuate over time during the production MD simulation. The results are presented as heat maps below. The X-axis represents simulation time, while the Y-axis lists the residues within a 6 Å distance cutoff. The color scale denotes each residue’s binding energy contribution at a given frame, as indicated by the color bar on the left. A negative value corresponds to a favorable contribution to binding, with darker green shades indicating stronger stabilizing effects.
Fig. 12 Per-residue decomposition of ΔG calculated by MMPBSA using the normal PB model, A for peptide A', B for peptide A.
In the A–A′ complex, Arg5 and Arg12 from peptide A′, along with Asp2, Glu3, and Asp9 in peptide A, contribute significantly to interface stabilization, likely through salt bridges and electrostatic interactions.
Fig. 13 Per-residue decomposition of ΔG calculated by MMPBSA using the normal PB model, A for peptide C, B for peptide C'.
In peptide C, the key contributors to binding are Lys24, Lys26, and Lys31, whereas most other residues show negligible energetic contributions. For peptide C′, residues Glu12, Lys19, Lys24, Lys26, and Lys31 play dominant roles, suggesting that electrostatic complementarity is a primary factor stabilizing the C–C′ interface.
Overall, the CC-domains A–A′ and C–C′ exhibit stable binding according to our energy analysis, although further optimization of the sequences could be made regarding the residues that do not favor binding.
Stability of the Fusion Protein Complex with COR
Assembly of COI1 and JAZ1 in the presence of COR, together with the simultaneous binding of nPPVp and cPPVp as designed, triggers a series of downstream reactions and ultimately produces a positive signal for the detection of Pst. This part is to determine under the stabilization effect of the ligand COR on COI1 and JAZ1, whether the two pairs of interacting domains can remain ideally bound when integrated into the designed fusion proteins (COI1–linker1–nPPVp and JAZ1–linker2–cPPVp), and to evaluate whether the resulting complexes exhibit stable energetics and appropriate structural features.
Basic Flow
We first obtained the structures of the two binding domains and subsequently generated the fused constructs primarily using AlphaFold3, guided by template structures. A production simulation of 50 ns was conducted to examine their structural behavior under lab conditions.
Results
Both pairs of interacting domains, as well as the domain pairs connected through linkers, remained equilibrated and structurally stable throughout the 30–50 ns simulation window.
Fig. 14 Structures of the complex (COI1–linker1–nPPVp and JAZ1–linker2–cPPVp, with COR included) predicted by AlphaFold3 (left) and after MD refinement (right). COI1 is shown in green, JAZ1 in cyan, linker1 and linker2 in grey, nPPVp in blue, and cPPVp in yellow. COR is located within the binding pocket of COI1.
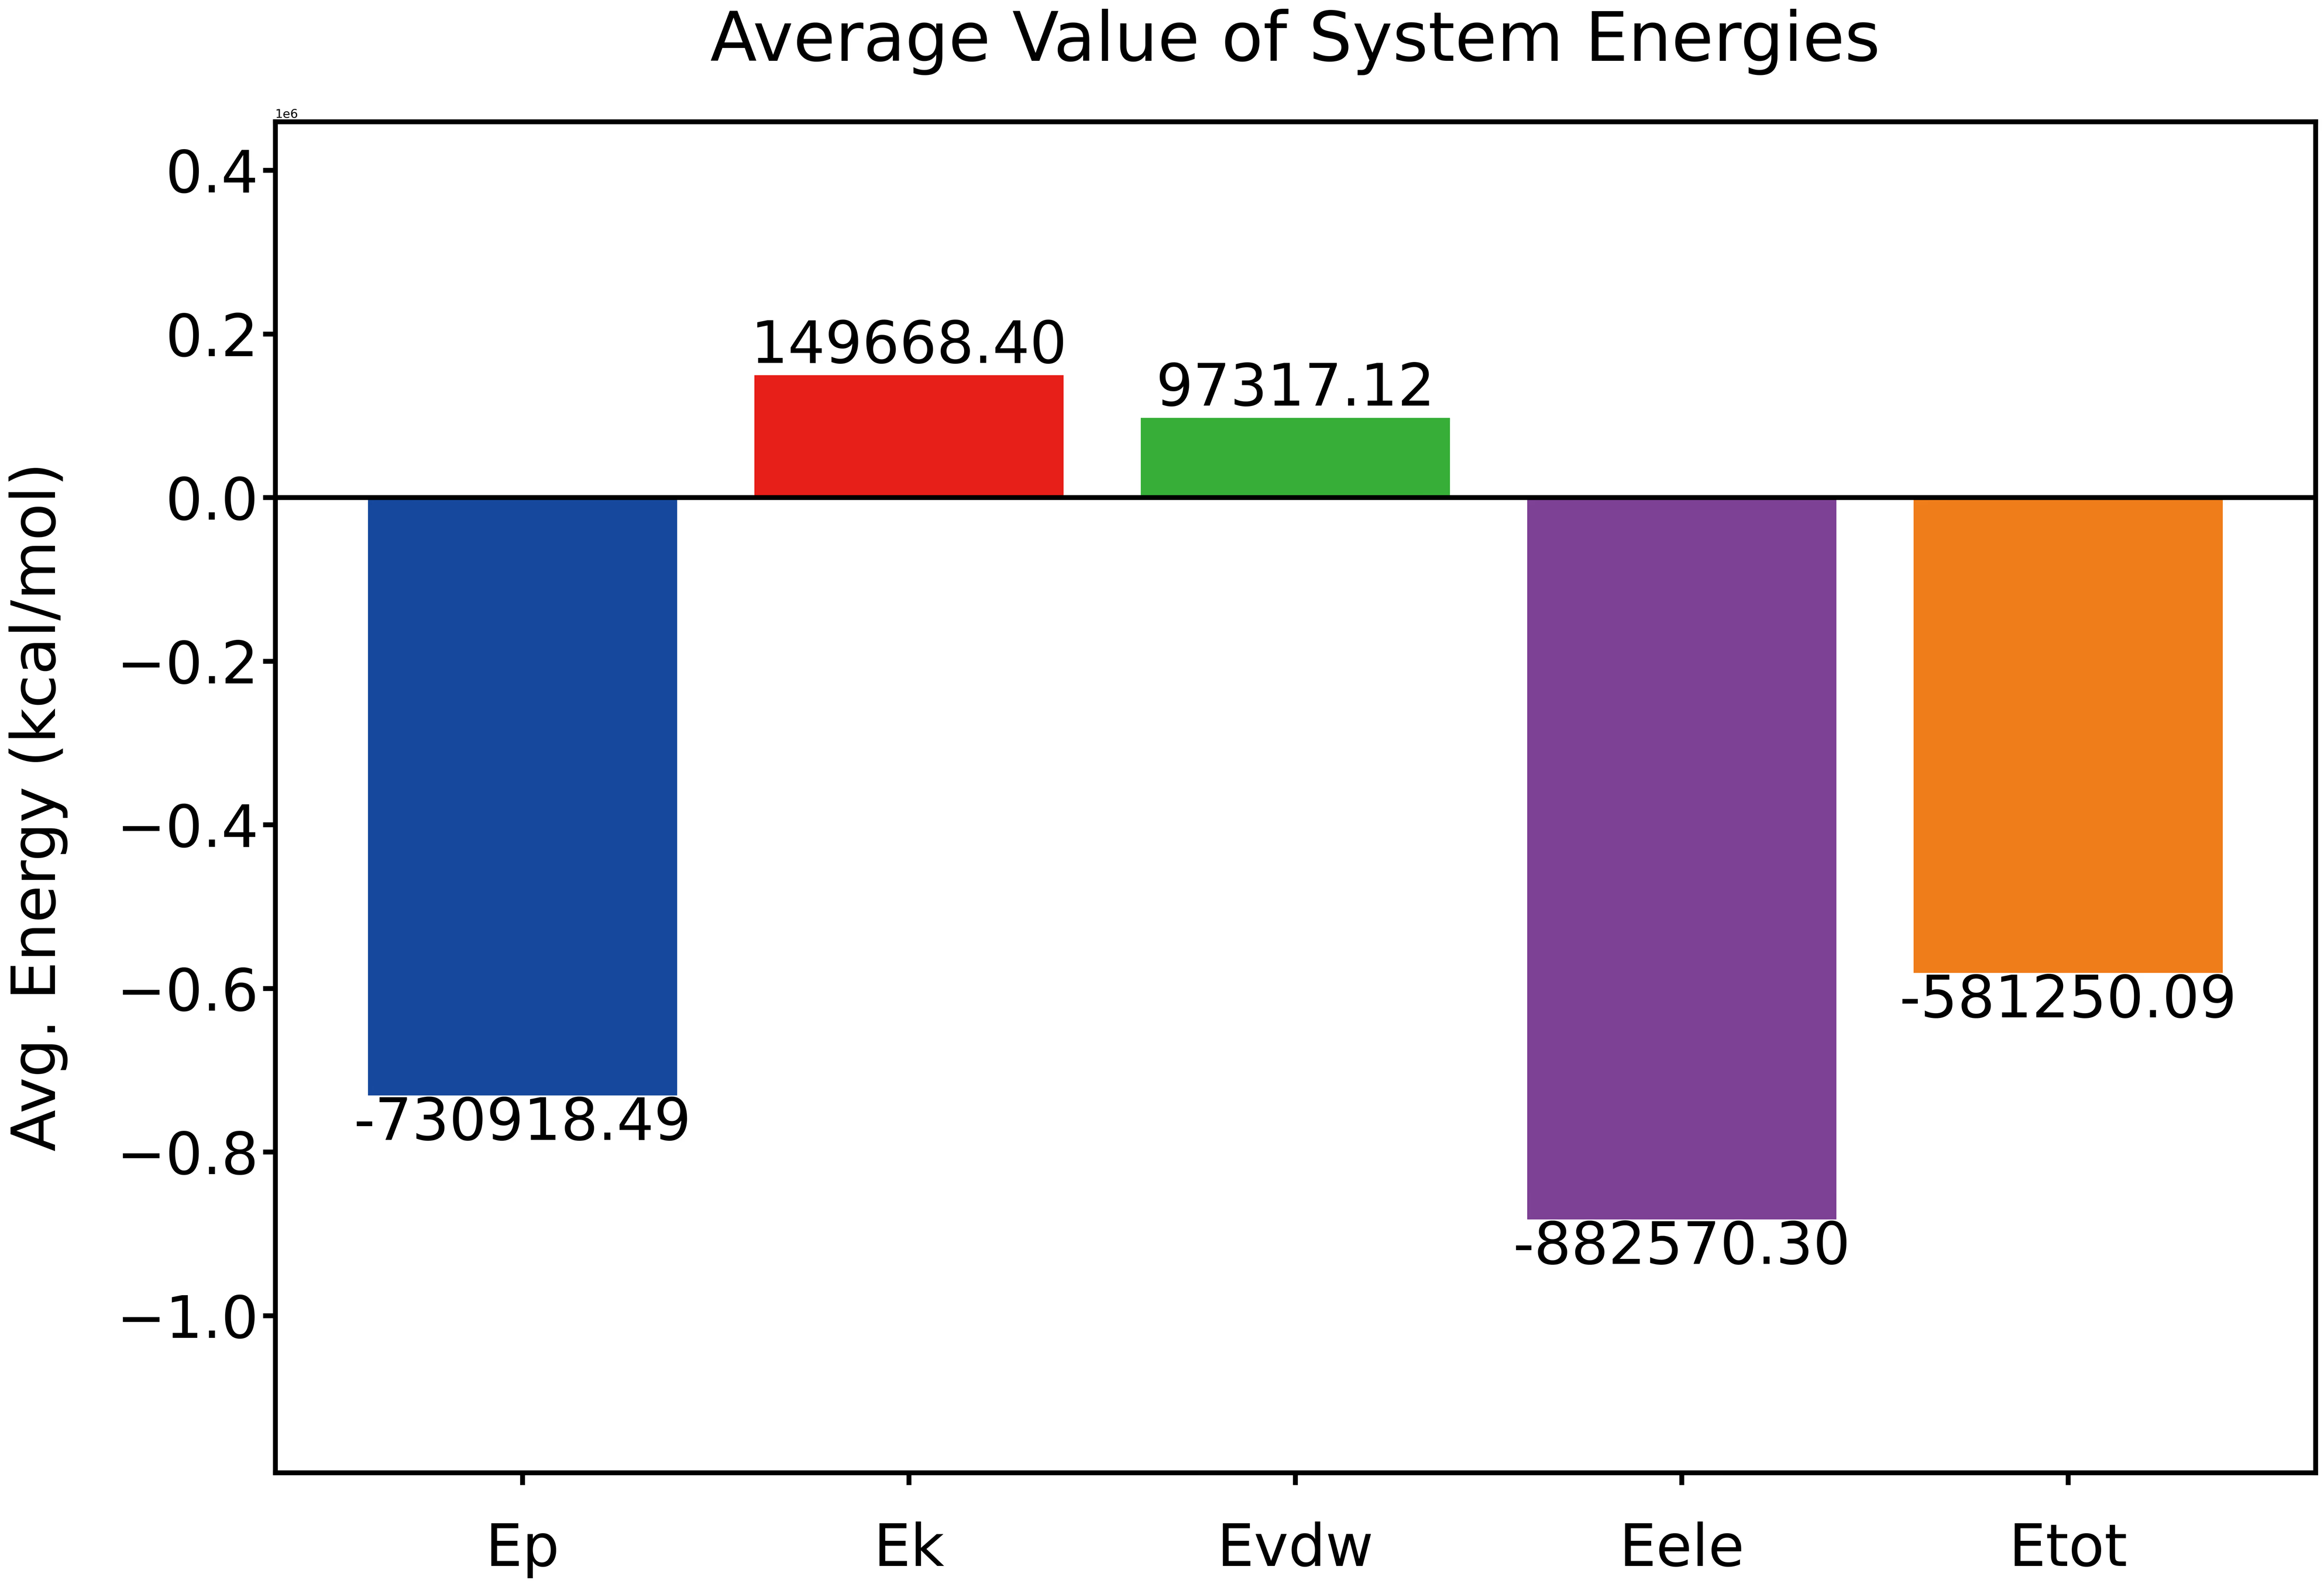
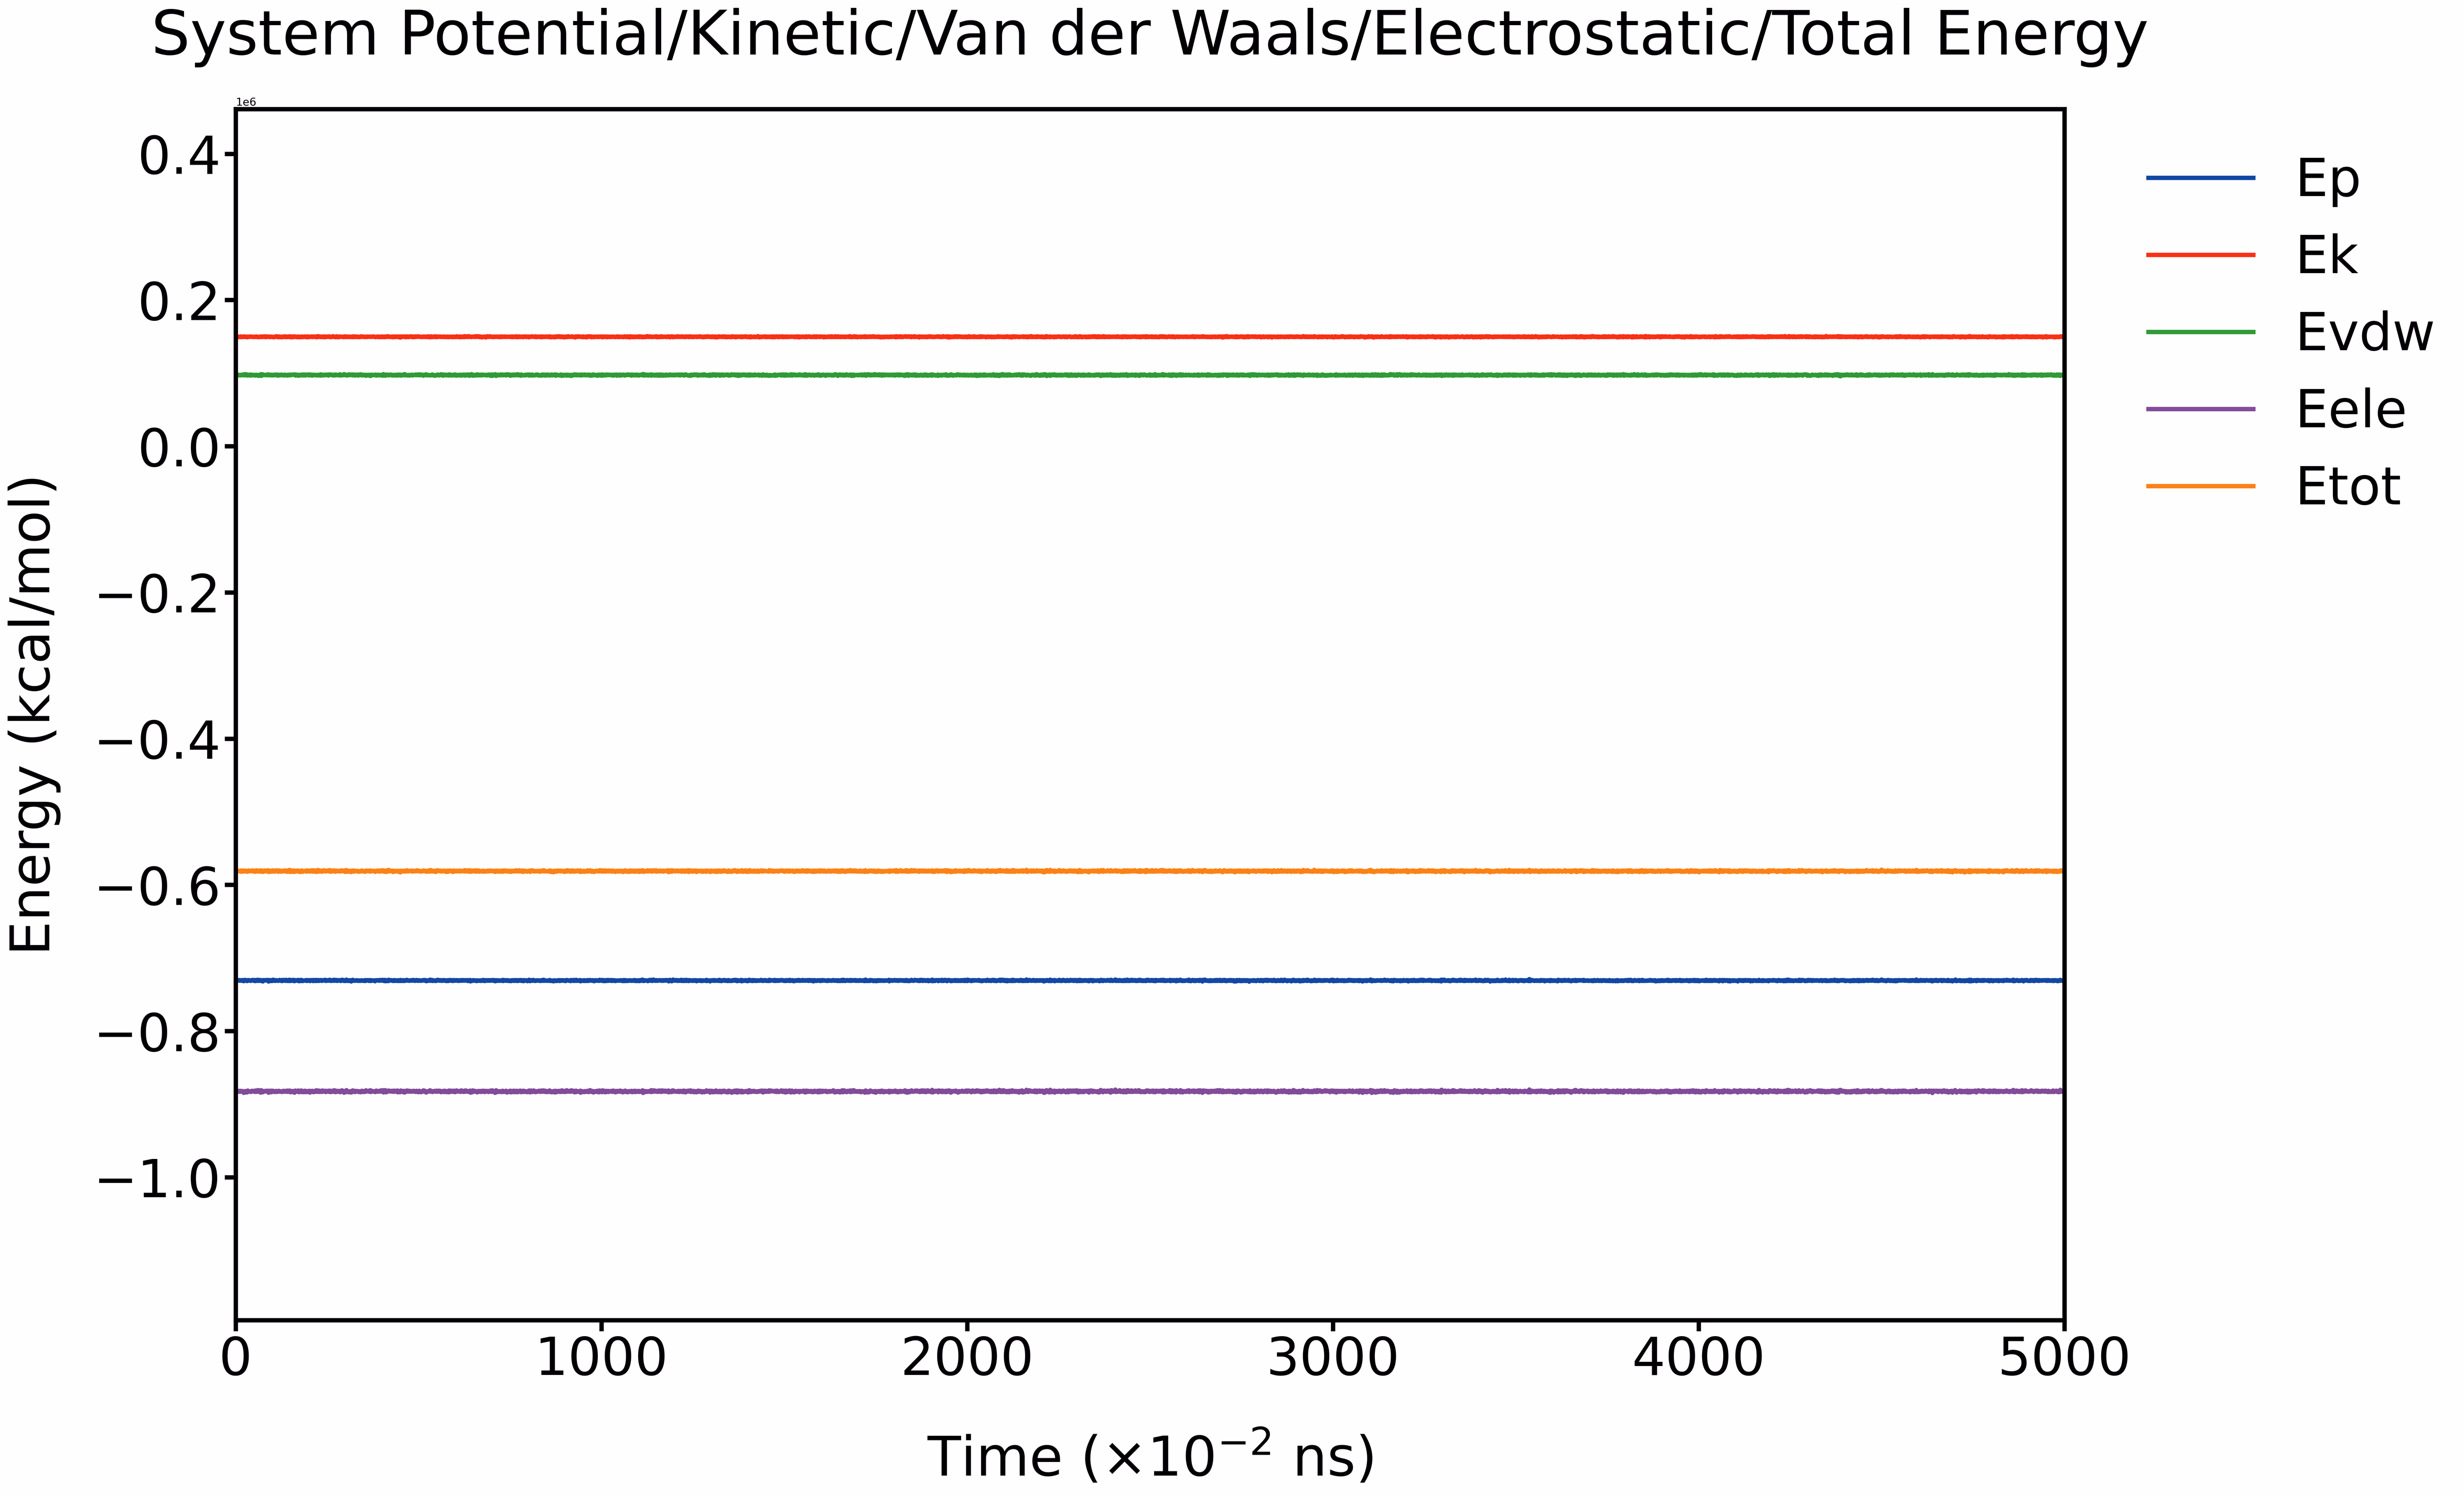
The total system energy, along with five individual energy components (potential energy Ep, kinetic energy Ek, van der Waals energy Evdw, electrostatic energy Eele, and total energy Etot), remained stable with no noticeable fluctuations across the entire production run. The average total energy was consistently negative, indicating thermodynamic favorability. Ek and Evdw adopt slightly positive values, while Eele and Ep remain negative, contributing to an overall stable binding state.
Fig. 15 Average value of system energies (Ep, Ek, Evdw, Eele, and Etot, ×106 Kcal/mol) during production simulation.
Fig. 16 Time-dependent profiles of the system energies (Ep, Ek, Evdw, Eele, and Etot, ×106 Kcal/mol) during production simulation.
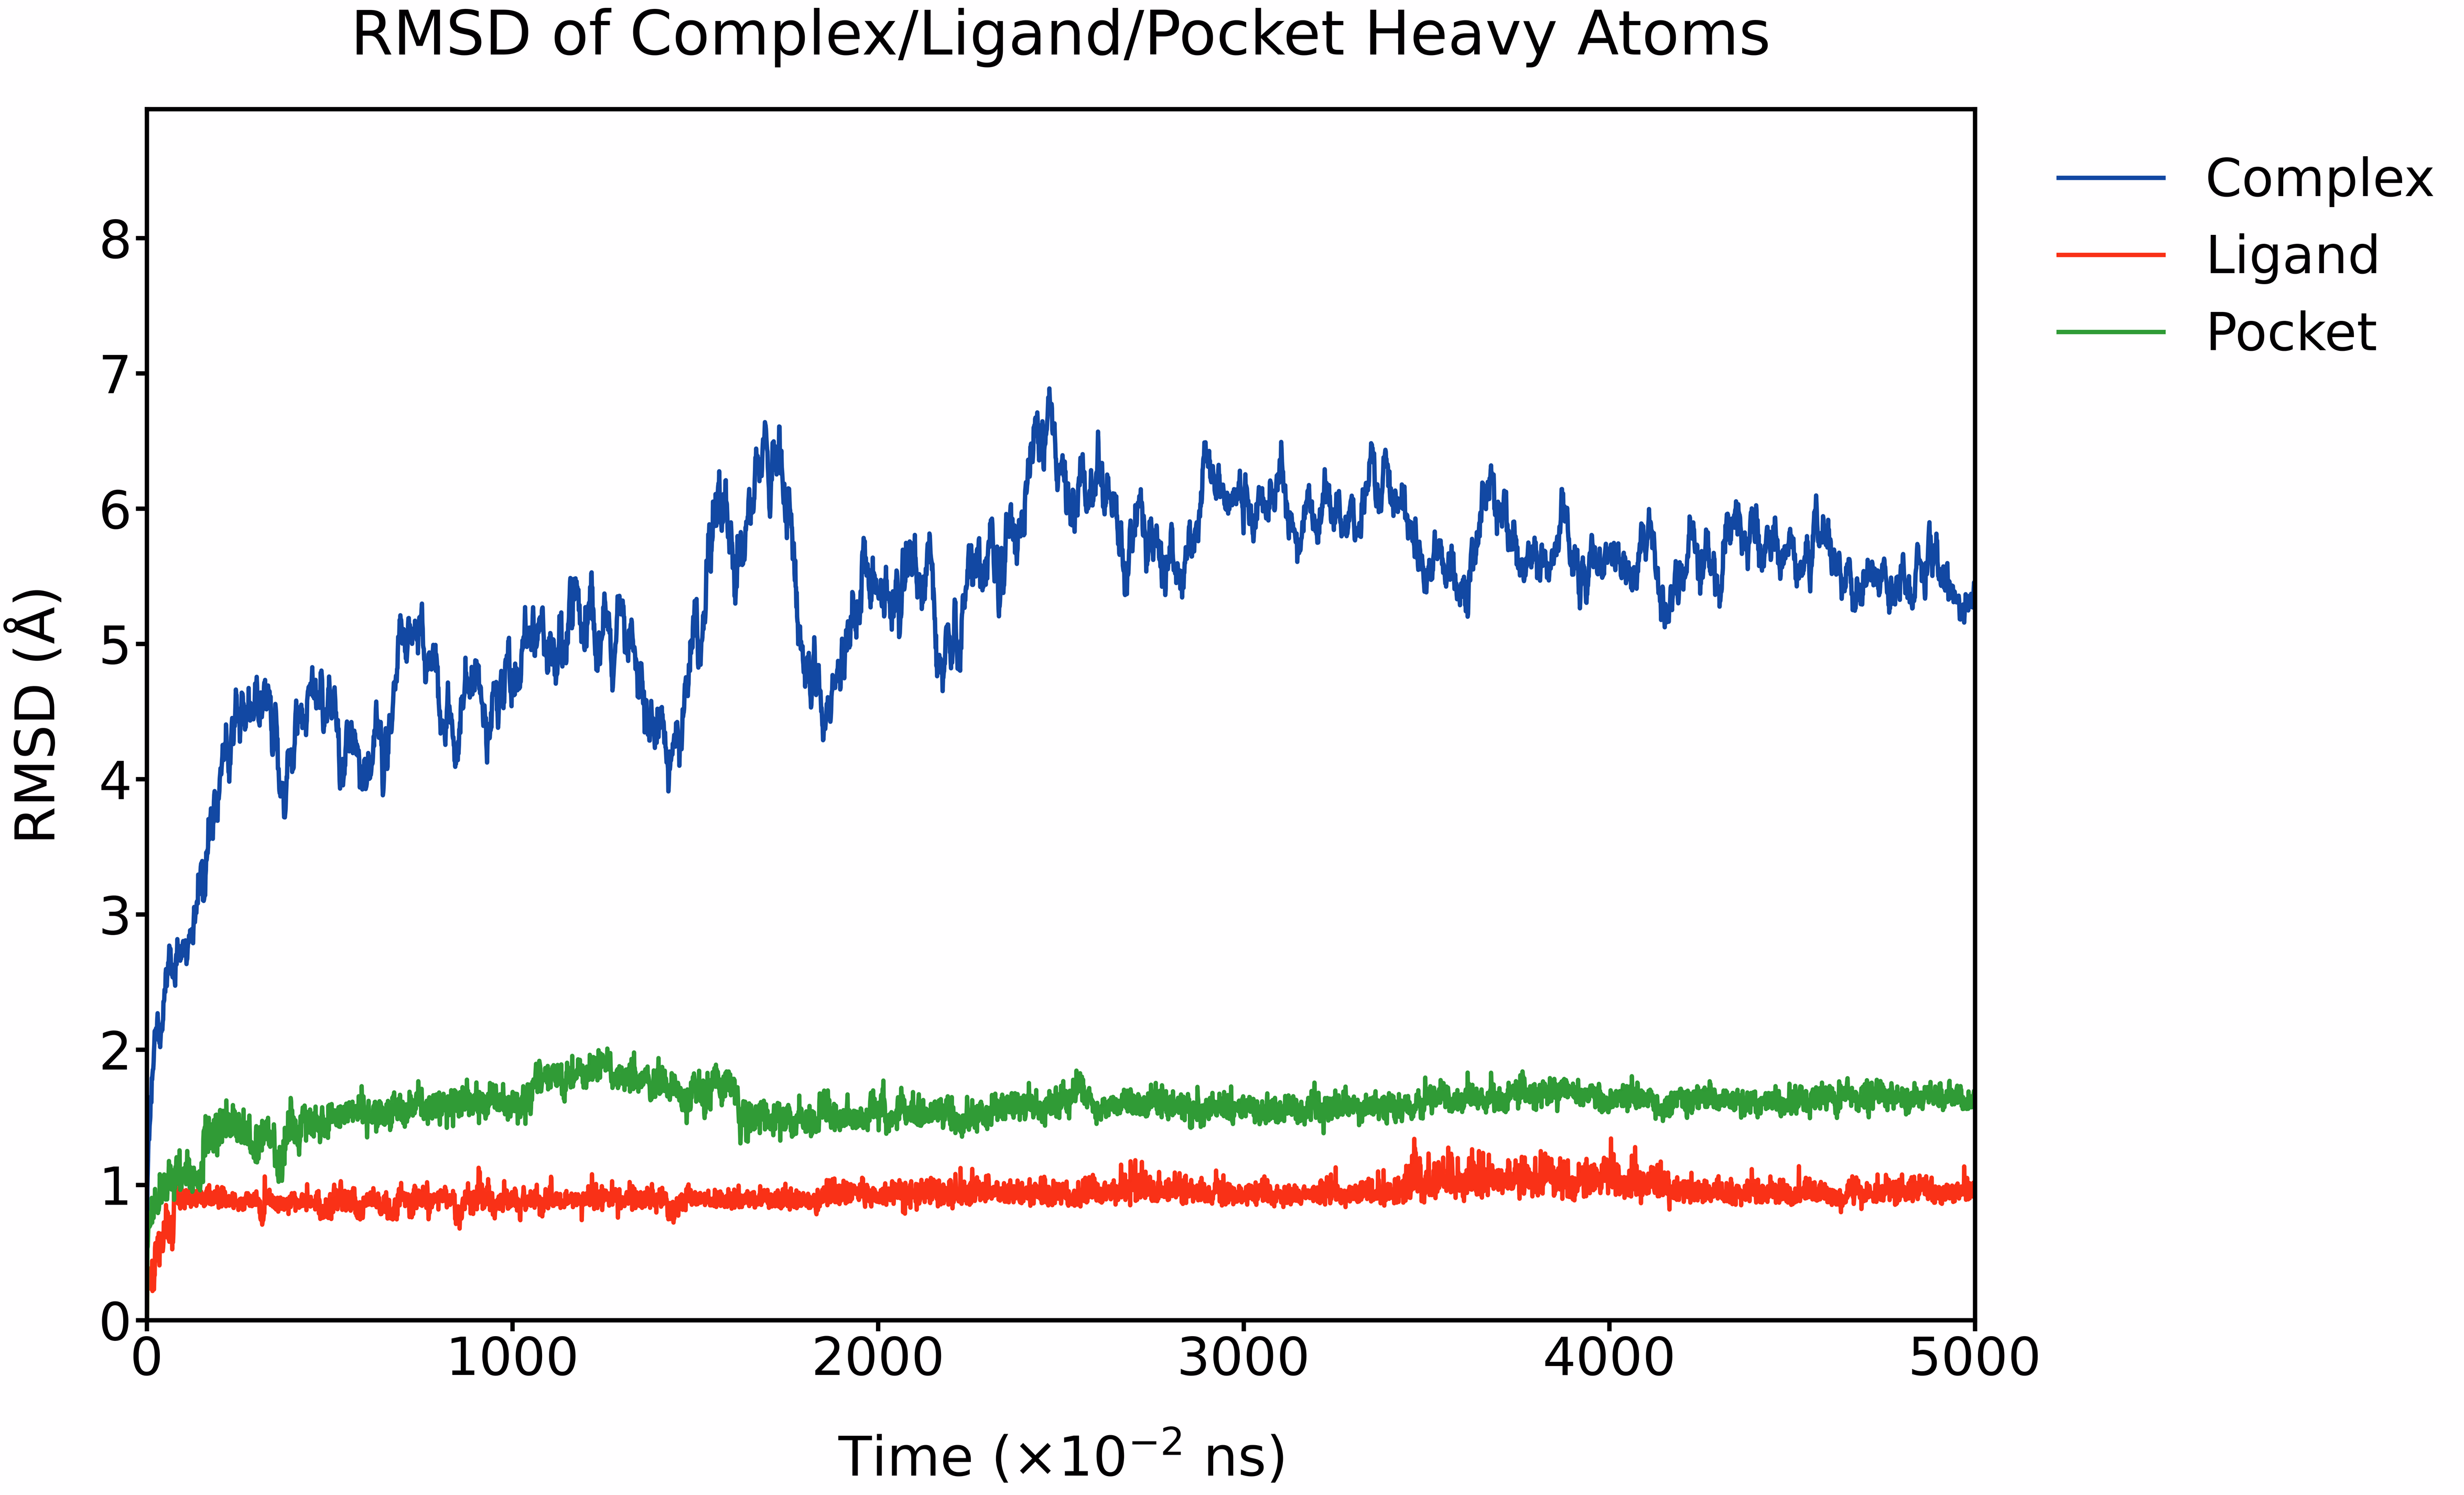
For the fused-protein binding system, the RMSD of the overall complex increased from 0 to approximately 5.5 Å during the initial phase of the simulation and subsequently remained stable. The RMSDs of the ligand and the binding pocket also showed a slight initial rise, stabilizing at around 1.0 Å and 1.8 Å, respectively.
Fig. 17 RMSD (Å) of the complex, ligand, and binding pocket over the simulation time, calculated using heavy atoms.
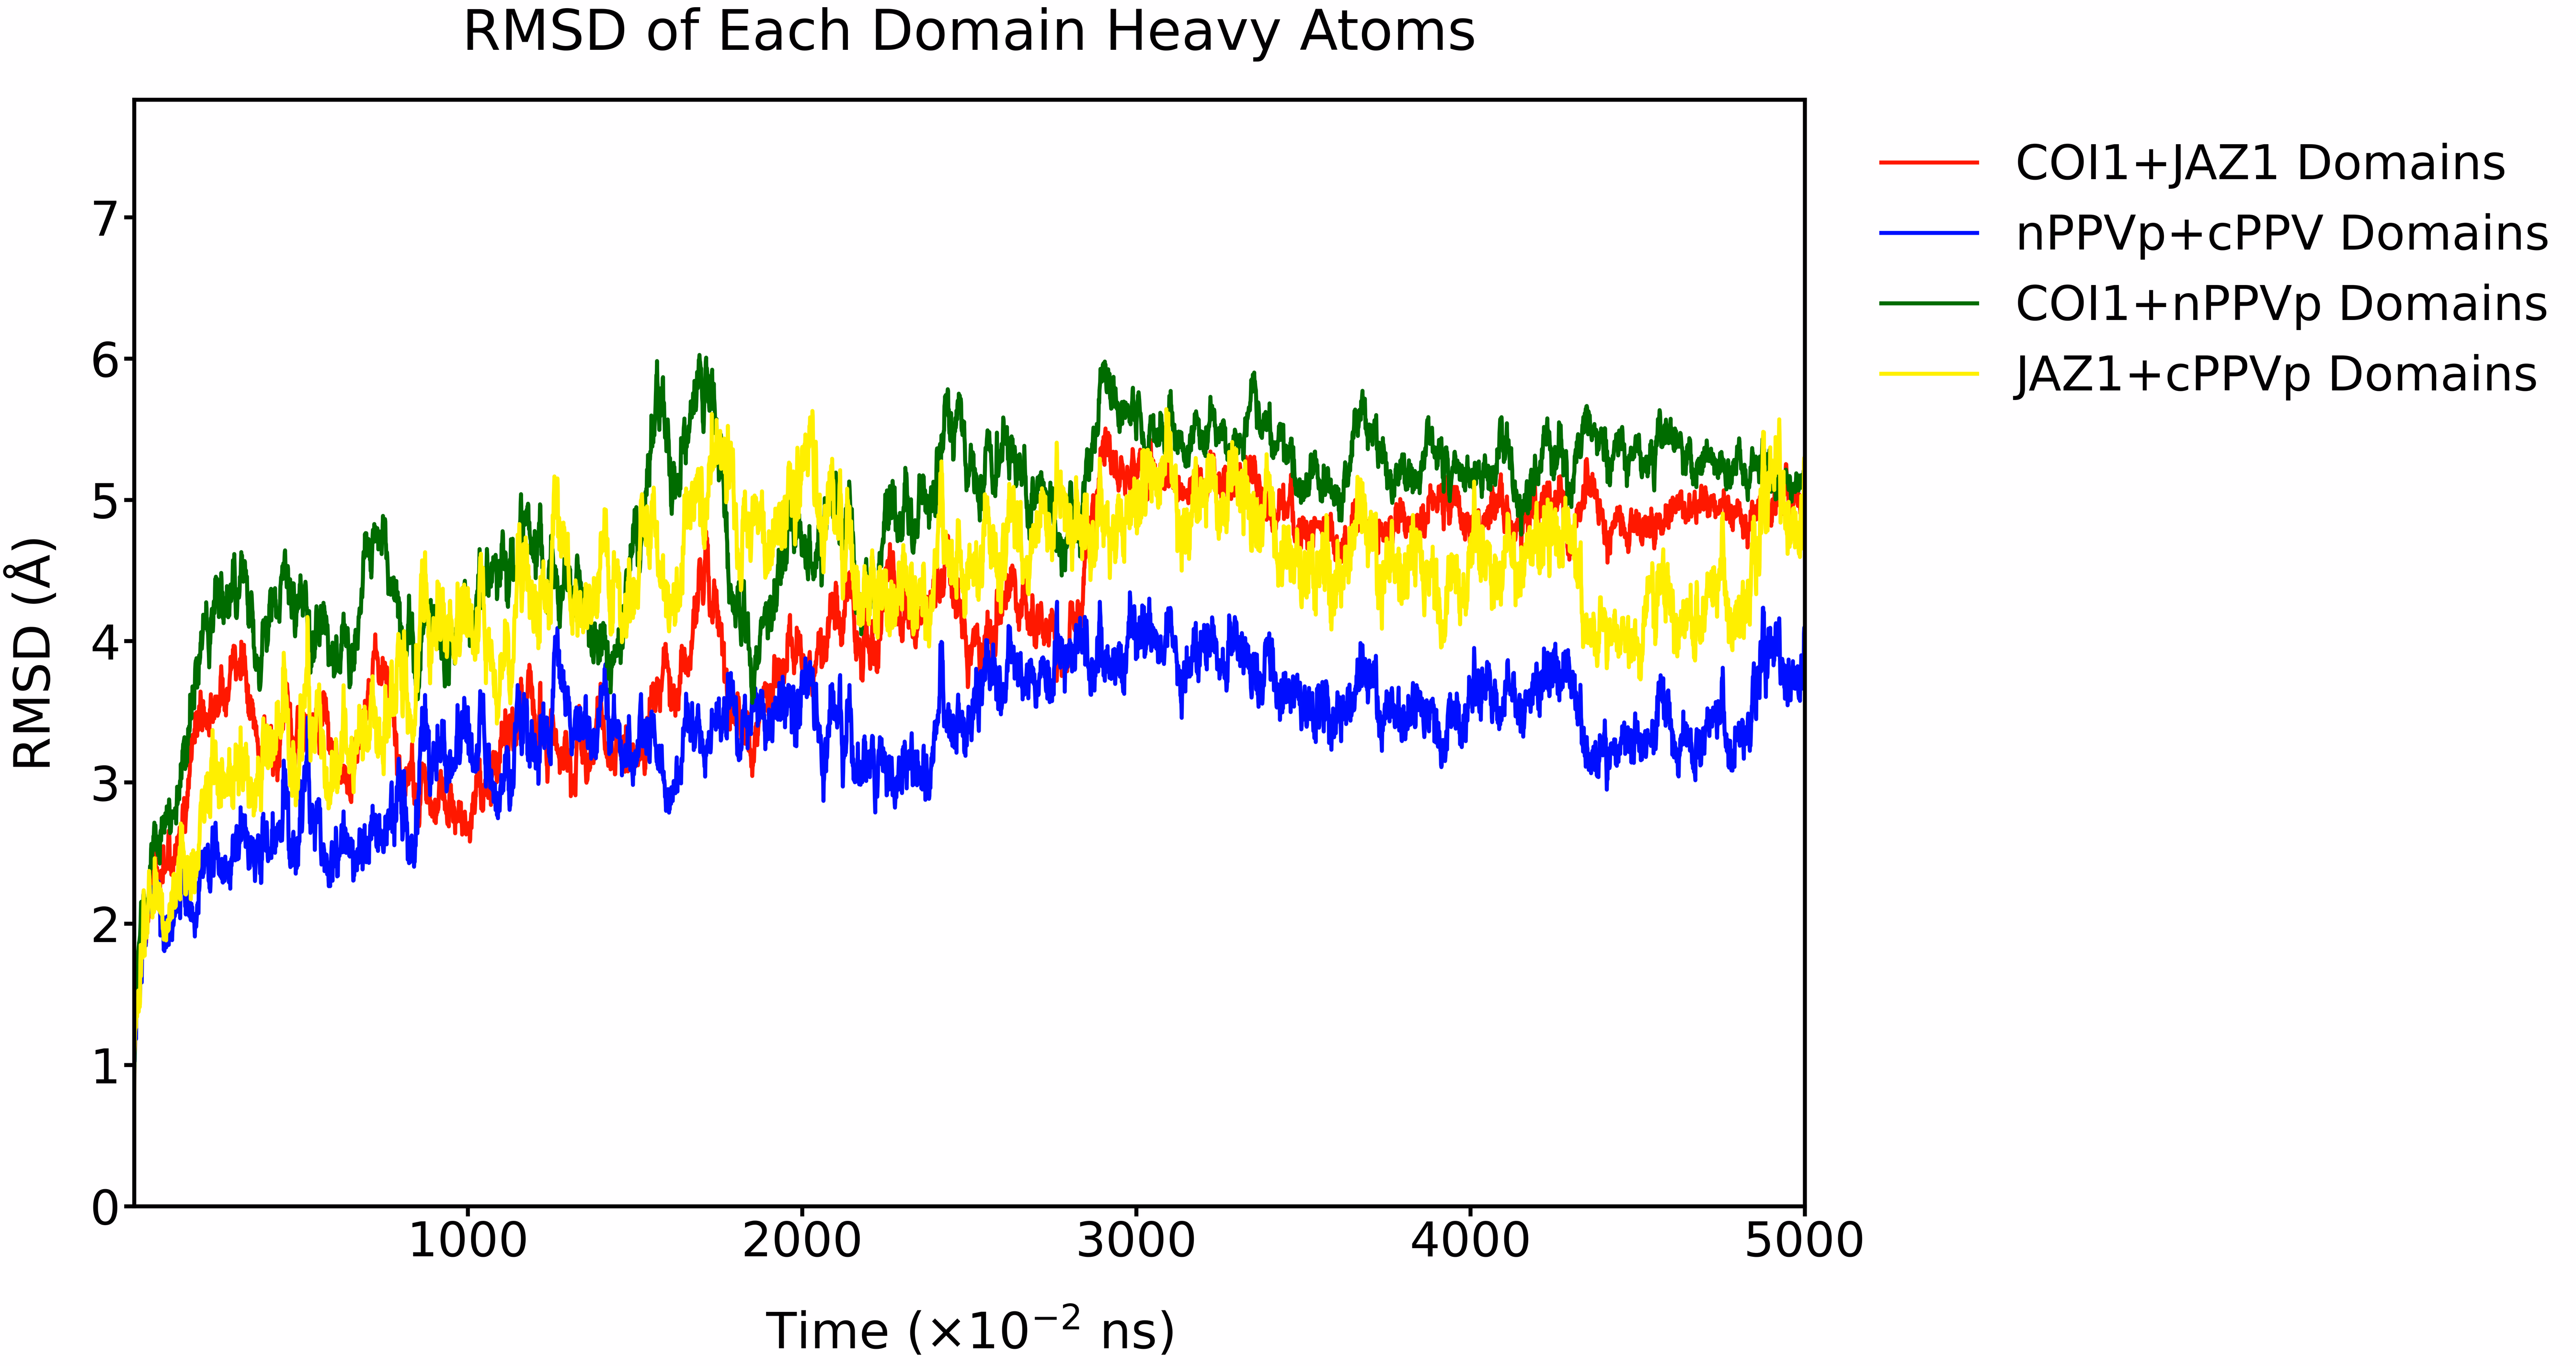
It can be observed that the RMSD profiles of different domain combinations exhibit similar trends over time. Both the interacting domains and the fused domains undergo structural optimization and reach energetic convergence during the simulation. The three combinations containing either COI1 or JAZ1 stabilized at approximately 5 Å. The RMSD of the nPPVp + cPPVp domain pair showed the smallest deviation, remaining around 3.4 Å, likely due to its relatively small complex size and favorable structural characteristics.
Fig. 18 RMSD (Å) of the domains over the simulation time, calculated using heavy atoms.
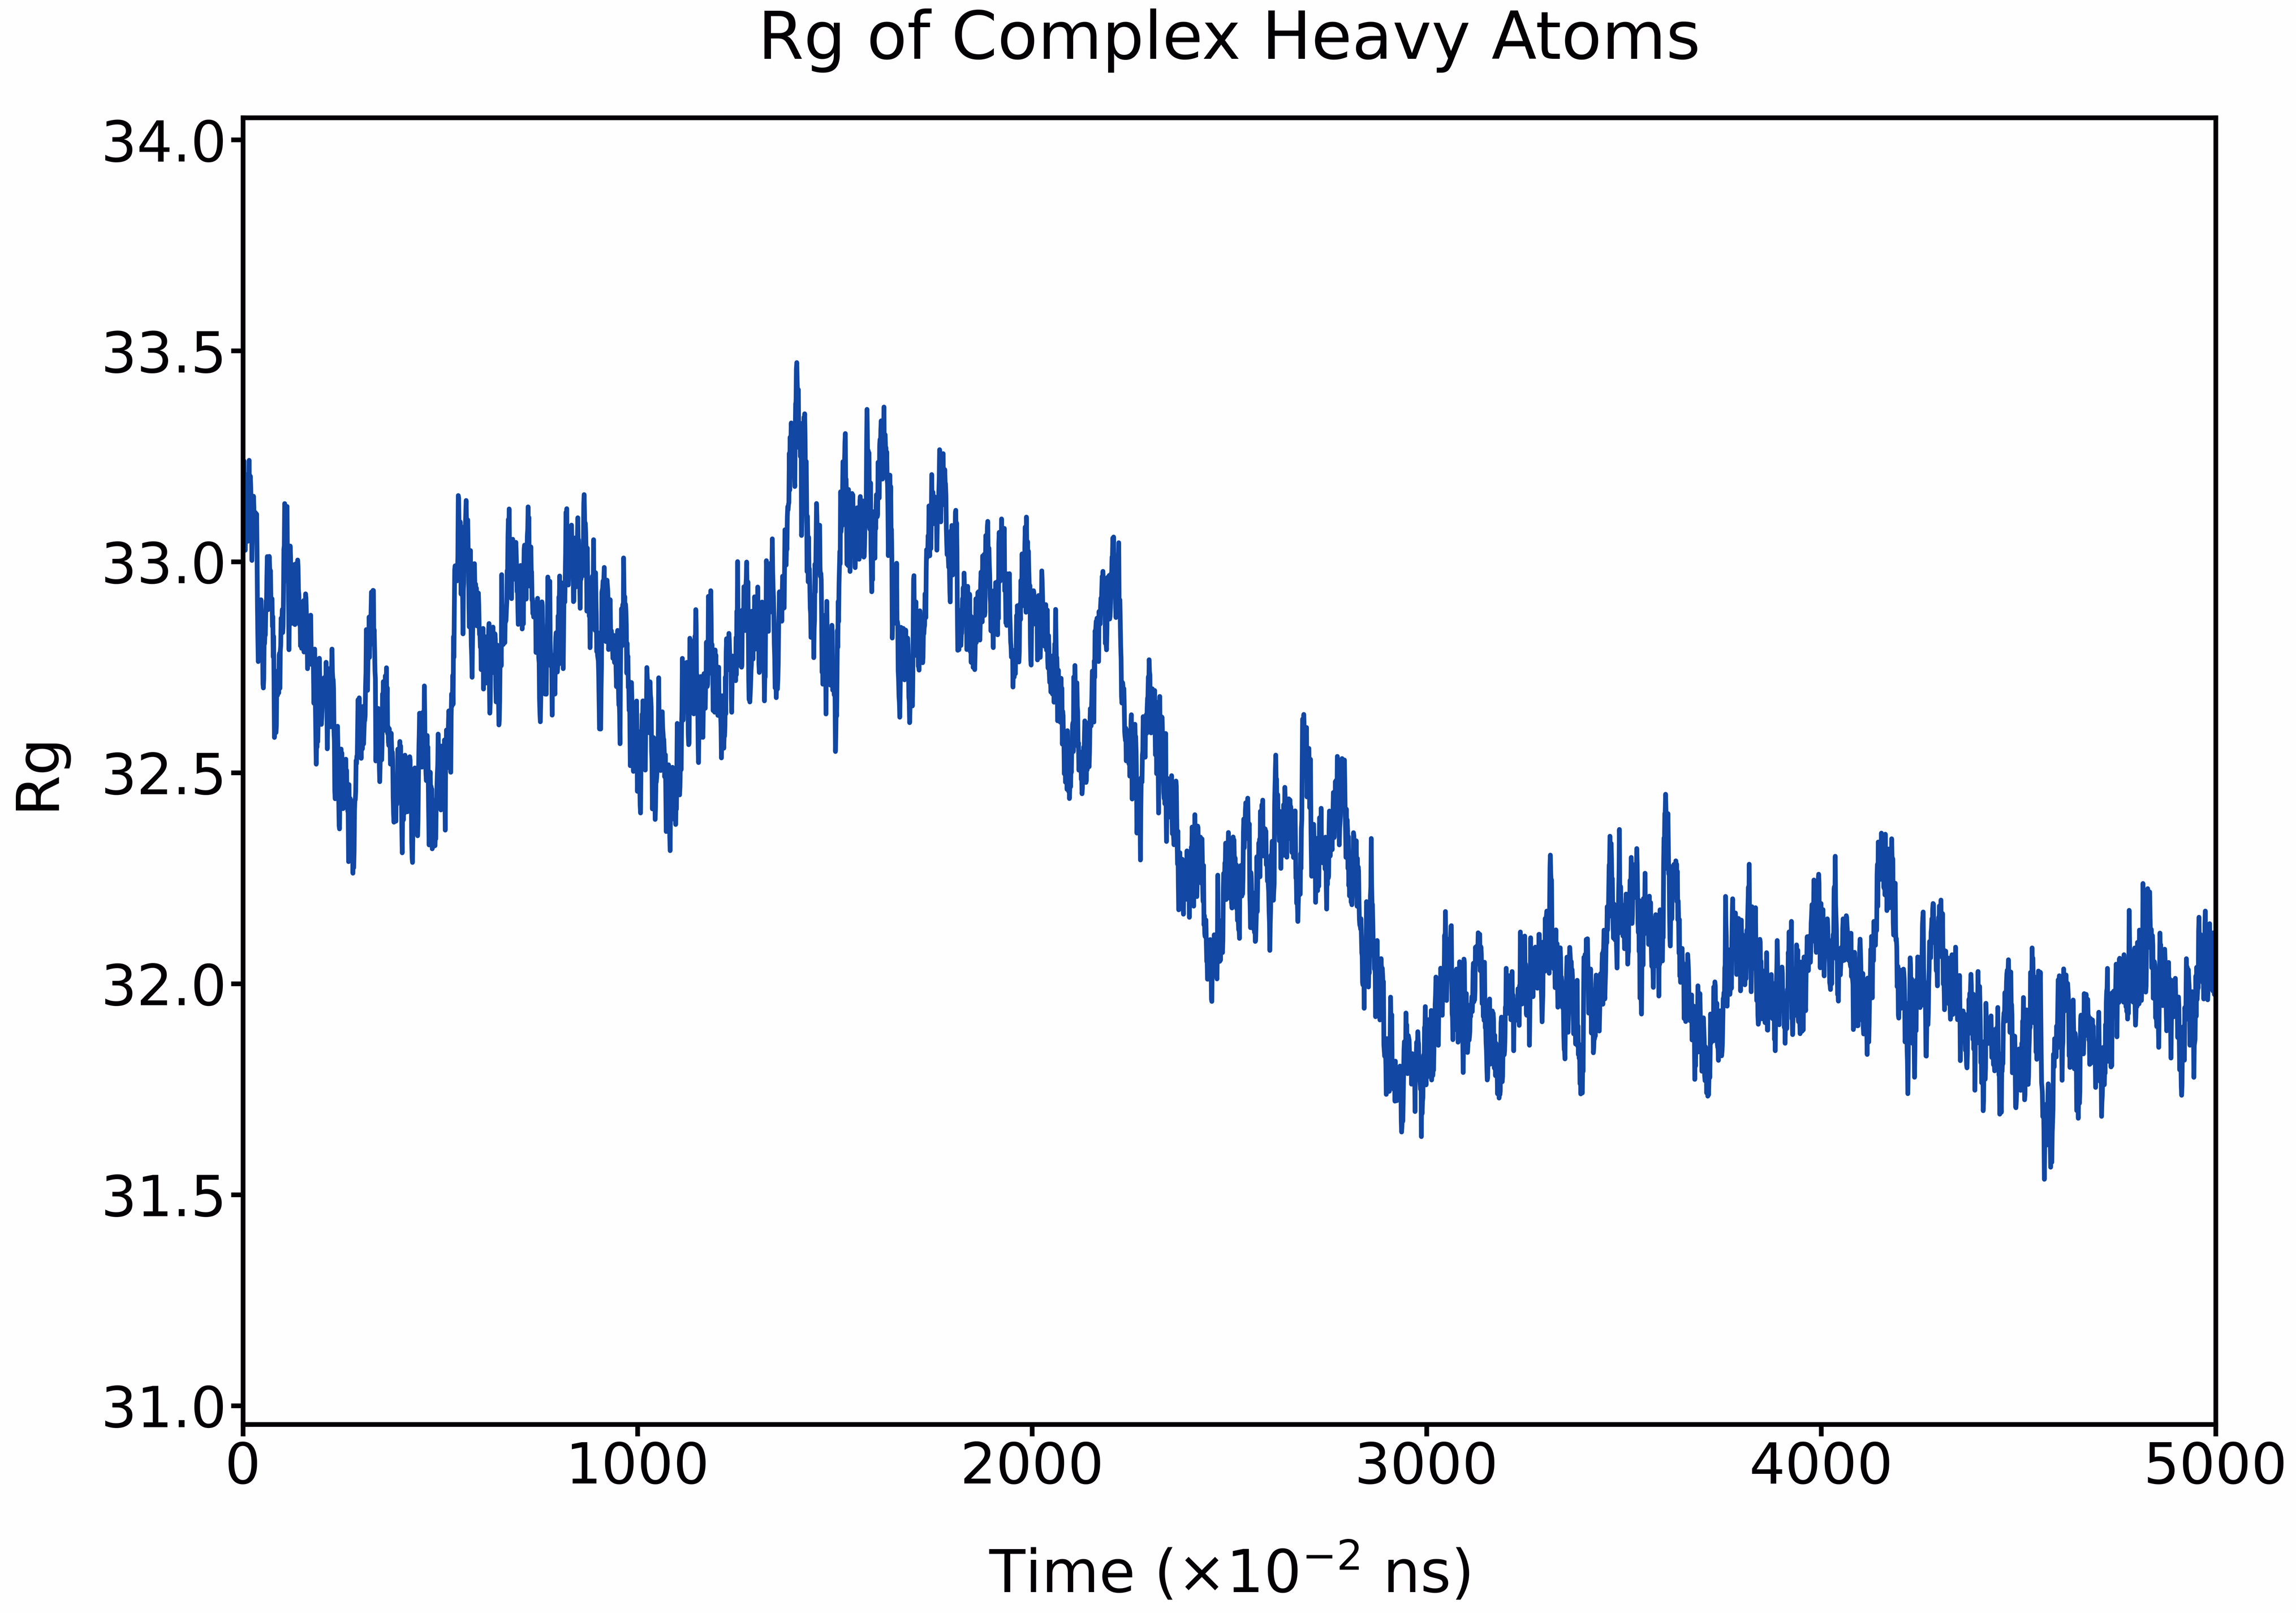
The Rg fluctuates around ~33 Å in the early stage and gradually stabilizes to ~32 Å, indicating a slight compaction of the molecular structure over the course of the trajectory.
Fig. 19 Time evolution of the radius of gyration (Rg) of complex heavy atoms during the MD simulation.
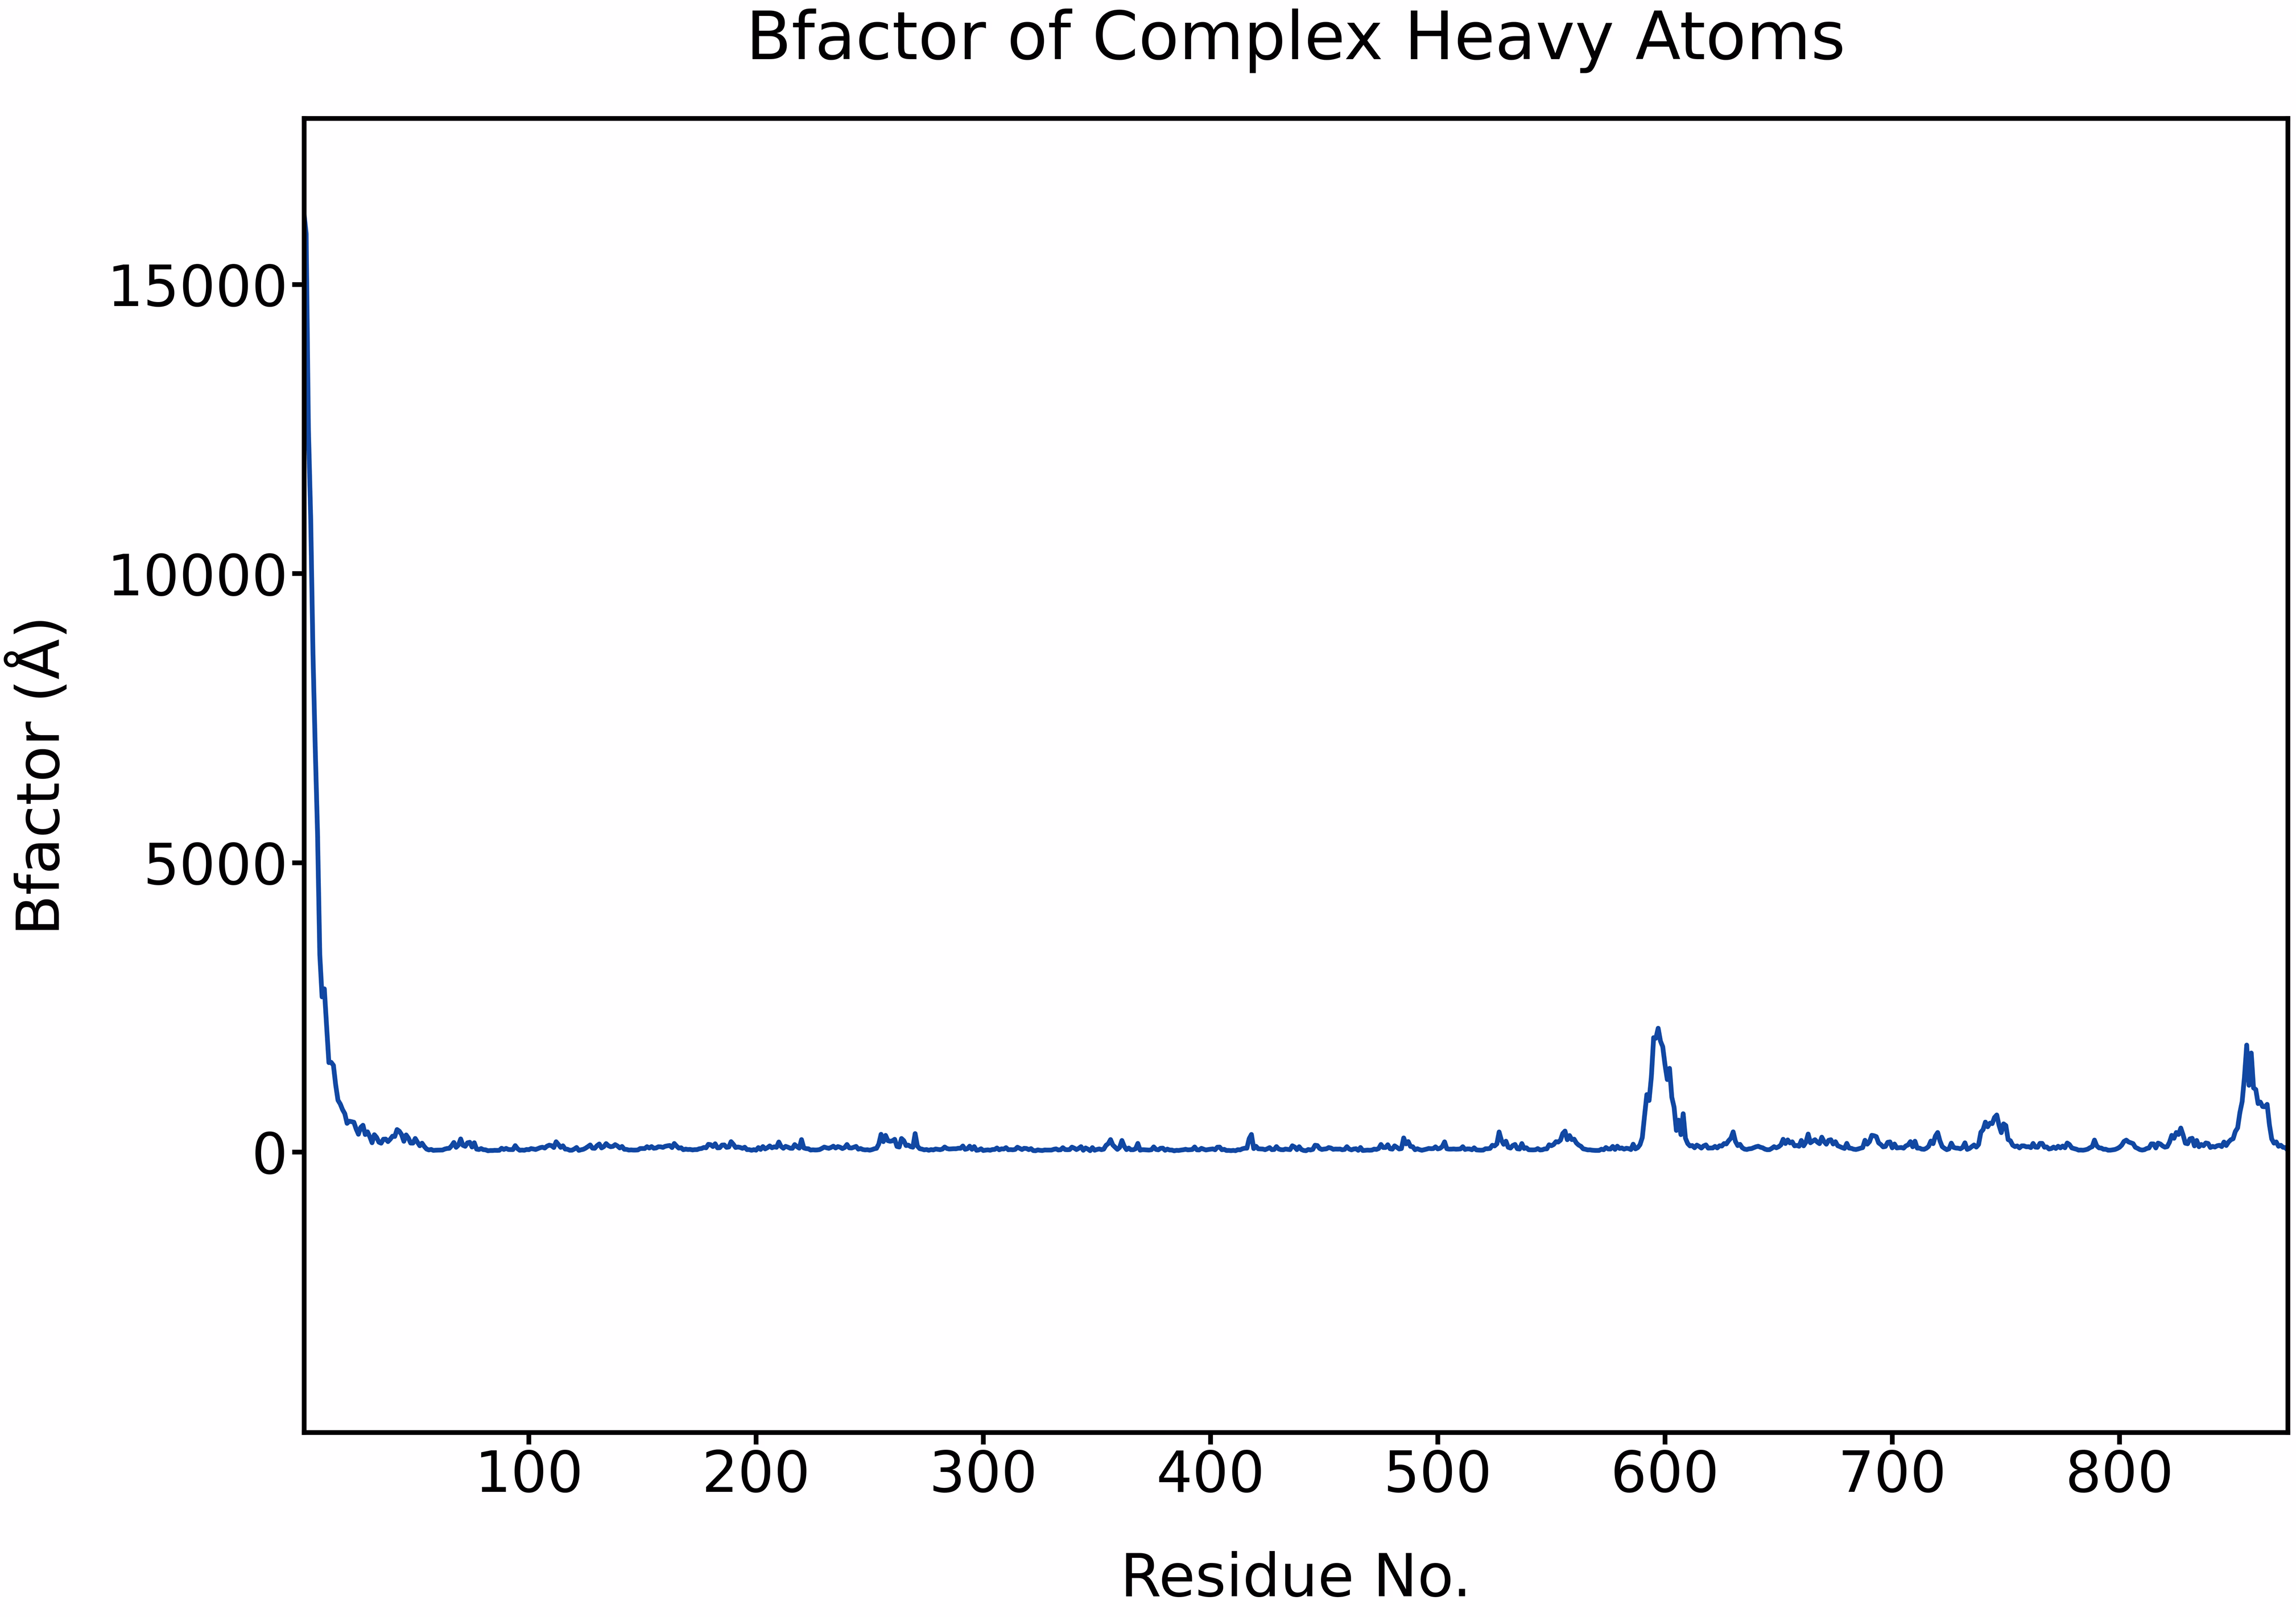
Analyzing B-factor, which is closely related to RMSF, we found that a sharp peak appears at the N-terminal region, likely due to high flexibility or incomplete stabilization, while additional moderate peaks near residues ~600 and ~840 indicate localized flexible segments. The majority of the residues exhibit low B-factors, suggesting overall structural stability.
Fig. 20 Per-residue B-factor of complex heavy atoms calculated from the MD trajectory.
It can be confirmed that the binding model of COI1 with JAZ, and model of nPPVp and cPPVp are consistent with the reference structures. After optimization and equilibration through molecular dynamics simulations, the complexes remain stably bound, supporting the intended functional role of the fused protein complex in our design.
Conclusion
The MD approach provides mechanistic insight into the regulation of our synthetic pathway and establishes a framework for both rational design and future experimental validation. We assessed the binding affinity of CC-domains, the interaction between AvrRpt2 and Rin4, and stability of merged protein complex, which all yielded encouraging results. Although the computational tools and methods have inherent limitations and the absolute energy values should be interpreted with caution, the findings may still offer useful indications of protein conformational features and their underlying energetic landscape.
More files and detailed instructions can be found on the igem gitLab.
Reference
Abraham, M. J., Murtola, T., Schulz, R., Páll, S., Smith, J. C., Hess, B., & Lindahl, E. (2015). GROMACS: High performance molecular simulations through multi-level parallelism from laptops to supercomputers. SoftwareX, 1–2, 19–25. ↩
J. D., Demitri, N., Wuerges, J., & Benini, S., Crystal structure of the type III effector protein AvrRpt2 from Erwinia amylovora, a C70 family cysteine protease (2019) ↩
Bartho, J. D., Demitri, N., Bellini, D., Flachowsky, H., Peil, A., Walsh, M. A., & Benini, S. (2019). The structure of Erwinia amylovora AvrRpt2 provides insight into protein maturation and induced resistance to fire blight by Malus × robusta 5. Journal of Structural Biology, 206(2), 233–242. ↩
Fleming, J., Magana, P., Nair, S., Tsenkov, M., Bertoni, D., Pidruchna, I., Querino Lima Afonso, M., Midlik, A., Paramval, U., Žídek, A., Laydon, A., Kovalevskiy, O., Pan, J., Cheng, J., Avsec, Ž., Bycroft, C., Wong, L. H., Last, M., Mirdita, M., Steinegger, M., … Velankar, S. (2025). AlphaFold Protein Structure Database and 3D-Beacons: New data and capabilities. Journal of Molecular Biology, 437(15), 168967. ↩
Kim, D. E., Chivian, D., & Baker, D. (2004). Protein structure prediction and analysis using the Robetta server. Nucleic Acids Research, 32, W526–W531. ↩
Honorato, R. V., Trellet, M. E., Jiménez-García, B., Schaarschmidt, J. J., Giulini, M., Reys, V., Koukos, P. I., Rodrigues, J. P. G. L. M., Karaca, E., van Zundert, G. C. P., Roel-Touris, J., van Noort, C. W., Jandová, Z., Melquiond, A. S. J., & Bonvin, A. M. J. J. (2024). The HADDOCK2.4 web server for integrative modeling of biomolecular complexes. Nature Protocols, 19, 3219–3241. ↩
Valdés-Tresanco, M. S., Valdés-Tresanco, M. E., Valiente, P. A., & Moreno, E. (2021). gmx_MMPBSA: A new tool to perform end-state free energy calculations with GROMACS. Journal of Chemical Theory and Computation, 17 (10), 6281–6291. ↩
HEADER
TITLE MDANALYSIS FRAME 0: Created by PDBWriter
REMARK GENERATED BY TRJCONV
REMARK THIS IS A SIMULATION BOX
CRYST1 96.573 96.573 96.572 60.00 60.00 90.00 P 1 1
ATOM 1 N GLY A 72 79.220 70.460 53.770 1.00 0.25 A N
ATOM 2 H1 GLY A 72 79.270 71.470 53.730 1.00 0.25 A H
ATOM 3 H2 GLY A 72 78.510 70.260 54.470 1.00 0.25 A H
ATOM 4 H3 GLY A 72 80.080 70.010 54.040 1.00 0.25 A H
ATOM 5 CA GLY A 72 78.870 70.000 52.450 1.00 0.25 A C
ATOM 6 HA1 GLY A 72 79.140 68.940 52.440 1.00 0.25 A H
ATOM 7 HA2 GLY A 72 79.390 70.550 51.660 1.00 0.25 A H
ATOM 8 C GLY A 72 77.400 70.030 52.240 1.00 0.25 A C
ATOM 9 O GLY A 72 76.760 70.310 53.220 1.00 0.25 A O
ATOM 10 N TRP A 73 76.870 69.740 51.060 1.00 0.18 A N
ATOM 11 H TRP A 73 77.490 69.440 50.310 1.00 0.18 A H
ATOM 12 CA TRP A 73 75.440 69.530 50.750 1.00 0.18 A C
ATOM 13 HA TRP A 73 74.830 70.440 50.780 1.00 0.18 A H
ATOM 14 CB TRP A 73 75.360 68.930 49.310 1.00 0.18 A C
ATOM 15 HB1 TRP A 73 76.010 68.070 49.250 1.00 0.18 A H
ATOM 16 HB2 TRP A 73 75.810 69.630 48.620 1.00 0.18 A H
ATOM 17 CG TRP A 73 73.960 68.550 48.770 1.00 0.18 A C
ATOM 18 CD1 TRP A 73 73.410 67.330 48.670 1.00 0.18 A C
ATOM 19 HD1 TRP A 73 73.930 66.410 48.870 1.00 0.18 A H
ATOM 20 NE1 TRP A 73 72.090 67.320 48.330 1.00 0.18 A N
ATOM 21 HE1 TRP A 73 71.560 66.460 48.330 1.00 0.18 A H
ATOM 22 CE2 TRP A 73 71.690 68.630 47.960 1.00 0.18 A C
ATOM 23 CZ2 TRP A 73 70.520 69.270 47.400 1.00 0.18 A C
ATOM 24 HZ2 TRP A 73 69.620 68.710 47.200 1.00 0.18 A H
ATOM 25 CH2 TRP A 73 70.500 70.630 47.050 1.00 0.18 A C
ATOM 26 HH2 TRP A 73 69.640 71.110 46.620 1.00 0.18 A H
ATOM 27 CZ3 TRP A 73 71.590 71.400 47.470 1.00 0.18 A C
ATOM 28 HZ3 TRP A 73 71.600 72.480 47.400 1.00 0.18 A H
ATOM 29 CE3 TRP A 73 72.740 70.770 48.060 1.00 0.18 A C
ATOM 30 HE3 TRP A 73 73.550 71.420 48.360 1.00 0.18 A H
ATOM 31 CD2 TRP A 73 72.840 69.430 48.320 1.00 0.18 A C
ATOM 32 C TRP A 73 74.800 68.580 51.740 1.00 0.18 A C
ATOM 33 O TRP A 73 75.390 67.470 51.980 1.00 0.18 A O
ATOM 34 N PHE A 74 73.550 68.810 52.160 1.00 0.25 A N
ATOM 35 H PHE A 74 73.180 69.690 51.810 1.00 0.25 A H
ATOM 36 CA PHE A 74 72.770 67.830 52.940 1.00 0.25 A C
ATOM 37 HA PHE A 74 73.490 67.110 53.340 1.00 0.25 A H
ATOM 38 CB PHE A 74 72.230 68.420 54.230 1.00 0.25 A C
ATOM 39 HB1 PHE A 74 73.030 68.910 54.780 1.00 0.25 A H
ATOM 40 HB2 PHE A 74 71.870 67.550 54.770 1.00 0.25 A H
ATOM 41 CG PHE A 74 71.030 69.410 54.150 1.00 0.25 A C
ATOM 42 CD1 PHE A 74 71.340 70.750 54.230 1.00 0.25 A C
ATOM 43 HD1 PHE A 74 72.350 71.080 54.460 1.00 0.25 A H
ATOM 44 CE1 PHE A 74 70.390 71.710 53.830 1.00 0.25 A C
ATOM 45 HE1 PHE A 74 70.670 72.750 53.720 1.00 0.25 A H
ATOM 46 CZ PHE A 74 69.120 71.290 53.600 1.00 0.25 A C
ATOM 47 HZ PHE A 74 68.390 72.070 53.380 1.00 0.25 A H
ATOM 48 CE2 PHE A 74 68.750 69.940 53.790 1.00 0.25 A C
ATOM 49 HE2 PHE A 74 67.730 69.690 53.550 1.00 0.25 A H
ATOM 50 CD2 PHE A 74 69.730 68.980 53.930 1.00 0.25 A C
ATOM 51 HD2 PHE A 74 69.500 67.930 53.890 1.00 0.25 A H
ATOM 52 C PHE A 74 71.730 66.980 52.110 1.00 0.25 A C
ATOM 53 O PHE A 74 71.110 67.500 51.180 1.00 0.25 A O
ATOM 54 N LYS A 75 71.630 65.710 52.470 1.00 0.29 A N
ATOM 55 H LYS A 75 71.980 65.420 53.360 1.00 0.29 A H
ATOM 56 CA LYS A 75 70.850 64.750 51.700 1.00 0.29 A C
ATOM 57 HA LYS A 75 70.980 64.990 50.640 1.00 0.29 A H
ATOM 58 CB LYS A 75 71.390 63.330 51.910 1.00 0.29 A C
ATOM 59 HB1 LYS A 75 71.060 62.910 52.860 1.00 0.29 A H
ATOM 60 HB2 LYS A 75 72.470 63.220 51.870 1.00 0.29 A H
ATOM 61 CG LYS A 75 70.930 62.410 50.840 1.00 0.29 A C
ATOM 62 HG1 LYS A 75 71.350 62.680 49.890 1.00 0.29 A H
ATOM 63 HG2 LYS A 75 69.840 62.450 50.710 1.00 0.29 A H
ATOM 64 CD LYS A 75 71.280 60.950 51.160 1.00 0.29 A C
ATOM 65 HD1 LYS A 75 71.110 60.750 52.220 1.00 0.29 A H
ATOM 66 HD2 LYS A 75 72.330 60.780 50.930 1.00 0.29 A H
ATOM 67 CE LYS A 75 70.500 59.940 50.290 1.00 0.29 A C
ATOM 68 HE1 LYS A 75 70.850 60.130 49.280 1.00 0.29 A H
ATOM 69 HE2 LYS A 75 69.430 60.110 50.400 1.00 0.29 A H
ATOM 70 NZ LYS A 75 70.930 58.490 50.680 1.00 0.29 A N
ATOM 71 HZ1 LYS A 75 70.710 58.260 51.650 1.00 0.29 A H
ATOM 72 HZ2 LYS A 75 70.390 57.830 50.120 1.00 0.29 A H
ATOM 73 HZ3 LYS A 75 71.900 58.350 50.460 1.00 0.29 A H
ATOM 74 C LYS A 75 69.350 65.080 51.970 1.00 0.29 A C
ATOM 75 O LYS A 75 69.080 65.200 53.140 1.00 0.29 A O
ATOM 76 N LYS A 76 68.520 65.300 50.940 1.00 0.23 A N
ATOM 77 H LYS A 76 68.890 65.170 50.000 1.00 0.23 A H
ATOM 78 CA LYS A 76 67.160 65.780 51.000 1.00 0.23 A C
ATOM 79 HA LYS A 76 66.800 65.420 51.970 1.00 0.23 A H
ATOM 80 CB LYS A 76 67.150 67.330 50.920 1.00 0.23 A C
ATOM 81 HB1 LYS A 76 67.660 67.740 51.790 1.00 0.23 A H
ATOM 82 HB2 LYS A 76 66.080 67.520 51.030 1.00 0.23 A H
ATOM 83 CG LYS A 76 67.650 67.880 49.510 1.00 0.23 A C
ATOM 84 HG1 LYS A 76 67.050 67.470 48.690 1.00 0.23 A H
ATOM 85 HG2 LYS A 76 68.680 67.560 49.370 1.00 0.23 A H
ATOM 86 CD LYS A 76 67.540 69.390 49.380 1.00 0.23 A C
ATOM 87 HD1 LYS A 76 66.500 69.600 49.590 1.00 0.23 A H
ATOM 88 HD2 LYS A 76 67.760 69.800 48.390 1.00 0.23 A H
ATOM 89 CE LYS A 76 68.410 70.080 50.430 1.00 0.23 A C
ATOM 90 HE1 LYS A 76 67.940 69.890 51.410 1.00 0.23 A H
ATOM 91 HE2 LYS A 76 68.310 71.130 50.170 1.00 0.23 A H
ATOM 92 NZ LYS A 76 69.910 69.890 50.310 1.00 0.23 A N
ATOM 93 HZ1 LYS A 76 70.440 70.310 51.070 1.00 0.23 A H
ATOM 94 HZ2 LYS A 76 70.090 68.890 50.330 1.00 0.23 A H
ATOM 95 HZ3 LYS A 76 70.170 70.290 49.430 1.00 0.23 A H
ATOM 96 C LYS A 76 66.210 65.170 49.990 1.00 0.23 A C
ATOM 97 O LYS A 76 66.650 64.570 49.030 1.00 0.23 A O
ATOM 98 N LYS A 77 64.860 65.280 50.210 1.00 0.29 A N
ATOM 99 H LYS A 77 64.590 65.500 51.150 1.00 0.29 A H
ATOM 100 CA LYS A 77 63.820 65.210 49.140 1.00 0.29 A C
ATOM 101 HA LYS A 77 64.120 64.410 48.470 1.00 0.29 A H
ATOM 102 CB LYS A 77 62.400 64.970 49.610 1.00 0.29 A C
ATOM 103 HB1 LYS A 77 62.440 64.090 50.260 1.00 0.29 A H
ATOM 104 HB2 LYS A 77 61.730 64.750 48.770 1.00 0.29 A H
ATOM 105 CG LYS A 77 61.770 66.200 50.310 1.00 0.29 A C
ATOM 106 HG1 LYS A 77 61.670 66.950 49.520 1.00 0.29 A H
ATOM 107 HG2 LYS A 77 62.440 66.640 51.050 1.00 0.29 A H
ATOM 108 CD LYS A 77 60.530 65.820 50.990 1.00 0.29 A C
ATOM 109 HD1 LYS A 77 60.640 64.790 51.350 1.00 0.29 A H
ATOM 110 HD2 LYS A 77 59.780 65.710 50.200 1.00 0.29 A H
ATOM 111 CE LYS A 77 59.990 66.810 51.990 1.00 0.29 A C
ATOM 112 HE1 LYS A 77 60.540 66.750 52.920 1.00 0.29 A H
ATOM 113 HE2 LYS A 77 58.940 66.670 52.280 1.00 0.29 A H
ATOM 114 NZ LYS A 77 59.990 68.180 51.380 1.00 0.29 A N
ATOM 115 HZ1 LYS A 77 60.390 68.190 50.460 1.00 0.29 A H
ATOM 116 HZ2 LYS A 77 59.060 68.570 51.430 1.00 0.29 A H
ATOM 117 HZ3 LYS A 77 60.560 68.740 52.000 1.00 0.29 A H
ATOM 118 C LYS A 77 63.990 66.490 48.220 1.00 0.29 A C
ATOM 119 O LYS A 77 64.260 67.560 48.660 1.00 0.29 A O
ATOM 120 N SER A 78 63.700 66.340 46.920 1.00 0.35 A N
ATOM 121 H SER A 78 63.610 65.370 46.660 1.00 0.35 A H
ATOM 122 CA SER A 78 63.640 67.340 45.860 1.00 0.35 A C
ATOM 123 HA SER A 78 63.220 68.270 46.260 1.00 0.35 A H
ATOM 124 CB SER A 78 65.030 67.620 45.200 1.00 0.35 A C
ATOM 125 HB1 SER A 78 64.920 68.510 44.580 1.00 0.35 A H
ATOM 126 HB2 SER A 78 65.290 66.800 44.530 1.00 0.35 A H
ATOM 127 OG SER A 78 66.120 67.880 46.140 1.00 0.35 A O
ATOM 128 HG SER A 78 66.570 67.040 46.270 1.00 0.35 A H
ATOM 129 C SER A 78 62.630 66.860 44.820 1.00 0.35 A C
ATOM 130 O SER A 78 62.300 65.710 44.820 1.00 0.35 A O
ATOM 131 N SER A 79 62.200 67.810 43.910 1.00 0.40 A N
ATOM 132 H SER A 79 62.450 68.780 43.990 1.00 0.40 A H
ATOM 133 CA SER A 79 61.030 67.590 43.070 1.00 0.40 A C
ATOM 134 HA SER A 79 60.240 67.010 43.550 1.00 0.40 A H
ATOM 135 CB SER A 79 61.620 66.930 41.840 1.00 0.40 A C
ATOM 136 HB1 SER A 79 62.350 66.160 42.030 1.00 0.40 A H
ATOM 137 HB2 SER A 79 62.100 67.690 41.230 1.00 0.40 A H
ATOM 138 OG SER A 79 60.590 66.470 41.000 1.00 0.40 A O
ATOM 139 HG SER A 79 60.850 65.660 40.540 1.00 0.40 A H
ATOM 140 C SER A 79 60.170 68.760 42.650 1.00 0.40 A C
ATOM 141 O SER A 79 60.660 69.880 42.820 1.00 0.40 A O
ATOM 142 N LYS A 80 58.910 68.580 42.230 1.00 0.51 A N
ATOM 143 H LYS A 80 58.710 67.640 41.900 1.00 0.51 A H
ATOM 144 CA LYS A 80 57.940 69.620 41.940 1.00 0.51 A C
ATOM 145 HA LYS A 80 58.510 70.500 41.620 1.00 0.51 A H
ATOM 146 CB LYS A 80 56.940 69.220 40.880 1.00 0.51 A C
ATOM 147 HB1 LYS A 80 56.360 70.130 40.740 1.00 0.51 A H
ATOM 148 HB2 LYS A 80 56.340 68.430 41.330 1.00 0.51 A H
ATOM 149 CG LYS A 80 57.570 68.810 39.450 1.00 0.51 A C
ATOM 150 HG1 LYS A 80 58.450 68.210 39.630 1.00 0.51 A H
ATOM 151 HG2 LYS A 80 57.970 69.630 38.840 1.00 0.51 A H
ATOM 152 CD LYS A 80 56.500 68.140 38.590 1.00 0.51 A C
ATOM 153 HD1 LYS A 80 56.170 67.310 39.240 1.00 0.51 A H
ATOM 154 HD2 LYS A 80 57.120 67.820 37.760 1.00 0.51 A H
ATOM 155 CE LYS A 80 55.360 69.010 38.070 1.00 0.51 A C
ATOM 156 HE1 LYS A 80 55.740 69.950 37.710 1.00 0.51 A H
ATOM 157 HE2 LYS A 80 54.750 69.140 38.950 1.00 0.51 A H
ATOM 158 NZ LYS A 80 54.380 68.340 37.100 1.00 0.51 A N
ATOM 159 HZ1 LYS A 80 53.640 68.970 36.850 1.00 0.51 A H
ATOM 160 HZ2 LYS A 80 54.830 68.090 36.230 1.00 0.51 A H
ATOM 161 HZ3 LYS A 80 54.050 67.420 37.370 1.00 0.51 A H
ATOM 162 C LYS A 80 57.180 70.100 43.190 1.00 0.51 A C
ATOM 163 O LYS A 80 57.160 69.420 44.200 1.00 0.51 A O
ATOM 164 N HIS A 81 56.580 71.290 43.040 1.00 0.56 A N
ATOM 165 H HIS A 81 56.630 71.700 42.120 1.00 0.56 A H
ATOM 166 CA HIS A 81 55.870 71.970 44.110 1.00 0.56 A C
ATOM 167 HA HIS A 81 56.640 72.230 44.840 1.00 0.56 A H
ATOM 168 CB HIS A 81 55.280 73.180 43.420 1.00 0.56 A C
ATOM 169 HB1 HIS A 81 54.440 72.800 42.840 1.00 0.56 A H
ATOM 170 HB2 HIS A 81 55.940 73.680 42.720 1.00 0.56 A H
ATOM 171 CG HIS A 81 54.810 74.210 44.390 1.00 0.56 A C
ATOM 172 ND1 HIS A 81 54.730 74.050 45.800 1.00 0.56 A N
ATOM 173 CE1 HIS A 81 54.210 75.180 46.300 1.00 0.56 A C
ATOM 174 HE1 HIS A 81 54.040 75.430 47.340 1.00 0.56 A H
ATOM 175 NE2 HIS A 81 54.020 76.000 45.300 1.00 0.56 A N
ATOM 176 HE2 HIS A 81 53.650 76.930 45.180 1.00 0.56 A H
ATOM 177 CD2 HIS A 81 54.390 75.400 44.150 1.00 0.56 A C
ATOM 178 HD2 HIS A 81 54.280 75.810 43.160 1.00 0.56 A H
ATOM 179 C HIS A 81 54.690 71.160 44.690 1.00 0.56 A C
ATOM 180 O HIS A 81 53.850 70.710 43.990 1.00 0.56 A O
ATOM 181 N GLU A 82 54.690 71.030 46.020 1.00 0.47 A N
ATOM 182 H GLU A 82 55.470 71.460 46.480 1.00 0.47 A H
ATOM 183 CA GLU A 82 53.840 70.040 46.780 1.00 0.47 A C
ATOM 184 HA GLU A 82 53.150 69.660 46.020 1.00 0.47 A H
ATOM 185 CB GLU A 82 53.040 70.790 47.890 1.00 0.47 A C
ATOM 186 HB1 GLU A 82 52.330 70.100 48.350 1.00 0.47 A H
ATOM 187 HB2 GLU A 82 52.490 71.600 47.400 1.00 0.47 A H
ATOM 188 CG GLU A 82 53.970 71.330 49.000 1.00 0.47 A C
ATOM 189 HG1 GLU A 82 54.490 72.120 48.470 1.00 0.47 A H
ATOM 190 HG2 GLU A 82 54.680 70.630 49.420 1.00 0.47 A H
ATOM 191 CD GLU A 82 53.220 72.020 50.100 1.00 0.47 A C
ATOM 192 OE1 GLU A 82 53.340 73.260 50.240 1.00 0.47 A O
ATOM 193 OE2 GLU A 82 52.570 71.360 50.910 1.00 0.47 A O
ATOM 194 C GLU A 82 54.730 68.890 47.320 1.00 0.47 A C
ATOM 195 O GLU A 82 54.210 68.050 48.040 1.00 0.47 A O
ATOM 196 N THR A 83 56.040 68.740 46.950 1.00 0.40 A N
ATOM 197 H THR A 83 56.380 69.460 46.330 1.00 0.40 A H
ATOM 198 CA THR A 83 57.120 67.740 47.440 1.00 0.40 A C
ATOM 199 HA THR A 83 56.830 67.400 48.430 1.00 0.40 A H
ATOM 200 CB THR A 83 57.130 66.600 46.490 1.00 0.40 A C
ATOM 201 HB THR A 83 57.440 67.020 45.540 1.00 0.40 A H
ATOM 202 CG2 THR A 83 58.000 65.370 46.850 1.00 0.40 A C
ATOM 203 HG21 THR A 83 57.620 64.990 47.790 1.00 0.40 A H
ATOM 204 HG22 THR A 83 57.970 64.630 46.050 1.00 0.40 A H
ATOM 205 HG23 THR A 83 59.060 65.600 46.960 1.00 0.40 A H
ATOM 206 OG1 THR A 83 55.890 66.030 46.280 1.00 0.40 A O
ATOM 207 HG1 THR A 83 55.650 66.450 45.460 1.00 0.40 A H
ATOM 208 C THR A 83 58.530 68.300 47.490 1.00 0.40 A C
ATOM 209 O THR A 83 59.320 67.970 48.370 1.00 0.40 A O
ATOM 210 N GLY A 84 59.000 69.040 46.460 1.00 0.38 A N
ATOM 211 H GLY A 84 58.320 69.070 45.700 1.00 0.38 A H
ATOM 212 CA GLY A 84 60.390 69.660 46.310 1.00 0.38 A C
ATOM 213 HA1 GLY A 84 60.550 70.090 45.320 1.00 0.38 A H
ATOM 214 HA2 GLY A 84 61.110 68.860 46.470 1.00 0.38 A H
ATOM 215 C GLY A 84 60.760 70.780 47.280 1.00 0.38 A C
ATOM 216 O GLY A 84 59.860 71.310 47.920 1.00 0.38 A O
ATOM 217 N GLY A 85 62.040 71.230 47.180 1.00 0.39 A N
ATOM 218 H GLY A 85 62.550 70.810 46.420 1.00 0.39 A H
ATOM 219 CA GLY A 85 62.650 72.490 47.750 1.00 0.39 A C
ATOM 220 HA1 GLY A 85 63.560 72.830 47.260 1.00 0.39 A H
ATOM 221 HA2 GLY A 85 62.920 72.200 48.760 1.00 0.39 A H
ATOM 222 C GLY A 85 61.770 73.730 47.830 1.00 0.39 A C
ATOM 223 O GLY A 85 61.160 74.070 46.820 1.00 0.39 A O
ATOM 224 N SER A 86 61.610 74.380 48.960 1.00 0.40 A N
ATOM 225 H SER A 86 62.150 73.990 49.720 1.00 0.40 A H
ATOM 226 CA SER A 86 60.780 75.530 49.280 1.00 0.40 A C
ATOM 227 HA SER A 86 59.800 75.360 48.830 1.00 0.40 A H
ATOM 228 CB SER A 86 60.560 75.630 50.820 1.00 0.40 A C
ATOM 229 HB1 SER A 86 60.140 74.730 51.250 1.00 0.40 A H
ATOM 230 HB2 SER A 86 59.910 76.460 51.040 1.00 0.40 A H
ATOM 231 OG SER A 86 61.790 75.960 51.360 1.00 0.40 A O
ATOM 232 HG SER A 86 61.580 76.520 52.120 1.00 0.40 A H
ATOM 233 C SER A 86 61.290 76.910 48.750 1.00 0.40 A C
ATOM 234 O SER A 86 60.410 77.770 48.500 1.00 0.40 A O
ATOM 235 N SER A 87 62.590 77.100 48.550 1.00 0.24 A N
ATOM 236 H SER A 87 63.190 76.280 48.610 1.00 0.24 A H
ATOM 237 CA SER A 87 63.220 78.420 48.260 1.00 0.24 A C
ATOM 238 HA SER A 87 62.510 79.130 48.680 1.00 0.24 A H
ATOM 239 CB SER A 87 64.530 78.640 49.030 1.00 0.24 A C
ATOM 240 HB1 SER A 87 64.980 79.620 48.920 1.00 0.24 A H
ATOM 241 HB2 SER A 87 65.230 77.890 48.670 1.00 0.24 A H
ATOM 242 OG SER A 87 64.290 78.470 50.320 1.00 0.24 A O
ATOM 243 HG SER A 87 65.020 78.000 50.740 1.00 0.24 A H
ATOM 244 C SER A 87 63.410 78.740 46.810 1.00 0.24 A C
ATOM 245 O SER A 87 63.860 77.980 46.000 1.00 0.24 A O
ATOM 246 N ALA A 88 62.960 80.000 46.530 1.00 0.17 A N
ATOM 247 H ALA A 88 62.670 80.570 47.300 1.00 0.17 A H
ATOM 248 CA ALA A 88 63.200 80.660 45.190 1.00 0.17 A C
ATOM 249 HA ALA A 88 62.480 81.470 45.250 1.00 0.17 A H
ATOM 250 CB ALA A 88 64.570 81.260 45.060 1.00 0.17 A C
ATOM 251 HB1 ALA A 88 65.340 80.520 44.840 1.00 0.17 A H
ATOM 252 HB2 ALA A 88 64.620 82.090 44.350 1.00 0.17 A H
ATOM 253 HB3 ALA A 88 64.850 81.730 46.000 1.00 0.17 A H
ATOM 254 C ALA A 88 62.720 79.880 43.980 1.00 0.17 A C
ATOM 255 O ALA A 88 63.340 79.690 42.930 1.00 0.17 A O
ATOM 256 N ASN A 89 61.430 79.540 44.080 1.00 0.21 A N
ATOM 257 H ASN A 89 60.890 79.850 44.880 1.00 0.21 A H
ATOM 258 CA ASN A 89 60.720 79.080 42.940 1.00 0.21 A C
ATOM 259 HA ASN A 89 61.340 78.630 42.170 1.00 0.21 A H
ATOM 260 CB ASN A 89 59.750 77.970 43.480 1.00 0.21 A C
ATOM 261 HB1 ASN A 89 59.240 77.540 42.610 1.00 0.21 A H
ATOM 262 HB2 ASN A 89 58.960 78.410 44.090 1.00 0.21 A H
ATOM 263 CG ASN A 89 60.570 76.930 44.170 1.00 0.21 A C
ATOM 264 OD1 ASN A 89 61.400 76.210 43.580 1.00 0.21 A O
ATOM 265 ND2 ASN A 89 60.280 76.630 45.420 1.00 0.21 A N
ATOM 266 HD21 ASN A 89 59.730 77.250 46.010 1.00 0.21 A H
ATOM 267 HD22 ASN A 89 60.760 75.830 45.810 1.00 0.21 A H
ATOM 268 C ASN A 89 60.020 80.290 42.370 1.00 0.21 A C
ATOM 269 O ASN A 89 59.970 81.320 42.980 1.00 0.21 A O
ATOM 270 N ALA A 90 59.470 80.170 41.160 1.00 0.16 A N
ATOM 271 H ALA A 90 59.620 79.310 40.660 1.00 0.16 A H
ATOM 272 CA ALA A 90 58.830 81.370 40.500 1.00 0.16 A C
ATOM 273 HA ALA A 90 59.670 82.060 40.470 1.00 0.16 A H
ATOM 274 CB ALA A 90 58.320 80.890 39.130 1.00 0.16 A C
ATOM 275 HB1 ALA A 90 59.060 80.270 38.630 1.00 0.16 A H
ATOM 276 HB2 ALA A 90 57.440 80.240 39.150 1.00 0.16 A H
ATOM 277 HB3 ALA A 90 58.030 81.700 38.460 1.00 0.16 A H
ATOM 278 C ALA A 90 57.620 82.020 41.190 1.00 0.16 A C
ATOM 279 O ALA A 90 56.890 81.440 41.970 1.00 0.16 A O
ATOM 280 N ASP A 91 57.350 83.320 40.960 1.00 0.24 A N
ATOM 281 H ASP A 91 57.880 83.640 40.160 1.00 0.24 A H
ATOM 282 CA ASP A 91 56.100 83.970 41.270 1.00 0.24 A C
ATOM 283 HA ASP A 91 55.650 83.500 42.150 1.00 0.24 A H
ATOM 284 CB ASP A 91 56.380 85.430 41.660 1.00 0.24 A C
ATOM 285 HB1 ASP A 91 56.830 85.960 40.820 1.00 0.24 A H
ATOM 286 HB2 ASP A 91 57.080 85.380 42.490 1.00 0.24 A H
ATOM 287 CG ASP A 91 55.110 86.230 42.130 1.00 0.24 A C
ATOM 288 OD1 ASP A 91 55.090 87.450 41.960 1.00 0.24 A O
ATOM 289 OD2 ASP A 91 54.100 85.640 42.720 1.00 0.24 A O
ATOM 290 C ASP A 91 55.030 83.880 40.120 1.00 0.24 A C
ATOM 291 O ASP A 91 55.270 84.250 38.970 1.00 0.24 A O
ATOM 292 N SER A 92 53.880 83.440 40.540 1.00 0.31 A N
ATOM 293 H SER A 92 53.890 83.020 41.470 1.00 0.31 A H
ATOM 294 CA SER A 92 52.680 83.390 39.770 1.00 0.31 A C
ATOM 295 HA SER A 92 53.130 83.330 38.790 1.00 0.31 A H
ATOM 296 CB SER A 92 51.880 82.070 39.840 1.00 0.31 A C
ATOM 297 HB1 SER A 92 51.400 81.860 38.890 1.00 0.31 A H
ATOM 298 HB2 SER A 92 51.210 82.260 40.680 1.00 0.31 A H
ATOM 299 OG SER A 92 52.750 80.970 40.090 1.00 0.31 A O
ATOM 300 HG SER A 92 52.270 80.160 39.910 1.00 0.31 A H
ATOM 301 C SER A 92 51.730 84.510 39.940 1.00 0.31 A C
ATOM 302 O SER A 92 50.690 84.570 39.280 1.00 0.31 A O
ATOM 303 N SER A 93 52.020 85.560 40.710 1.00 0.39 A N
ATOM 304 H SER A 93 52.910 85.510 41.210 1.00 0.39 A H
ATOM 305 CA SER A 93 51.140 86.730 41.030 1.00 0.39 A C
ATOM 306 HA SER A 93 50.240 86.520 40.460 1.00 0.39 A H
ATOM 307 CB SER A 93 50.830 86.890 42.520 1.00 0.39 A C
ATOM 308 HB1 SER A 93 50.490 85.890 42.790 1.00 0.39 A H
ATOM 309 HB2 SER A 93 50.090 87.650 42.760 1.00 0.39 A H
ATOM 310 OG SER A 93 52.030 87.190 43.140 1.00 0.39 A O
ATOM 311 HG SER A 93 52.690 86.560 42.820 1.00 0.39 A H
ATOM 312 C SER A 93 51.510 88.090 40.360 1.00 0.39 A C
ATOM 313 O SER A 93 50.930 89.070 40.780 1.00 0.39 A O
ATOM 314 N SER A 94 52.280 88.160 39.270 1.00 0.45 A N
ATOM 315 H SER A 94 52.660 87.340 38.850 1.00 0.45 A H
ATOM 316 CA SER A 94 52.600 89.360 38.460 1.00 0.45 A C
ATOM 317 HA SER A 94 52.920 90.150 39.140 1.00 0.45 A H
ATOM 318 CB SER A 94 53.900 88.990 37.690 1.00 0.45 A C
ATOM 319 HB1 SER A 94 54.490 89.880 37.450 1.00 0.45 A H
ATOM 320 HB2 SER A 94 53.650 88.450 36.780 1.00 0.45 A H
ATOM 321 OG SER A 94 54.780 88.140 38.500 1.00 0.45 A O
ATOM 322 HG SER A 94 54.980 88.520 39.350 1.00 0.45 A H
ATOM 323 C SER A 94 51.450 90.000 37.620 1.00 0.45 A C
ATOM 324 O SER A 94 51.440 89.930 36.400 1.00 0.45 A O
ATOM 325 N VAL A 95 50.440 90.510 38.230 1.00 0.50 A N
ATOM 326 H VAL A 95 50.420 90.470 39.240 1.00 0.50 A H
ATOM 327 CA VAL A 95 49.270 91.250 37.650 1.00 0.50 A C
ATOM 328 HA VAL A 95 48.850 90.520 36.960 1.00 0.50 A H
ATOM 329 CB VAL A 95 48.220 91.620 38.700 1.00 0.50 A C
ATOM 330 HB VAL A 95 47.610 92.440 38.310 1.00 0.50 A H
ATOM 331 CG1 VAL A 95 47.280 90.460 39.000 1.00 0.50 A C
ATOM 332 HG11 VAL A 95 47.860 89.630 39.390 1.00 0.50 A H
ATOM 333 HG12 VAL A 95 46.490 90.720 39.720 1.00 0.50 A H
ATOM 334 HG13 VAL A 95 46.770 90.010 38.140 1.00 0.50 A H
ATOM 335 CG2 VAL A 95 48.780 92.050 40.140 1.00 0.50 A C
ATOM 336 HG21 VAL A 95 49.190 91.230 40.710 1.00 0.50 A H
ATOM 337 HG22 VAL A 95 49.580 92.770 40.030 1.00 0.50 A H
ATOM 338 HG23 VAL A 95 47.990 92.670 40.570 1.00 0.50 A H
ATOM 339 C VAL A 95 49.690 92.400 36.680 1.00 0.50 A C
ATOM 340 O VAL A 95 49.180 92.490 35.570 1.00 0.50 A O
ATOM 341 N ALA A 96 50.840 93.130 36.940 1.00 0.55 A N
ATOM 342 H ALA A 96 51.240 93.050 37.860 1.00 0.55 A H
ATOM 343 CA ALA A 96 51.450 94.250 36.160 1.00 0.55 A C
ATOM 344 HA ALA A 96 50.640 94.790 35.670 1.00 0.55 A H
ATOM 345 CB ALA A 96 52.180 95.150 37.110 1.00 0.55 A C
ATOM 346 HB1 ALA A 96 52.640 95.970 36.560 1.00 0.55 A H
ATOM 347 HB2 ALA A 96 51.550 95.520 37.930 1.00 0.55 A H
ATOM 348 HB3 ALA A 96 52.930 94.640 37.710 1.00 0.55 A H
ATOM 349 C ALA A 96 52.510 93.830 35.080 1.00 0.55 A C
ATOM 350 O ALA A 96 52.880 94.590 34.210 1.00 0.55 A O
ATOM 351 N SER A 97 52.830 92.530 35.060 1.00 0.47 A N
ATOM 352 H SER A 97 52.360 91.830 35.610 1.00 0.47 A H
ATOM 353 CA SER A 97 53.750 92.100 34.050 1.00 0.47 A C
ATOM 354 HA SER A 97 54.410 92.800 33.540 1.00 0.47 A H
ATOM 355 CB SER A 97 54.620 91.030 34.570 1.00 0.47 A C
ATOM 356 HB1 SER A 97 55.290 90.680 33.800 1.00 0.47 A H
ATOM 357 HB2 SER A 97 53.990 90.200 34.880 1.00 0.47 A H
ATOM 358 OG SER A 97 55.390 91.480 35.690 1.00 0.47 A O
ATOM 359 HG SER A 97 56.140 90.890 35.700 1.00 0.47 A H
ATOM 360 C SER A 97 52.910 91.390 32.980 1.00 0.47 A C
ATOM 361 O SER A 97 51.800 90.940 33.250 1.00 0.47 A O
ATOM 362 N ASP A 98 53.420 91.420 31.730 1.00 0.47 A N
ATOM 363 H ASP A 98 54.300 91.880 31.550 1.00 0.47 A H
ATOM 364 CA ASP A 98 52.600 91.060 30.530 1.00 0.47 A C
ATOM 365 HA ASP A 98 51.880 90.320 30.880 1.00 0.47 A H
ATOM 366 CB ASP A 98 51.880 92.270 30.010 1.00 0.47 A C
ATOM 367 HB1 ASP A 98 51.090 92.410 30.740 1.00 0.47 A H
ATOM 368 HB2 ASP A 98 51.440 92.010 29.040 1.00 0.47 A H
ATOM 369 CG ASP A 98 52.750 93.510 29.880 1.00 0.47 A C
ATOM 370 OD1 ASP A 98 52.650 94.390 30.740 1.00 0.47 A O
ATOM 371 OD2 ASP A 98 53.630 93.580 29.020 1.00 0.47 A O
ATOM 372 C ASP A 98 53.310 90.350 29.350 1.00 0.47 A C
ATOM 373 O ASP A 98 54.510 90.440 29.310 1.00 0.47 A O
ATOM 374 N SER A 99 52.580 89.740 28.460 1.00 0.35 A N
ATOM 375 H SER A 99 51.600 89.650 28.680 1.00 0.35 A H
ATOM 376 CA SER A 99 53.090 89.120 27.250 1.00 0.35 A C
ATOM 377 HA SER A 99 54.050 88.630 27.460 1.00 0.35 A H
ATOM 378 CB SER A 99 52.220 87.940 26.830 1.00 0.35 A C
ATOM 379 HB1 SER A 99 52.580 87.590 25.870 1.00 0.35 A H
ATOM 380 HB2 SER A 99 51.160 88.190 26.640 1.00 0.35 A H
ATOM 381 OG SER A 99 52.280 86.830 27.610 1.00 0.35 A O
ATOM 382 HG SER A 99 51.630 86.830 28.320 1.00 0.35 A H
ATOM 383 C SER A 99 53.160 90.150 26.150 1.00 0.35 A C
ATOM 384 O SER A 99 53.360 89.660 25.040 1.00 0.35 A O
ATOM 385 N THR A 100 52.910 91.450 26.330 1.00 0.30 A N
ATOM 386 H THR A 100 53.260 91.750 27.230 1.00 0.30 A H
ATOM 387 CA THR A 100 52.820 92.470 25.310 1.00 0.30 A C
ATOM 388 HA THR A 100 52.060 92.200 24.580 1.00 0.30 A H
ATOM 389 CB THR A 100 52.510 93.870 25.870 1.00 0.30 A C
ATOM 390 HB THR A 100 52.420 94.460 24.950 1.00 0.30 A H
ATOM 391 CG2 THR A 100 51.220 94.190 26.540 1.00 0.30 A C
ATOM 392 HG21 THR A 100 50.930 95.190 26.230 1.00 0.30 A H
ATOM 393 HG22 THR A 100 50.570 93.370 26.220 1.00 0.30 A H
ATOM 394 HG23 THR A 100 51.370 94.100 27.620 1.00 0.30 A H
ATOM 395 OG1 THR A 100 53.650 94.340 26.630 1.00 0.30 A O
ATOM 396 HG1 THR A 100 53.520 93.950 27.500 1.00 0.30 A H
ATOM 397 C THR A 100 54.020 92.690 24.300 1.00 0.30 A C
ATOM 398 O THR A 100 53.860 93.240 23.230 1.00 0.30 A O
ATOM 399 N GLU A 101 55.270 92.290 24.680 1.00 0.30 A N
ATOM 400 H GLU A 101 55.400 91.820 25.570 1.00 0.30 A H
ATOM 401 CA GLU A 101 56.410 92.220 23.760 1.00 0.30 A C
ATOM 402 HA GLU A 101 55.910 91.900 22.840 1.00 0.30 A H
ATOM 403 CB GLU A 101 57.180 93.530 23.540 1.00 0.30 A C
ATOM 404 HB1 GLU A 101 56.440 94.330 23.470 1.00 0.30 A H
ATOM 405 HB2 GLU A 101 57.650 93.450 22.560 1.00 0.30 A H
ATOM 406 CG GLU A 101 58.170 94.030 24.590 1.00 0.30 A C
ATOM 407 HG1 GLU A 101 58.860 94.740 24.130 1.00 0.30 A H
ATOM 408 HG2 GLU A 101 58.740 93.170 24.930 1.00 0.30 A H
ATOM 409 CD GLU A 101 57.430 94.670 25.760 1.00 0.30 A C
ATOM 410 OE1 GLU A 101 56.720 93.990 26.610 1.00 0.30 A O
ATOM 411 OE2 GLU A 101 57.550 95.900 25.980 1.00 0.30 A O
ATOM 412 C GLU A 101 57.380 91.110 24.140 1.00 0.30 A C
ATOM 413 O GLU A 101 57.690 90.950 25.250 1.00 0.30 A O
ATOM 414 N LYS A 102 57.890 90.320 23.190 1.00 0.40 A N
ATOM 415 H LYS A 102 57.600 90.430 22.230 1.00 0.40 A H
ATOM 416 CA LYS A 102 58.940 89.290 23.380 1.00 0.40 A C
ATOM 417 HA LYS A 102 59.030 88.650 22.510 1.00 0.40 A H
ATOM 418 CB LYS A 102 60.330 89.960 23.380 1.00 0.40 A C
ATOM 419 HB1 LYS A 102 61.040 89.130 23.380 1.00 0.40 A H
ATOM 420 HB2 LYS A 102 60.450 90.610 24.240 1.00 0.40 A H
ATOM 421 CG LYS A 102 60.690 90.870 22.160 1.00 0.40 A C
ATOM 422 HG1 LYS A 102 59.930 91.650 22.120 1.00 0.40 A H
ATOM 423 HG2 LYS A 102 60.760 90.260 21.260 1.00 0.40 A H
ATOM 424 CD LYS A 102 62.110 91.330 22.400 1.00 0.40 A C
ATOM 425 HD1 LYS A 102 62.780 90.510 22.120 1.00 0.40 A H
ATOM 426 HD2 LYS A 102 62.320 91.530 23.450 1.00 0.40 A H
ATOM 427 CE LYS A 102 62.490 92.490 21.550 1.00 0.40 A C
ATOM 428 HE1 LYS A 102 61.880 93.300 21.950 1.00 0.40 A H
ATOM 429 HE2 LYS A 102 62.210 92.470 20.500 1.00 0.40 A H
ATOM 430 NZ LYS A 102 63.890 92.750 21.750 1.00 0.40 A N
ATOM 431 HZ1 LYS A 102 64.440 92.040 21.290 1.00 0.40 A H
ATOM 432 HZ2 LYS A 102 64.140 93.650 21.380 1.00 0.40 A H
ATOM 433 HZ3 LYS A 102 64.160 92.720 22.730 1.00 0.40 A H
ATOM 434 C LYS A 102 58.530 88.420 24.630 1.00 0.40 A C
ATOM 435 O LYS A 102 59.200 88.370 25.640 1.00 0.40 A O
ATOM 436 N PRO A 103 57.400 87.660 24.580 1.00 0.19 A N
ATOM 437 CD PRO A 103 56.550 87.550 23.420 1.00 0.19 A C
ATOM 438 HD1 PRO A 103 56.970 87.490 22.420 1.00 0.19 A H
ATOM 439 HD2 PRO A 103 55.900 88.410 23.510 1.00 0.19 A H
ATOM 440 CG PRO A 103 55.630 86.340 23.630 1.00 0.19 A C
ATOM 441 HG1 PRO A 103 56.140 85.430 23.320 1.00 0.19 A H
ATOM 442 HG2 PRO A 103 54.660 86.530 23.150 1.00 0.19 A H
ATOM 443 CB PRO A 103 55.480 86.440 25.160 1.00 0.19 A C
ATOM 444 HB1 PRO A 103 54.960 85.620 25.640 1.00 0.19 A H
ATOM 445 HB2 PRO A 103 54.830 87.290 25.390 1.00 0.19 A H
ATOM 446 CA PRO A 103 56.900 86.800 25.650 1.00 0.19 A C
ATOM 447 HA PRO A 103 56.830 87.360 26.570 1.00 0.19 A H
ATOM 448 C PRO A 103 57.710 85.560 25.950 1.00 0.19 A C
ATOM 449 O PRO A 103 58.900 85.430 25.530 1.00 0.19 A O
ATOM 450 N LEU A 104 57.190 84.530 26.610 1.00 0.15 A N
ATOM 451 H LEU A 104 56.260 84.680 26.990 1.00 0.15 A H
ATOM 452 CA LEU A 104 57.720 83.140 26.620 1.00 0.15 A C
ATOM 453 HA LEU A 104 58.250 83.110 27.570 1.00 0.15 A H
ATOM 454 CB LEU A 104 56.510 82.220 26.580 1.00 0.15 A C
ATOM 455 HB1 LEU A 104 55.900 82.250 25.690 1.00 0.15 A H
ATOM 456 HB2 LEU A 104 55.960 82.620 27.430 1.00 0.15 A H
ATOM 457 CG LEU A 104 56.740 80.710 26.870 1.00 0.15 A C
ATOM 458 HG LEU A 104 57.390 80.370 26.070 1.00 0.15 A H
ATOM 459 CD1 LEU A 104 57.420 80.480 28.160 1.00 0.15 A C
ATOM 460 HD11 LEU A 104 57.510 79.450 28.480 1.00 0.15 A H
ATOM 461 HD12 LEU A 104 58.420 80.930 28.150 1.00 0.15 A H
ATOM 462 HD13 LEU A 104 56.890 81.010 28.950 1.00 0.15 A H
ATOM 463 CD2 LEU A 104 55.450 79.830 26.880 1.00 0.15 A C
ATOM 464 HD21 LEU A 104 54.820 80.090 26.020 1.00 0.15 A H
ATOM 465 HD22 LEU A 104 55.710 78.760 26.830 1.00 0.15 A H
ATOM 466 HD23 LEU A 104 55.000 80.030 27.850 1.00 0.15 A H
ATOM 467 C LEU A 104 58.680 82.690 25.530 1.00 0.15 A C
ATOM 468 O LEU A 104 58.400 82.860 24.350 1.00 0.15 A O
ATOM 469 N PHE A 105 59.770 81.960 25.850 1.00 0.15 A N
ATOM 470 H PHE A 105 59.930 81.830 26.840 1.00 0.15 A H
ATOM 471 CA PHE A 105 60.630 81.220 24.870 1.00 0.15 A C
ATOM 472 HA PHE A 105 60.010 81.210 23.970 1.00 0.15 A H
ATOM 473 CB PHE A 105 61.940 82.020 24.660 1.00 0.15 A C
ATOM 474 HB1 PHE A 105 62.480 81.900 25.610 1.00 0.15 A H
ATOM 475 HB2 PHE A 105 61.660 83.020 24.370 1.00 0.15 A H
ATOM 476 CG PHE A 105 62.660 81.270 23.500 1.00 0.15 A C
ATOM 477 CD1 PHE A 105 63.410 80.080 23.680 1.00 0.15 A C
ATOM 478 HD1 PHE A 105 63.590 79.800 24.710 1.00 0.15 A H
ATOM 479 CE1 PHE A 105 64.030 79.420 22.620 1.00 0.15 A C
ATOM 480 HE1 PHE A 105 64.560 78.490 22.740 1.00 0.15 A H
ATOM 481 CZ PHE A 105 63.910 79.970 21.350 1.00 0.15 A C
ATOM 482 HZ PHE A 105 64.440 79.570 20.500 1.00 0.15 A H
ATOM 483 CE2 PHE A 105 63.260 81.180 21.150 1.00 0.15 A C
ATOM 484 HE2 PHE A 105 63.250 81.660 20.190 1.00 0.15 A H
ATOM 485 CD2 PHE A 105 62.620 81.800 22.200 1.00 0.15 A C
ATOM 486 HD2 PHE A 105 61.990 82.660 22.020 1.00 0.15 A H
ATOM 487 C PHE A 105 60.850 79.770 25.460 1.00 0.15 A C
ATOM 488 O PHE A 105 61.190 79.590 26.660 1.00 0.15 A O
ATOM 489 N ARG A 106 60.630 78.630 24.740 1.00 0.19 A N
ATOM 490 H ARG A 106 60.370 78.760 23.780 1.00 0.19 A H
ATOM 491 CA ARG A 106 60.980 77.350 25.200 1.00 0.19 A C
ATOM 492 HA ARG A 106 61.580 77.400 26.110 1.00 0.19 A H
ATOM 493 CB ARG A 106 59.680 76.600 25.580 1.00 0.19 A C
ATOM 494 HB1 ARG A 106 59.090 76.410 24.690 1.00 0.19 A H
ATOM 495 HB2 ARG A 106 59.170 77.350 26.170 1.00 0.19 A H
ATOM 496 CG ARG A 106 59.770 75.290 26.430 1.00 0.19 A C
ATOM 497 HG1 ARG A 106 60.350 74.550 25.890 1.00 0.19 A H
ATOM 498 HG2 ARG A 106 58.710 75.030 26.470 1.00 0.19 A H
ATOM 499 CD ARG A 106 60.360 75.520 27.830 1.00 0.19 A C
ATOM 500 HD1 ARG A 106 59.990 76.490 28.150 1.00 0.19 A H
ATOM 501 HD2 ARG A 106 61.450 75.550 27.770 1.00 0.19 A H
ATOM 502 NE ARG A 106 59.840 74.520 28.830 1.00 0.19 A N
ATOM 503 HE ARG A 106 58.910 74.780 29.140 1.00 0.19 A H
ATOM 504 CZ ARG A 106 60.460 73.370 29.180 1.00 0.19 A C
ATOM 505 NH1 ARG A 106 61.490 72.880 28.540 1.00 0.19 A N
ATOM 506 HH11 ARG A 106 61.890 73.270 27.710 1.00 0.19 A H
ATOM 507 HH12 ARG A 106 61.780 71.930 28.770 1.00 0.19 A H
ATOM 508 NH2 ARG A 106 59.900 72.630 30.150 1.00 0.19 A N
ATOM 509 HH21 ARG A 106 59.220 73.120 30.710 1.00 0.19 A H
ATOM 510 HH22 ARG A 106 60.400 71.790 30.440 1.00 0.19 A H
ATOM 511 C ARG A 106 61.810 76.530 24.160 1.00 0.19 A C
ATOM 512 O ARG A 106 61.670 76.600 22.920 1.00 0.19 A O
ATOM 513 N LEU A 107 62.600 75.580 24.680 1.00 0.11 A N
ATOM 514 H LEU A 107 62.750 75.680 25.670 1.00 0.11 A H
ATOM 515 CA LEU A 107 63.220 74.380 24.030 1.00 0.11 A C
ATOM 516 HA LEU A 107 62.900 74.220 23.000 1.00 0.11 A H
ATOM 517 CB LEU A 107 64.730 74.530 23.950 1.00 0.11 A C
ATOM 518 HB1 LEU A 107 65.210 73.570 23.800 1.00 0.11 A H
ATOM 519 HB2 LEU A 107 65.050 74.660 24.980 1.00 0.11 A H
ATOM 520 CG LEU A 107 65.230 75.730 23.090 1.00 0.11 A C
ATOM 521 HG LEU A 107 64.990 76.680 23.560 1.00 0.11 A H
ATOM 522 CD1 LEU A 107 66.740 75.600 22.970 1.00 0.11 A C
ATOM 523 HD11 LEU A 107 67.140 76.540 22.580 1.00 0.11 A H
ATOM 524 HD12 LEU A 107 67.040 75.410 24.000 1.00 0.11 A H
ATOM 525 HD13 LEU A 107 67.040 74.810 22.280 1.00 0.11 A H
ATOM 526 CD2 LEU A 107 64.670 75.680 21.700 1.00 0.11 A C
ATOM 527 HD21 LEU A 107 64.770 74.680 21.300 1.00 0.11 A H
ATOM 528 HD22 LEU A 107 63.620 75.940 21.780 1.00 0.11 A H
ATOM 529 HD23 LEU A 107 65.160 76.420 21.040 1.00 0.11 A H
ATOM 530 C LEU A 107 62.780 73.130 24.730 1.00 0.11 A C
ATOM 531 O LEU A 107 62.890 72.940 25.920 1.00 0.11 A O
ATOM 532 N THR A 108 62.000 72.260 24.060 1.00 0.19 A N
ATOM 533 H THR A 108 61.570 72.560 23.200 1.00 0.19 A H
ATOM 534 CA THR A 108 61.310 71.120 24.680 1.00 0.19 A C
ATOM 535 HA THR A 108 61.140 71.390 25.730 1.00 0.19 A H
ATOM 536 CB THR A 108 59.860 70.940 24.170 1.00 0.19 A C
ATOM 537 HB THR A 108 59.400 70.040 24.570 1.00 0.19 A H
ATOM 538 CG2 THR A 108 59.090 72.070 24.690 1.00 0.19 A C
ATOM 539 HG21 THR A 108 58.040 71.870 24.570 1.00 0.19 A H
ATOM 540 HG22 THR A 108 59.190 72.220 25.770 1.00 0.19 A H
ATOM 541 HG23 THR A 108 59.460 72.990 24.250 1.00 0.19 A H
ATOM 542 OG1 THR A 108 59.870 70.810 22.690 1.00 0.19 A O
ATOM 543 HG1 THR A 108 58.970 70.570 22.470 1.00 0.19 A H
ATOM 544 C THR A 108 62.110 69.850 24.660 1.00 0.19 A C
ATOM 545 O THR A 108 61.740 68.910 25.350 1.00 0.19 A O
ATOM 546 N HIS A 109 62.920 69.780 23.640 1.00 0.24 A N
ATOM 547 H HIS A 109 63.300 70.630 23.240 1.00 0.24 A H
ATOM 548 CA HIS A 109 63.510 68.510 23.100 1.00 0.24 A C
ATOM 549 HA HIS A 109 62.760 67.760 23.240 1.00 0.24 A H
ATOM 550 CB HIS A 109 63.780 68.680 21.590 1.00 0.24 A C
ATOM 551 HB1 HIS A 109 62.810 68.920 21.180 1.00 0.24 A H
ATOM 552 HB2 HIS A 109 64.000 67.710 21.140 1.00 0.24 A H
ATOM 553 CG HIS A 109 64.690 69.820 21.240 1.00 0.24 A C
ATOM 554 ND1 HIS A 109 64.390 71.180 21.040 1.00 0.24 A N
ATOM 555 CE1 HIS A 109 65.610 71.790 20.920 1.00 0.24 A C
ATOM 556 HE1 HIS A 109 65.770 72.850 20.760 1.00 0.24 A H
ATOM 557 NE2 HIS A 109 66.590 70.910 21.010 1.00 0.24 A N
ATOM 558 HE2 HIS A 109 67.590 71.050 21.010 1.00 0.24 A H
ATOM 559 CD2 HIS A 109 66.040 69.710 21.230 1.00 0.24 A C
ATOM 560 HD2 HIS A 109 66.600 68.850 21.580 1.00 0.24 A H
ATOM 561 C HIS A 109 64.710 68.030 23.850 1.00 0.24 A C
ATOM 562 O HIS A 109 65.500 67.300 23.320 1.00 0.24 A O
ATOM 563 N VAL A 110 64.820 68.400 25.110 1.00 0.10 A N
ATOM 564 H VAL A 110 64.020 68.910 25.460 1.00 0.10 A H
ATOM 565 CA VAL A 110 66.020 68.130 25.990 1.00 0.10 A C
ATOM 566 HA VAL A 110 66.940 68.010 25.430 1.00 0.10 A H
ATOM 567 CB VAL A 110 66.310 69.380 26.840 1.00 0.10 A C
ATOM 568 HB VAL A 110 65.490 69.530 27.550 1.00 0.10 A H
ATOM 569 CG1 VAL A 110 67.550 69.170 27.730 1.00 0.10 A C
ATOM 570 HG11 VAL A 110 67.600 70.090 28.310 1.00 0.10 A H
ATOM 571 HG12 VAL A 110 67.280 68.390 28.430 1.00 0.10 A H
ATOM 572 HG13 VAL A 110 68.470 68.930 27.200 1.00 0.10 A H
ATOM 573 CG2 VAL A 110 66.360 70.630 25.980 1.00 0.10 A C
ATOM 574 HG21 VAL A 110 66.930 70.390 25.080 1.00 0.10 A H
ATOM 575 HG22 VAL A 110 65.370 70.930 25.660 1.00 0.10 A H
ATOM 576 HG23 VAL A 110 66.790 71.480 26.530 1.00 0.10 A H
ATOM 577 C VAL A 110 65.830 66.920 26.860 1.00 0.10 A C
ATOM 578 O VAL A 110 65.020 66.910 27.760 1.00 0.10 A O
ATOM 579 N PRO A 111 66.410 65.760 26.520 1.00 0.11 A N
ATOM 580 CD PRO A 111 67.250 65.370 25.410 1.00 0.11 A C
ATOM 581 HD1 PRO A 111 68.210 65.840 25.640 1.00 0.11 A H
ATOM 582 HD2 PRO A 111 66.920 65.720 24.440 1.00 0.11 A H
ATOM 583 CG PRO A 111 67.460 63.860 25.340 1.00 0.11 A C
ATOM 584 HG1 PRO A 111 68.420 63.710 25.810 1.00 0.11 A H
ATOM 585 HG2 PRO A 111 67.320 63.420 24.360 1.00 0.11 A H
ATOM 586 CB PRO A 111 66.450 63.330 26.360 1.00 0.11 A C
ATOM 587 HB1 PRO A 111 66.870 62.570 27.030 1.00 0.11 A H
ATOM 588 HB2 PRO A 111 65.460 63.050 26.000 1.00 0.11 A H
ATOM 589 CA PRO A 111 66.150 64.520 27.240 1.00 0.11 A C
ATOM 590 HA PRO A 111 65.100 64.560 27.500 1.00 0.11 A H
ATOM 591 C PRO A 111 67.050 64.510 28.460 1.00 0.11 A C
ATOM 592 O PRO A 111 68.280 64.750 28.470 1.00 0.11 A O
ATOM 593 N TYR A 112 66.380 64.180 29.560 1.00 0.10 A N
ATOM 594 H TYR A 112 65.430 63.860 29.470 1.00 0.10 A H
ATOM 595 CA TYR A 112 67.030 64.270 30.880 1.00 0.10 A C
ATOM 596 HA TYR A 112 67.680 65.140 30.950 1.00 0.10 A H
ATOM 597 CB TYR A 112 65.860 64.400 31.930 1.00 0.10 A C
ATOM 598 HB1 TYR A 112 65.230 63.520 31.810 1.00 0.10 A H
ATOM 599 HB2 TYR A 112 65.310 65.300 31.660 1.00 0.10 A H
ATOM 600 CG TYR A 112 66.300 64.480 33.370 1.00 0.10 A C
ATOM 601 CD1 TYR A 112 66.310 63.300 34.180 1.00 0.10 A C
ATOM 602 HD1 TYR A 112 65.930 62.350 33.840 1.00 0.10 A H
ATOM 603 CE1 TYR A 112 66.830 63.320 35.530 1.00 0.10 A C
ATOM 604 HE1 TYR A 112 66.660 62.390 36.060 1.00 0.10 A H
ATOM 605 CZ TYR A 112 67.270 64.540 36.030 1.00 0.10 A C
ATOM 606 OH TYR A 112 67.750 64.560 37.350 1.00 0.10 A O
ATOM 607 HH TYR A 112 68.150 65.430 37.440 1.00 0.10 A H
ATOM 608 CE2 TYR A 112 67.150 65.690 35.220 1.00 0.10 A C
ATOM 609 HE2 TYR A 112 67.510 66.610 35.680 1.00 0.10 A H
ATOM 610 CD2 TYR A 112 66.710 65.680 33.910 1.00 0.10 A C
ATOM 611 HD2 TYR A 112 66.810 66.580 33.330 1.00 0.10 A H
ATOM 612 C TYR A 112 67.990 63.070 31.260 1.00 0.10 A C
ATOM 613 O TYR A 112 67.700 61.910 30.990 1.00 0.10 A O
ATOM 614 N VAL A 113 69.020 63.400 32.000 1.00 0.10 A N
ATOM 615 H VAL A 113 69.140 64.400 32.030 1.00 0.10 A H
ATOM 616 CA VAL A 113 70.060 62.590 32.640 1.00 0.10 A C
ATOM 617 HA VAL A 113 69.710 61.570 32.660 1.00 0.10 A H
ATOM 618 CB VAL A 113 71.340 62.660 31.840 1.00 0.10 A C
ATOM 619 HB VAL A 113 71.730 63.670 32.000 1.00 0.10 A H
ATOM 620 CG1 VAL A 113 72.430 61.680 32.410 1.00 0.10 A C
ATOM 621 HG11 VAL A 113 73.310 61.630 31.750 1.00 0.10 A H
ATOM 622 HG12 VAL A 113 72.910 62.250 33.210 1.00 0.10 A H
ATOM 623 HG13 VAL A 113 71.910 60.790 32.780 1.00 0.10 A H
ATOM 624 CG2 VAL A 113 71.260 62.490 30.300 1.00 0.10 A C
ATOM 625 HG21 VAL A 113 70.790 61.570 29.980 1.00 0.10 A H
ATOM 626 HG22 VAL A 113 70.640 63.310 29.920 1.00 0.10 A H
ATOM 627 HG23 VAL A 113 72.250 62.570 29.830 1.00 0.10 A H
ATOM 628 C VAL A 113 70.290 63.010 34.140 1.00 0.10 A C
ATOM 629 O VAL A 113 70.520 64.180 34.520 1.00 0.10 A O
ATOM 630 N SER A 114 70.510 62.020 35.020 1.00 0.11 A N
ATOM 631 H SER A 114 70.290 61.080 34.760 1.00 0.11 A H
ATOM 632 CA SER A 114 70.690 62.190 36.490 1.00 0.11 A C
ATOM 633 HA SER A 114 70.240 63.080 36.930 1.00 0.11 A H
ATOM 634 CB SER A 114 70.100 61.010 37.280 1.00 0.11 A C
ATOM 635 HB1 SER A 114 70.590 61.010 38.260 1.00 0.11 A H
ATOM 636 HB2 SER A 114 70.510 60.120 36.800 1.00 0.11 A H
ATOM 637 OG SER A 114 68.730 60.980 37.340 1.00 0.11 A O
ATOM 638 HG SER A 114 68.320 60.700 36.520 1.00 0.11 A H
ATOM 639 C SER A 114 72.150 62.180 36.810 1.00 0.11 A C
ATOM 640 O SER A 114 72.930 61.580 36.110 1.00 0.11 A O
ATOM 641 N GLN A 115 72.480 62.520 38.040 1.00 0.10 A N
ATOM 642 H GLN A 115 71.810 63.030 38.600 1.00 0.10 A H
ATOM 643 CA GLN A 115 73.940 62.730 38.370 1.00 0.10 A C
ATOM 644 HA GLN A 115 74.370 63.130 37.460 1.00 0.10 A H
ATOM 645 CB GLN A 115 74.020 63.780 39.460 1.00 0.10 A C
ATOM 646 HB1 GLN A 115 73.420 64.680 39.300 1.00 0.10 A H
ATOM 647 HB2 GLN A 115 75.050 63.990 39.750 1.00 0.10 A H
ATOM 648 CG GLN A 115 73.470 63.120 40.730 1.00 0.10 A C
ATOM 649 HG1 GLN A 115 74.290 62.580 41.200 1.00 0.10 A H
ATOM 650 HG2 GLN A 115 72.670 62.450 40.430 1.00 0.10 A H
ATOM 651 CD GLN A 115 72.980 64.060 41.800 1.00 0.10 A C
ATOM 652 OE1 GLN A 115 73.550 65.120 42.110 1.00 0.10 A O
ATOM 653 NE2 GLN A 115 72.010 63.610 42.530 1.00 0.10 A N
ATOM 654 HE21 GLN A 115 71.650 62.710 42.240 1.00 0.10 A H
ATOM 655 HE22 GLN A 115 71.710 64.130 43.340 1.00 0.10 A H
ATOM 656 C GLN A 115 74.710 61.400 38.680 1.00 0.10 A C
ATOM 657 O GLN A 115 75.900 61.480 38.510 1.00 0.10 A O
ATOM 658 N GLY A 116 74.090 60.330 39.080 1.00 0.12 A N
ATOM 659 H GLY A 116 73.090 60.300 39.030 1.00 0.12 A H
ATOM 660 CA GLY A 116 74.720 59.080 39.410 1.00 0.12 A C
ATOM 661 HA1 GLY A 116 75.470 58.820 38.660 1.00 0.12 A H
ATOM 662 HA2 GLY A 116 74.050 58.250 39.590 1.00 0.12 A H
ATOM 663 C GLY A 116 75.560 59.260 40.690 1.00 0.12 A C
ATOM 664 O GLY A 116 75.100 60.030 41.570 1.00 0.12 A O
ATOM 665 N ASN A 117 76.680 58.540 40.790 1.00 0.20 A N
ATOM 666 H ASN A 117 76.960 58.080 39.940 1.00 0.20 A H
ATOM 667 CA ASN A 117 77.560 58.670 41.960 1.00 0.20 A C
ATOM 668 HA ASN A 117 77.430 59.660 42.420 1.00 0.20 A H
ATOM 669 CB ASN A 117 77.060 57.600 42.960 1.00 0.20 A C
ATOM 670 HB1 ASN A 117 77.370 56.650 42.540 1.00 0.20 A H
ATOM 671 HB2 ASN A 117 75.980 57.680 43.070 1.00 0.20 A H
ATOM 672 CG ASN A 117 77.740 57.670 44.340 1.00 0.20 A C
ATOM 673 OD1 ASN A 117 77.370 58.520 45.060 1.00 0.20 A O
ATOM 674 ND2 ASN A 117 78.550 56.710 44.670 1.00 0.20 A N
ATOM 675 HD21 ASN A 117 78.580 55.940 44.020 1.00 0.20 A H
ATOM 676 HD22 ASN A 117 78.810 56.620 45.630 1.00 0.20 A H
ATOM 677 C ASN A 117 79.100 58.580 41.690 1.00 0.20 A C
ATOM 678 O ASN A 117 79.740 57.600 42.030 1.00 0.20 A O
ATOM 679 N GLU A 118 79.630 59.600 40.950 1.00 0.20 A N
ATOM 680 H GLU A 118 78.960 60.340 40.770 1.00 0.20 A H
ATOM 681 CA GLU A 118 80.930 59.710 40.350 1.00 0.20 A C
ATOM 682 HA GLU A 118 81.570 59.060 40.950 1.00 0.20 A H
ATOM 683 CB GLU A 118 80.980 59.220 38.860 1.00 0.20 A C
ATOM 684 HB1 GLU A 118 81.830 59.740 38.400 1.00 0.20 A H
ATOM 685 HB2 GLU A 118 80.050 59.490 38.360 1.00 0.20 A H
ATOM 686 CG GLU A 118 81.030 57.700 38.790 1.00 0.20 A C
ATOM 687 HG1 GLU A 118 80.240 57.280 39.410 1.00 0.20 A H
ATOM 688 HG2 GLU A 118 81.970 57.300 39.180 1.00 0.20 A H
ATOM 689 CD GLU A 118 80.790 57.310 37.390 1.00 0.20 A C
ATOM 690 OE1 GLU A 118 81.680 57.530 36.510 1.00 0.20 A O
ATOM 691 OE2 GLU A 118 79.770 56.660 37.140 1.00 0.20 A O
ATOM 692 C GLU A 118 81.360 61.180 40.520 1.00 0.20 A C
ATOM 693 O GLU A 118 80.570 62.070 40.530 1.00 0.20 A O
ATOM 694 N ARG A 119 82.660 61.380 40.730 1.00 0.15 A N
ATOM 695 H ARG A 119 83.300 60.600 40.720 1.00 0.15 A H
ATOM 696 CA ARG A 119 83.230 62.730 40.920 1.00 0.15 A C
ATOM 697 HA ARG A 119 82.850 63.140 41.860 1.00 0.15 A H
ATOM 698 CB ARG A 119 84.750 62.630 41.020 1.00 0.15 A C
ATOM 699 HB1 ARG A 119 85.100 62.120 41.920 1.00 0.15 A H
ATOM 700 HB2 ARG A 119 85.080 63.660 41.130 1.00 0.15 A H
ATOM 701 CG ARG A 119 85.420 61.910 39.820 1.00 0.15 A C
ATOM 702 HG1 ARG A 119 85.140 62.450 38.920 1.00 0.15 A H
ATOM 703 HG2 ARG A 119 85.060 60.890 39.750 1.00 0.15 A H
ATOM 704 CD ARG A 119 86.940 61.850 40.020 1.00 0.15 A C
ATOM 705 HD1 ARG A 119 87.160 61.330 40.950 1.00 0.15 A H
ATOM 706 HD2 ARG A 119 87.250 62.880 40.180 1.00 0.15 A H
ATOM 707 NE ARG A 119 87.740 61.230 38.910 1.00 0.15 A N
ATOM 708 HE ARG A 119 87.330 61.010 38.030 1.00 0.15 A H
ATOM 709 CZ ARG A 119 88.990 60.910 39.090 1.00 0.15 A C
ATOM 710 NH1 ARG A 119 89.610 61.260 40.140 1.00 0.15 A N
ATOM 711 HH11 ARG A 119 89.150 61.790 40.880 1.00 0.15 A H
ATOM 712 HH12 ARG A 119 90.570 60.990 40.230 1.00 0.15 A H
ATOM 713 NH2 ARG A 119 89.710 60.360 38.190 1.00 0.15 A N
ATOM 714 HH21 ARG A 119 89.280 60.010 37.360 1.00 0.15 A H
ATOM 715 HH22 ARG A 119 90.720 60.340 38.310 1.00 0.15 A H
ATOM 716 C ARG A 119 82.790 63.750 39.810 1.00 0.15 A C
ATOM 717 O ARG A 119 82.880 63.440 38.610 1.00 0.15 A O
ATOM 718 N MET A 120 82.350 64.900 40.260 1.00 0.11 A N
ATOM 719 H MET A 120 82.460 65.020 41.260 1.00 0.11 A H
ATOM 720 CA MET A 120 81.680 65.910 39.540 1.00 0.11 A C
ATOM 721 HA MET A 120 81.170 66.500 40.310 1.00 0.11 A H
ATOM 722 CB MET A 120 82.610 66.910 38.830 1.00 0.11 A C
ATOM 723 HB1 MET A 120 82.910 66.490 37.870 1.00 0.11 A H
ATOM 724 HB2 MET A 120 83.470 67.080 39.480 1.00 0.11 A H
ATOM 725 CG MET A 120 81.930 68.350 38.530 1.00 0.11 A C
ATOM 726 HG1 MET A 120 80.860 68.270 38.320 1.00 0.11 A H
ATOM 727 HG2 MET A 120 82.430 68.640 37.610 1.00 0.11 A H
ATOM 728 SD MET A 120 81.980 69.590 39.830 1.00 0.11 A S
ATOM 729 CE MET A 120 83.540 70.400 39.400 1.00 0.11 A C
ATOM 730 HE1 MET A 120 83.900 70.230 38.380 1.00 0.11 A H
ATOM 731 HE2 MET A 120 83.310 71.450 39.570 1.00 0.11 A H
ATOM 732 HE3 MET A 120 84.330 70.080 40.080 1.00 0.11 A H
ATOM 733 C MET A 120 80.570 65.490 38.590 1.00 0.11 A C
ATOM 734 O MET A 120 80.420 66.080 37.490 1.00 0.11 A O
ATOM 735 N GLY A 121 79.800 64.450 38.940 1.00 0.08 A N
ATOM 736 H GLY A 121 79.960 64.060 39.860 1.00 0.08 A H
ATOM 737 CA GLY A 121 79.010 63.650 37.960 1.00 0.08 A C
ATOM 738 HA1 GLY A 121 78.600 62.730 38.380 1.00 0.08 A H
ATOM 739 HA2 GLY A 121 79.680 63.360 37.150 1.00 0.08 A H
ATOM 740 C GLY A 121 77.820 64.420 37.380 1.00 0.08 A C
ATOM 741 O GLY A 121 77.300 63.980 36.350 1.00 0.08 A O
ATOM 742 N CYS A 122 77.430 65.540 37.960 1.00 0.07 A N
ATOM 743 H CYS A 122 78.040 65.870 38.690 1.00 0.07 A H
ATOM 744 CA CYS A 122 76.370 66.460 37.350 1.00 0.07 A C
ATOM 745 HA CYS A 122 75.430 65.950 37.170 1.00 0.07 A H
ATOM 746 CB CYS A 122 75.910 67.440 38.470 1.00 0.07 A C
ATOM 747 HB1 CYS A 122 75.560 66.830 39.300 1.00 0.07 A H
ATOM 748 HB2 CYS A 122 75.070 68.130 38.300 1.00 0.07 A H
ATOM 749 SG CYS A 122 77.330 68.380 39.050 1.00 0.07 A S
ATOM 750 HG CYS A 122 77.120 68.490 40.360 1.00 0.07 A H
ATOM 751 C CYS A 122 76.910 67.180 36.120 1.00 0.07 A C
ATOM 752 O CYS A 122 76.190 67.400 35.130 1.00 0.07 A O
ATOM 753 N TRP A 123 78.260 67.560 36.060 1.00 0.07 A N
ATOM 754 H TRP A 123 78.880 67.270 36.800 1.00 0.07 A H
ATOM 755 CA TRP A 123 78.910 68.350 34.960 1.00 0.07 A C
ATOM 756 HA TRP A 123 78.360 69.260 34.680 1.00 0.07 A H
ATOM 757 CB TRP A 123 80.370 68.760 35.300 1.00 0.07 A C
ATOM 758 HB1 TRP A 123 80.900 68.990 34.380 1.00 0.07 A H
ATOM 759 HB2 TRP A 123 80.840 67.900 35.760 1.00 0.07 A H
ATOM 760 CG TRP A 123 80.610 70.080 36.120 1.00 0.07 A C
ATOM 761 CD1 TRP A 123 79.960 70.540 37.200 1.00 0.07 A C
ATOM 762 HD1 TRP A 123 79.180 70.020 37.750 1.00 0.07 A H
ATOM 763 NE1 TRP A 123 80.500 71.720 37.610 1.00 0.07 A N
ATOM 764 HE1 TRP A 123 80.320 72.130 38.520 1.00 0.07 A H
ATOM 765 CE2 TRP A 123 81.450 72.150 36.790 1.00 0.07 A C
ATOM 766 CZ2 TRP A 123 82.430 73.160 36.840 1.00 0.07 A C
ATOM 767 HZ2 TRP A 123 82.450 73.780 37.720 1.00 0.07 A H
ATOM 768 CH2 TRP A 123 83.310 73.380 35.810 1.00 0.07 A C
ATOM 769 HH2 TRP A 123 84.040 74.180 35.770 1.00 0.07 A H
ATOM 770 CZ3 TRP A 123 83.320 72.450 34.750 1.00 0.07 A C
ATOM 771 HZ3 TRP A 123 83.950 72.550 33.880 1.00 0.07 A H
ATOM 772 CE3 TRP A 123 82.380 71.360 34.720 1.00 0.07 A C
ATOM 773 HE3 TRP A 123 82.400 70.620 33.930 1.00 0.07 A H
ATOM 774 CD2 TRP A 123 81.460 71.170 35.780 1.00 0.07 A C
ATOM 775 C TRP A 123 78.880 67.400 33.730 1.00 0.07 A C
ATOM 776 O TRP A 123 78.390 67.870 32.750 1.00 0.07 A O
ATOM 777 N TYR A 124 79.320 66.110 33.920 1.00 0.08 A N
ATOM 778 H TYR A 124 79.580 65.780 34.840 1.00 0.08 A H
ATOM 779 CA TYR A 124 79.050 65.050 32.920 1.00 0.08 A C
ATOM 780 HA TYR A 124 79.470 65.390 31.970 1.00 0.08 A H
ATOM 781 CB TYR A 124 79.720 63.800 33.370 1.00 0.08 A C
ATOM 782 HB1 TYR A 124 79.530 62.920 32.750 1.00 0.08 A H
ATOM 783 HB2 TYR A 124 79.320 63.590 34.370 1.00 0.08 A H
ATOM 784 CG TYR A 124 81.210 64.020 33.560 1.00 0.08 A C
ATOM 785 CD1 TYR A 124 82.060 64.010 32.390 1.00 0.08 A C
ATOM 786 HD1 TYR A 124 81.710 63.900 31.380 1.00 0.08 A H
ATOM 787 CE1 TYR A 124 83.410 64.310 32.610 1.00 0.08 A C
ATOM 788 HE1 TYR A 124 83.930 64.420 31.670 1.00 0.08 A H
ATOM 789 CZ TYR A 124 84.020 64.380 33.870 1.00 0.08 A C
ATOM 790 OH TYR A 124 85.380 64.640 33.960 1.00 0.08 A O
ATOM 791 HH TYR A 124 85.700 64.700 34.870 1.00 0.08 A H
ATOM 792 CE2 TYR A 124 83.140 64.360 35.000 1.00 0.08 A C
ATOM 793 HE2 TYR A 124 83.600 64.500 35.970 1.00 0.08 A H
ATOM 794 CD2 TYR A 124 81.760 64.230 34.880 1.00 0.08 A C
ATOM 795 HD2 TYR A 124 81.160 64.090 35.770 1.00 0.08 A H
ATOM 796 C TYR A 124 77.590 64.850 32.540 1.00 0.08 A C
ATOM 797 O TYR A 124 77.380 64.640 31.350 1.00 0.08 A O
ATOM 798 N ALA A 125 76.610 64.850 33.480 1.00 0.08 A N
ATOM 799 H ALA A 125 76.810 64.730 34.460 1.00 0.08 A H
ATOM 800 CA ALA A 125 75.250 64.660 33.150 1.00 0.08 A C
ATOM 801 HA ALA A 125 75.130 63.790 32.490 1.00 0.08 A H
ATOM 802 CB ALA A 125 74.540 64.380 34.480 1.00 0.08 A C
ATOM 803 HB1 ALA A 125 73.500 64.050 34.360 1.00 0.08 A H
ATOM 804 HB2 ALA A 125 75.030 63.520 34.950 1.00 0.08 A H
ATOM 805 HB3 ALA A 125 74.600 65.300 35.050 1.00 0.08 A H
ATOM 806 C ALA A 125 74.660 65.790 32.290 1.00 0.08 A C
ATOM 807 O ALA A 125 74.040 65.520 31.280 1.00 0.08 A O
ATOM 808 N CYS A 126 75.070 66.990 32.670 1.00 0.07 A N
ATOM 809 H CYS A 126 75.630 67.170 33.500 1.00 0.07 A H
ATOM 810 CA CYS A 126 74.790 68.230 31.960 1.00 0.07 A C
ATOM 811 HA CYS A 126 73.700 68.320 31.930 1.00 0.07 A H
ATOM 812 CB CYS A 126 75.310 69.460 32.720 1.00 0.07 A C
ATOM 813 HB1 CYS A 126 75.070 70.390 32.210 1.00 0.07 A H
ATOM 814 HB2 CYS A 126 76.400 69.380 32.770 1.00 0.07 A H
ATOM 815 SG CYS A 126 74.550 69.710 34.300 1.00 0.07 A S
ATOM 816 HG CYS A 126 75.010 68.580 34.850 1.00 0.07 A H
ATOM 817 C CYS A 126 75.390 68.190 30.540 1.00 0.07 A C
ATOM 818 O CYS A 126 74.650 68.600 29.630 1.00 0.07 A O
ATOM 819 N ALA A 127 76.650 67.750 30.370 1.00 0.08 A N
ATOM 820 H ALA A 127 77.250 67.660 31.180 1.00 0.08 A H
ATOM 821 CA ALA A 127 77.070 67.500 28.990 1.00 0.08 A C
ATOM 822 HA ALA A 127 76.730 68.390 28.460 1.00 0.08 A H
ATOM 823 CB ALA A 127 78.590 67.460 28.980 1.00 0.08 A C
ATOM 824 HB1 ALA A 127 78.950 66.690 29.660 1.00 0.08 A H
ATOM 825 HB2 ALA A 127 78.940 67.060 28.020 1.00 0.08 A H
ATOM 826 HB3 ALA A 127 79.060 68.400 29.280 1.00 0.08 A H
ATOM 827 C ALA A 127 76.370 66.310 28.250 1.00 0.08 A C
ATOM 828 O ALA A 127 76.150 66.370 27.020 1.00 0.08 A O
ATOM 829 N ARG A 128 75.970 65.310 28.990 1.00 0.18 A N
ATOM 830 H ARG A 128 76.260 65.160 29.950 1.00 0.18 A H
ATOM 831 CA ARG A 128 75.240 64.140 28.450 1.00 0.18 A C
ATOM 832 HA ARG A 128 75.800 63.790 27.580 1.00 0.18 A H
ATOM 833 CB ARG A 128 75.280 62.970 29.380 1.00 0.18 A C
ATOM 834 HB1 ARG A 128 74.650 63.100 30.250 1.00 0.18 A H
ATOM 835 HB2 ARG A 128 76.230 62.900 29.890 1.00 0.18 A H
ATOM 836 CG ARG A 128 74.940 61.640 28.620 1.00 0.18 A C
ATOM 837 HG1 ARG A 128 74.120 61.800 27.920 1.00 0.18 A H
ATOM 838 HG2 ARG A 128 74.600 60.940 29.380 1.00 0.18 A H
ATOM 839 CD ARG A 128 76.150 61.050 27.890 1.00 0.18 A C
ATOM 840 HD1 ARG A 128 76.500 61.740 27.130 1.00 0.18 A H
ATOM 841 HD2 ARG A 128 75.770 60.160 27.390 1.00 0.18 A H
ATOM 842 NE ARG A 128 77.330 60.750 28.730 1.00 0.18 A N
ATOM 843 HE ARG A 128 78.000 61.500 28.840 1.00 0.18 A H
ATOM 844 CZ ARG A 128 77.550 59.680 29.490 1.00 0.18 A C
ATOM 845 NH1 ARG A 128 77.070 58.550 29.460 1.00 0.18 A N
ATOM 846 HH11 ARG A 128 76.390 58.320 28.740 1.00 0.18 A H
ATOM 847 HH12 ARG A 128 77.470 57.890 30.120 1.00 0.18 A H
ATOM 848 NH2 ARG A 128 78.560 59.790 30.320 1.00 0.18 A N
ATOM 849 HH21 ARG A 128 79.130 60.620 30.420 1.00 0.18 A H
ATOM 850 HH22 ARG A 128 78.570 59.060 31.000 1.00 0.18 A H
ATOM 851 C ARG A 128 73.860 64.650 27.960 1.00 0.18 A C
ATOM 852 O ARG A 128 73.560 64.340 26.800 1.00 0.18 A O
ATOM 853 N MET A 129 73.090 65.450 28.720 1.00 0.09 A N
ATOM 854 H MET A 129 73.410 65.820 29.600 1.00 0.09 A H
ATOM 855 CA MET A 129 71.860 66.060 28.170 1.00 0.09 A C
ATOM 856 HA MET A 129 71.100 65.300 27.990 1.00 0.09 A H
ATOM 857 CB MET A 129 71.160 66.980 29.150 1.00 0.09 A C
ATOM 858 HB1 MET A 129 70.280 67.500 28.790 1.00 0.09 A H
ATOM 859 HB2 MET A 129 71.910 67.660 29.530 1.00 0.09 A H
ATOM 860 CG MET A 129 70.680 66.120 30.340 1.00 0.09 A C
ATOM 861 HG1 MET A 129 71.530 65.780 30.920 1.00 0.09 A H
ATOM 862 HG2 MET A 129 70.100 65.280 29.950 1.00 0.09 A H
ATOM 863 SD MET A 129 69.550 67.020 31.500 1.00 0.09 A S
ATOM 864 CE MET A 129 70.760 67.560 32.780 1.00 0.09 A C
ATOM 865 HE1 MET A 129 70.220 68.120 33.540 1.00 0.09 A H
ATOM 866 HE2 MET A 129 71.180 66.650 33.190 1.00 0.09 A H
ATOM 867 HE3 MET A 129 71.590 68.110 32.310 1.00 0.09 A H
ATOM 868 C MET A 129 72.020 66.860 26.900 1.00 0.09 A C
ATOM 869 O MET A 129 71.260 66.570 26.000 1.00 0.09 A O
ATOM 870 N VAL A 130 72.840 67.880 26.790 1.00 0.11 A N
ATOM 871 H VAL A 130 73.390 68.020 27.620 1.00 0.11 A H
ATOM 872 CA VAL A 130 73.060 68.700 25.570 1.00 0.11 A C
ATOM 873 HA VAL A 130 72.140 69.200 25.270 1.00 0.11 A H
ATOM 874 CB VAL A 130 73.990 69.920 25.770 1.00 0.11 A C
ATOM 875 HB VAL A 130 74.070 70.490 24.840 1.00 0.11 A H
ATOM 876 CG1 VAL A 130 73.320 70.760 26.840 1.00 0.11 A C
ATOM 877 HG11 VAL A 130 73.770 71.750 26.760 1.00 0.11 A H
ATOM 878 HG12 VAL A 130 72.270 70.950 26.620 1.00 0.11 A H
ATOM 879 HG13 VAL A 130 73.390 70.210 27.790 1.00 0.11 A H
ATOM 880 CG2 VAL A 130 75.390 69.560 26.270 1.00 0.11 A C
ATOM 881 HG21 VAL A 130 75.980 70.430 26.530 1.00 0.11 A H
ATOM 882 HG22 VAL A 130 75.390 68.780 27.040 1.00 0.11 A H
ATOM 883 HG23 VAL A 130 75.840 69.090 25.390 1.00 0.11 A H
ATOM 884 C VAL A 130 73.540 67.830 24.410 1.00 0.11 A C
ATOM 885 O VAL A 130 73.100 68.200 23.270 1.00 0.11 A O
ATOM 886 N GLY A 131 74.170 66.710 24.700 1.00 0.10 A N
ATOM 887 H GLY A 131 74.260 66.650 25.700 1.00 0.10 A H
ATOM 888 CA GLY A 131 74.560 65.800 23.670 1.00 0.10 A C
ATOM 889 HA1 GLY A 131 75.380 65.180 24.050 1.00 0.10 A H
ATOM 890 HA2 GLY A 131 74.840 66.430 22.820 1.00 0.10 A H
ATOM 891 C GLY A 131 73.330 64.990 23.140 1.00 0.10 A C
ATOM 892 O GLY A 131 73.010 65.150 21.950 1.00 0.10 A O
ATOM 893 N HIS A 132 72.650 64.270 24.060 1.00 0.16 A N
ATOM 894 H HIS A 132 73.170 64.130 24.910 1.00 0.16 A H
ATOM 895 CA HIS A 132 71.470 63.480 23.800 1.00 0.16 A C
ATOM 896 HA HIS A 132 71.660 62.680 23.090 1.00 0.16 A H
ATOM 897 CB HIS A 132 71.070 62.820 25.150 1.00 0.16 A C
ATOM 898 HB1 HIS A 132 70.050 62.480 24.960 1.00 0.16 A H
ATOM 899 HB2 HIS A 132 71.000 63.590 25.920 1.00 0.16 A H
ATOM 900 CG HIS A 132 71.870 61.670 25.620 1.00 0.16 A C
ATOM 901 ND1 HIS A 132 71.420 60.940 26.730 1.00 0.16 A N
ATOM 902 CE1 HIS A 132 72.320 59.930 26.850 1.00 0.16 A C
ATOM 903 HE1 HIS A 132 72.390 59.090 27.540 1.00 0.16 A H
ATOM 904 NE2 HIS A 132 73.330 60.050 25.970 1.00 0.16 A N
ATOM 905 HE2 HIS A 132 74.050 59.370 25.780 1.00 0.16 A H
ATOM 906 CD2 HIS A 132 73.090 61.170 25.200 1.00 0.16 A C
ATOM 907 HD2 HIS A 132 73.650 61.460 24.330 1.00 0.16 A H
ATOM 908 C HIS A 132 70.330 64.400 23.270 1.00 0.16 A C
ATOM 909 O HIS A 132 69.470 63.850 22.570 1.00 0.16 A O
ATOM 910 N SER A 133 70.380 65.730 23.440 1.00 0.12 A N
ATOM 911 H SER A 133 71.220 66.040 23.920 1.00 0.12 A H
ATOM 912 CA SER A 133 69.420 66.660 22.820 1.00 0.12 A C
ATOM 913 HA SER A 133 68.380 66.360 23.000 1.00 0.12 A H
ATOM 914 CB SER A 133 69.630 68.100 23.350 1.00 0.12 A C
ATOM 915 HB1 SER A 133 68.900 68.750 22.880 1.00 0.12 A H
ATOM 916 HB2 SER A 133 70.680 68.380 23.280 1.00 0.12 A H
ATOM 917 OG SER A 133 69.230 68.130 24.690 1.00 0.12 A O
ATOM 918 HG SER A 133 69.860 67.550 25.130 1.00 0.12 A H
ATOM 919 C SER A 133 69.480 66.640 21.250 1.00 0.12 A C
ATOM 920 O SER A 133 68.430 67.070 20.660 1.00 0.12 A O
ATOM 921 N VAL A 134 70.550 66.180 20.640 1.00 0.20 A N
ATOM 922 H VAL A 134 71.310 65.970 21.260 1.00 0.20 A H
ATOM 923 CA VAL A 134 70.780 66.270 19.190 1.00 0.20 A C
ATOM 924 HA VAL A 134 69.800 66.380 18.720 1.00 0.20 A H
ATOM 925 CB VAL A 134 71.580 67.480 18.760 1.00 0.20 A C
ATOM 926 HB VAL A 134 71.780 67.400 17.690 1.00 0.20 A H
ATOM 927 CG1 VAL A 134 70.900 68.760 19.070 1.00 0.20 A C
ATOM 928 HG11 VAL A 134 70.770 68.840 20.150 1.00 0.20 A H
ATOM 929 HG12 VAL A 134 71.410 69.690 18.810 1.00 0.20 A H
ATOM 930 HG13 VAL A 134 70.000 68.750 18.440 1.00 0.20 A H
ATOM 931 CG2 VAL A 134 72.980 67.490 19.380 1.00 0.20 A C
ATOM 932 HG21 VAL A 134 73.450 68.350 18.910 1.00 0.20 A H
ATOM 933 HG22 VAL A 134 72.940 67.470 20.460 1.00 0.20 A H
ATOM 934 HG23 VAL A 134 73.620 66.670 19.060 1.00 0.20 A H
ATOM 935 C VAL A 134 71.550 65.040 18.570 1.00 0.20 A C
ATOM 936 O VAL A 134 71.560 64.960 17.350 1.00 0.20 A O
ATOM 937 N GLU A 135 72.300 64.230 19.370 1.00 0.26 A N
ATOM 938 H GLU A 135 72.310 64.430 20.360 1.00 0.26 A H
ATOM 939 CA GLU A 135 72.980 63.030 18.790 1.00 0.26 A C
ATOM 940 HA GLU A 135 72.490 62.650 17.890 1.00 0.26 A H
ATOM 941 CB GLU A 135 74.400 63.510 18.460 1.00 0.26 A C
ATOM 942 HB1 GLU A 135 74.830 63.910 19.380 1.00 0.26 A H
ATOM 943 HB2 GLU A 135 74.280 64.360 17.780 1.00 0.26 A H
ATOM 944 CG GLU A 135 75.300 62.440 17.850 1.00 0.26 A C
ATOM 945 HG1 GLU A 135 75.400 61.540 18.450 1.00 0.26 A H
ATOM 946 HG2 GLU A 135 76.270 62.910 17.680 1.00 0.26 A H
ATOM 947 CD GLU A 135 74.780 62.050 16.490 1.00 0.26 A C
ATOM 948 OE1 GLU A 135 74.340 60.830 16.350 1.00 0.26 A O
ATOM 949 OE2 GLU A 135 74.760 62.900 15.610 1.00 0.26 A O
ATOM 950 C GLU A 135 72.970 61.850 19.810 1.00 0.26 A C
ATOM 951 O GLU A 135 73.750 61.770 20.750 1.00 0.26 A O
ATOM 952 N ALA A 136 72.040 60.910 19.620 1.00 0.38 A N
ATOM 953 H ALA A 136 71.400 61.080 18.860 1.00 0.38 A H
ATOM 954 CA ALA A 136 71.890 59.760 20.540 1.00 0.38 A C
ATOM 955 HA ALA A 136 72.060 60.220 21.510 1.00 0.38 A H
ATOM 956 CB ALA A 136 70.450 59.250 20.410 1.00 0.38 A C
ATOM 957 HB1 ALA A 136 70.270 58.470 19.660 1.00 0.38 A H
ATOM 958 HB2 ALA A 136 70.200 58.640 21.260 1.00 0.38 A H
ATOM 959 HB3 ALA A 136 69.670 60.030 20.380 1.00 0.38 A H
ATOM 960 C ALA A 136 72.910 58.630 20.290 1.00 0.38 A C
ATOM 961 O ALA A 136 72.710 57.560 20.900 1.00 0.38 A O
ATOM 962 N GLY A 137 73.810 58.800 19.370 1.00 0.39 A N
ATOM 963 H GLY A 137 73.740 59.630 18.830 1.00 0.39 A H
ATOM 964 CA GLY A 137 74.790 57.730 19.020 1.00 0.39 A C
ATOM 965 HA1 GLY A 137 75.480 58.070 18.260 1.00 0.39 A H
ATOM 966 HA2 GLY A 137 74.350 56.870 18.510 1.00 0.39 A H
ATOM 967 C GLY A 137 75.730 57.430 20.200 1.00 0.39 A C
ATOM 968 O GLY A 137 75.780 58.270 21.130 1.00 0.39 A O
ATOM 969 N PRO A 138 76.410 56.270 20.180 1.00 0.42 A N
ATOM 970 CD PRO A 138 75.990 55.030 19.530 1.00 0.42 A C
ATOM 971 HD1 PRO A 138 76.380 55.070 18.500 1.00 0.42 A H
ATOM 972 HD2 PRO A 138 74.930 54.850 19.620 1.00 0.42 A H
ATOM 973 CG PRO A 138 76.700 53.920 20.280 1.00 0.42 A C
ATOM 974 HG1 PRO A 138 76.900 53.110 19.580 1.00 0.42 A H
ATOM 975 HG2 PRO A 138 76.160 53.600 21.170 1.00 0.42 A H
ATOM 976 CB PRO A 138 78.020 54.610 20.730 1.00 0.42 A C
ATOM 977 HB1 PRO A 138 78.660 54.570 19.860 1.00 0.42 A H
ATOM 978 HB2 PRO A 138 78.590 54.090 21.520 1.00 0.42 A H
ATOM 979 CA PRO A 138 77.510 55.960 21.110 1.00 0.42 A C
ATOM 980 HA PRO A 138 77.170 55.980 22.140 1.00 0.42 A H
ATOM 981 C PRO A 138 78.710 56.980 20.990 1.00 0.42 A C
ATOM 982 O PRO A 138 78.840 57.750 20.080 1.00 0.42 A O
ATOM 983 N ARG A 139 79.580 56.960 22.010 1.00 0.29 A N
ATOM 984 H ARG A 139 79.400 56.180 22.620 1.00 0.29 A H
ATOM 985 CA ARG A 139 80.510 58.040 22.360 1.00 0.29 A C
ATOM 986 HA ARG A 139 80.580 58.710 21.500 1.00 0.29 A H
ATOM 987 CB ARG A 139 79.850 58.960 23.470 1.00 0.29 A C
ATOM 988 HB1 ARG A 139 79.380 59.780 22.920 1.00 0.29 A H
ATOM 989 HB2 ARG A 139 80.570 59.570 24.010 1.00 0.29 A H
ATOM 990 CG ARG A 139 78.920 58.340 24.580 1.00 0.29 A C
ATOM 991 HG1 ARG A 139 79.530 57.620 25.140 1.00 0.29 A H
ATOM 992 HG2 ARG A 139 78.010 57.890 24.190 1.00 0.29 A H
ATOM 993 CD ARG A 139 78.530 59.480 25.500 1.00 0.29 A C
ATOM 994 HD1 ARG A 139 77.740 59.150 26.160 1.00 0.29 A H
ATOM 995 HD2 ARG A 139 78.180 60.270 24.850 1.00 0.29 A H
ATOM 996 NE ARG A 139 79.650 59.960 26.310 1.00 0.29 A N
ATOM 997 HE ARG A 139 80.170 59.260 26.830 1.00 0.29 A H
ATOM 998 CZ ARG A 139 80.070 61.140 26.640 1.00 0.29 A C
ATOM 999 NH1 ARG A 139 79.640 62.240 26.150 1.00 0.29 A N
ATOM 1000 HH11 ARG A 139 79.090 62.240 25.310 1.00 0.29 A H
ATOM 1001 HH12 ARG A 139 79.930 63.060 26.680 1.00 0.29 A H
ATOM 1002 NH2 ARG A 139 80.980 61.300 27.550 1.00 0.29 A N
ATOM 1003 HH21 ARG A 139 81.160 60.510 28.160 1.00 0.29 A H
ATOM 1004 HH22 ARG A 139 81.310 62.250 27.670 1.00 0.29 A H
ATOM 1005 C ARG A 139 81.920 57.600 22.720 1.00 0.29 A C
ATOM 1006 O ARG A 139 82.140 56.450 22.940 1.00 0.29 A O
ATOM 1007 N LEU A 140 82.840 58.590 22.830 1.00 0.31 A N
ATOM 1008 H LEU A 140 82.530 59.530 22.670 1.00 0.31 A H
ATOM 1009 CA LEU A 140 83.960 58.490 23.800 1.00 0.31 A C
ATOM 1010 HA LEU A 140 84.040 57.460 24.130 1.00 0.31 A H
ATOM 1011 CB LEU A 140 85.290 58.700 22.990 1.00 0.31 A C
ATOM 1012 HB1 LEU A 140 86.100 58.900 23.700 1.00 0.31 A H
ATOM 1013 HB2 LEU A 140 85.110 59.630 22.430 1.00 0.31 A H
ATOM 1014 CG LEU A 140 85.850 57.560 22.030 1.00 0.31 A C
ATOM 1015 HG LEU A 140 85.010 57.070 21.550 1.00 0.31 A H
ATOM 1016 CD1 LEU A 140 86.640 58.110 20.870 1.00 0.31 A C
ATOM 1017 HD11 LEU A 140 87.130 57.360 20.230 1.00 0.31 A H
ATOM 1018 HD12 LEU A 140 86.080 58.600 20.070 1.00 0.31 A H
ATOM 1019 HD13 LEU A 140 87.500 58.720 21.120 1.00 0.31 A H
ATOM 1020 CD2 LEU A 140 86.620 56.540 22.820 1.00 0.31 A C
ATOM 1021 HD21 LEU A 140 86.720 55.650 22.180 1.00 0.31 A H
ATOM 1022 HD22 LEU A 140 87.590 56.820 23.230 1.00 0.31 A H
ATOM 1023 HD23 LEU A 140 85.960 56.320 23.660 1.00 0.31 A H
ATOM 1024 C LEU A 140 83.690 59.440 24.950 1.00 0.31 A C
ATOM 1025 O LEU A 140 83.450 60.670 24.730 1.00 0.31 A O
ATOM 1026 N GLY A 141 83.720 58.960 26.190 1.00 0.20 A N
ATOM 1027 H GLY A 141 83.830 57.970 26.330 1.00 0.20 A H
ATOM 1028 CA GLY A 141 84.000 59.820 27.300 1.00 0.20 A C
ATOM 1029 HA1 GLY A 141 83.630 59.450 28.260 1.00 0.20 A H
ATOM 1030 HA2 GLY A 141 83.460 60.760 27.120 1.00 0.20 A H
ATOM 1031 C GLY A 141 85.470 60.140 27.390 1.00 0.20 A C
ATOM 1032 O GLY A 141 86.270 60.070 26.450 1.00 0.20 A O
ATOM 1033 N LEU A 142 86.010 60.400 28.610 1.00 0.15 A N
ATOM 1034 H LEU A 142 85.390 60.430 29.400 1.00 0.15 A H
ATOM 1035 CA LEU A 142 87.420 60.810 28.760 1.00 0.15 A C
ATOM 1036 HA LEU A 142 87.590 61.380 27.860 1.00 0.15 A H
ATOM 1037 CB LEU A 142 87.680 61.770 29.960 1.00 0.15 A C
ATOM 1038 HB1 LEU A 142 88.710 61.680 30.300 1.00 0.15 A H
ATOM 1039 HB2 LEU A 142 87.080 61.360 30.770 1.00 0.15 A H
ATOM 1040 CG LEU A 142 87.200 63.190 29.740 1.00 0.15 A C
ATOM 1041 HG LEU A 142 86.130 63.340 29.580 1.00 0.15 A H
ATOM 1042 CD1 LEU A 142 87.570 64.060 30.920 1.00 0.15 A C
ATOM 1043 HD11 LEU A 142 86.880 63.750 31.700 1.00 0.15 A H
ATOM 1044 HD12 LEU A 142 88.600 63.890 31.250 1.00 0.15 A H
ATOM 1045 HD13 LEU A 142 87.350 65.090 30.670 1.00 0.15 A H
ATOM 1046 CD2 LEU A 142 87.980 63.870 28.550 1.00 0.15 A C
ATOM 1047 HD21 LEU A 142 87.810 64.950 28.610 1.00 0.15 A H
ATOM 1048 HD22 LEU A 142 89.060 63.740 28.570 1.00 0.15 A H
ATOM 1049 HD23 LEU A 142 87.520 63.520 27.610 1.00 0.15 A H
ATOM 1050 C LEU A 142 88.420 59.640 28.740 1.00 0.15 A C
ATOM 1051 O LEU A 142 88.100 58.470 29.140 1.00 0.15 A O
ATOM 1052 N PRO A 143 89.670 59.870 28.260 1.00 0.15 A N
ATOM 1053 CD PRO A 143 90.200 61.130 27.780 1.00 0.15 A C
ATOM 1054 HD1 PRO A 143 90.560 61.750 28.610 1.00 0.15 A H
ATOM 1055 HD2 PRO A 143 89.460 61.650 27.180 1.00 0.15 A H
ATOM 1056 CG PRO A 143 91.400 60.670 27.000 1.00 0.15 A C
ATOM 1057 HG1 PRO A 143 92.250 61.360 27.020 1.00 0.15 A H
ATOM 1058 HG2 PRO A 143 91.100 60.560 25.950 1.00 0.15 A H
ATOM 1059 CB PRO A 143 91.900 59.400 27.560 1.00 0.15 A C
ATOM 1060 HB1 PRO A 143 92.570 59.600 28.400 1.00 0.15 A H
ATOM 1061 HB2 PRO A 143 92.400 58.770 26.830 1.00 0.15 A H
ATOM 1062 CA PRO A 143 90.600 58.760 27.980 1.00 0.15 A C
ATOM 1063 HA PRO A 143 90.150 58.130 27.220 1.00 0.15 A H
ATOM 1064 C PRO A 143 90.960 57.900 29.220 1.00 0.15 A C
ATOM 1065 O PRO A 143 91.100 56.720 29.000 1.00 0.15 A O
ATOM 1066 N GLU A 144 90.900 58.500 30.430 1.00 0.16 A N
ATOM 1067 H GLU A 144 90.600 59.470 30.460 1.00 0.16 A H
ATOM 1068 CA GLU A 144 91.230 57.810 31.690 1.00 0.16 A C
ATOM 1069 HA GLU A 144 92.120 57.200 31.550 1.00 0.16 A H
ATOM 1070 CB GLU A 144 91.570 58.830 32.790 1.00 0.16 A C
ATOM 1071 HB1 GLU A 144 92.430 59.430 32.530 1.00 0.16 A H
ATOM 1072 HB2 GLU A 144 91.840 58.290 33.690 1.00 0.16 A H
ATOM 1073 CG GLU A 144 90.430 59.750 33.120 1.00 0.16 A C
ATOM 1074 HG1 GLU A 144 90.430 59.830 34.200 1.00 0.16 A H
ATOM 1075 HG2 GLU A 144 89.510 59.320 32.720 1.00 0.16 A H
ATOM 1076 CD GLU A 144 90.610 61.120 32.540 1.00 0.16 A C
ATOM 1077 OE1 GLU A 144 91.100 61.150 31.350 1.00 0.16 A O
ATOM 1078 OE2 GLU A 144 90.360 62.180 33.190 1.00 0.16 A O
ATOM 1079 C GLU A 144 90.070 56.850 32.180 1.00 0.16 A C
ATOM 1080 O GLU A 144 90.340 55.930 32.970 1.00 0.16 A O
ATOM 1081 N LEU A 145 88.880 56.970 31.650 1.00 0.23 A N
ATOM 1082 H LEU A 145 88.800 57.810 31.090 1.00 0.23 A H
ATOM 1083 CA LEU A 145 87.780 55.940 31.720 1.00 0.23 A C
ATOM 1084 HA LEU A 145 87.550 55.880 32.780 1.00 0.23 A H
ATOM 1085 CB LEU A 145 86.580 56.540 30.980 1.00 0.23 A C
ATOM 1086 HB1 LEU A 145 86.810 56.400 29.930 1.00 0.23 A H
ATOM 1087 HB2 LEU A 145 86.570 57.620 31.160 1.00 0.23 A H
ATOM 1088 CG LEU A 145 85.100 56.220 31.140 1.00 0.23 A C
ATOM 1089 HG LEU A 145 84.760 56.510 32.130 1.00 0.23 A H
ATOM 1090 CD1 LEU A 145 84.230 57.030 30.190 1.00 0.23 A C
ATOM 1091 HD11 LEU A 145 83.230 56.630 30.390 1.00 0.23 A H
ATOM 1092 HD12 LEU A 145 84.410 58.080 30.400 1.00 0.23 A H
ATOM 1093 HD13 LEU A 145 84.480 56.860 29.140 1.00 0.23 A H
ATOM 1094 CD2 LEU A 145 84.870 54.770 30.970 1.00 0.23 A C
ATOM 1095 HD21 LEU A 145 85.420 54.170 31.700 1.00 0.23 A H
ATOM 1096 HD22 LEU A 145 83.790 54.610 31.100 1.00 0.23 A H
ATOM 1097 HD23 LEU A 145 85.230 54.460 29.980 1.00 0.23 A H
ATOM 1098 C LEU A 145 88.170 54.550 31.240 1.00 0.23 A C
ATOM 1099 O LEU A 145 87.760 53.520 31.840 1.00 0.23 A O
ATOM 1100 N TYR A 146 88.930 54.440 30.160 1.00 0.25 A N
ATOM 1101 H TYR A 146 89.150 55.250 29.590 1.00 0.25 A H
ATOM 1102 CA TYR A 146 89.190 53.150 29.460 1.00 0.25 A C
ATOM 1103 HA TYR A 146 88.370 52.440 29.460 1.00 0.25 A H
ATOM 1104 CB TYR A 146 89.250 53.450 27.950 1.00 0.25 A C
ATOM 1105 HB1 TYR A 146 89.310 52.480 27.430 1.00 0.25 A H
ATOM 1106 HB2 TYR A 146 90.180 53.990 27.810 1.00 0.25 A H
ATOM 1107 CG TYR A 146 88.050 54.180 27.410 1.00 0.25 A C
ATOM 1108 CD1 TYR A 146 87.910 55.610 27.390 1.00 0.25 A C
ATOM 1109 HD1 TYR A 146 88.770 56.140 27.760 1.00 0.25 A H
ATOM 1110 CE1 TYR A 146 86.680 56.220 26.920 1.00 0.25 A C
ATOM 1111 HE1 TYR A 146 86.560 57.290 27.030 1.00 0.25 A H
ATOM 1112 CZ TYR A 146 85.580 55.410 26.480 1.00 0.25 A C
ATOM 1113 OH TYR A 146 84.380 55.980 26.160 1.00 0.25 A O
ATOM 1114 HH TYR A 146 83.740 55.360 25.790 1.00 0.25 A H
ATOM 1115 CE2 TYR A 146 85.730 54.020 26.460 1.00 0.25 A C
ATOM 1116 HE2 TYR A 146 84.920 53.450 26.010 1.00 0.25 A H
ATOM 1117 CD2 TYR A 146 86.950 53.410 26.870 1.00 0.25 A C
ATOM 1118 HD2 TYR A 146 87.090 52.350 26.790 1.00 0.25 A H
ATOM 1119 C TYR A 146 90.500 52.530 29.990 1.00 0.25 A C
ATOM 1120 O TYR A 146 90.680 51.370 29.840 1.00 0.25 A O
ATOM 1121 N GLU A 147 91.380 53.300 30.600 1.00 0.30 A N
ATOM 1122 H GLU A 147 91.070 54.230 30.810 1.00 0.30 A H
ATOM 1123 CA GLU A 147 92.770 52.820 31.020 1.00 0.30 A C
ATOM 1124 HA GLU A 147 92.900 51.740 30.860 1.00 0.30 A H
ATOM 1125 CB GLU A 147 93.850 53.670 30.270 1.00 0.30 A C
ATOM 1126 HB1 GLU A 147 93.680 53.680 29.190 1.00 0.30 A H
ATOM 1127 HB2 GLU A 147 94.850 53.320 30.520 1.00 0.30 A H
ATOM 1128 CG GLU A 147 93.720 55.140 30.760 1.00 0.30 A C
ATOM 1129 HG1 GLU A 147 93.710 55.310 31.830 1.00 0.30 A H
ATOM 1130 HG2 GLU A 147 92.770 55.610 30.500 1.00 0.30 A H
ATOM 1131 CD GLU A 147 94.890 55.950 30.180 1.00 0.30 A C
ATOM 1132 OE1 GLU A 147 95.560 56.620 30.970 1.00 0.30 A O
ATOM 1133 OE2 GLU A 147 95.140 55.940 28.940 1.00 0.30 A O
ATOM 1134 C GLU A 147 93.050 52.840 32.550 1.00 0.30 A C
ATOM 1135 O GLU A 147 94.170 52.790 33.000 1.00 0.30 A O
ATOM 1136 N GLY A 148 92.000 52.850 33.420 1.00 0.26 A N
ATOM 1137 H GLY A 148 91.070 53.030 33.050 1.00 0.26 A H
ATOM 1138 CA GLY A 148 92.140 53.130 34.840 1.00 0.26 A C
ATOM 1139 HA1 GLY A 148 92.310 54.200 34.950 1.00 0.26 A H
ATOM 1140 HA2 GLY A 148 92.980 52.630 35.290 1.00 0.26 A H
ATOM 1141 C GLY A 148 90.910 52.670 35.700 1.00 0.26 A C
ATOM 1142 O GLY A 148 89.930 52.160 35.230 1.00 0.26 A O
ATOM 1143 N ARG A 149 90.880 52.950 37.030 1.00 0.43 A N
ATOM 1144 H ARG A 149 91.670 53.500 37.350 1.00 0.43 A H
ATOM 1145 CA ARG A 149 89.810 52.620 38.000 1.00 0.43 A C
ATOM 1146 HA ARG A 149 89.160 52.010 37.380 1.00 0.43 A H
ATOM 1147 CB ARG A 149 90.200 51.700 39.160 1.00 0.43 A C
ATOM 1148 HB1 ARG A 149 90.910 50.960 38.780 1.00 0.43 A H
ATOM 1149 HB2 ARG A 149 89.350 51.180 39.610 1.00 0.43 A H
ATOM 1150 CG ARG A 149 90.920 52.340 40.410 1.00 0.43 A C
ATOM 1151 HG1 ARG A 149 90.340 53.200 40.770 1.00 0.43 A H
ATOM 1152 HG2 ARG A 149 91.930 52.630 40.130 1.00 0.43 A H
ATOM 1153 CD ARG A 149 90.990 51.240 41.500 1.00 0.43 A C
ATOM 1154 HD1 ARG A 149 91.360 50.300 41.090 1.00 0.43 A H
ATOM 1155 HD2 ARG A 149 89.990 51.060 41.900 1.00 0.43 A H
ATOM 1156 NE ARG A 149 91.960 51.510 42.570 1.00 0.43 A N
ATOM 1157 HE ARG A 149 92.900 51.220 42.330 1.00 0.43 A H
ATOM 1158 CZ ARG A 149 91.760 51.870 43.850 1.00 0.43 A C
ATOM 1159 NH1 ARG A 149 90.660 52.390 44.260 1.00 0.43 A N
ATOM 1160 HH11 ARG A 149 89.950 52.690 43.610 1.00 0.43 A H
ATOM 1161 HH12 ARG A 149 90.610 52.600 45.250 1.00 0.43 A H
ATOM 1162 NH2 ARG A 149 92.800 51.770 44.660 1.00 0.43 A N
ATOM 1163 HH21 ARG A 149 93.720 51.470 44.380 1.00 0.43 A H
ATOM 1164 HH22 ARG A 149 92.540 51.770 45.640 1.00 0.43 A H
ATOM 1165 C ARG A 149 88.920 53.720 38.620 1.00 0.43 A C
ATOM 1166 O ARG A 149 87.840 53.540 39.070 1.00 0.43 A O
ATOM 1167 N GLU A 150 89.480 54.920 38.380 1.00 0.26 A N
ATOM 1168 H GLU A 150 90.470 54.910 38.180 1.00 0.26 A H
ATOM 1169 CA GLU A 150 88.900 56.150 38.980 1.00 0.26 A C
ATOM 1170 HA GLU A 150 88.230 55.750 39.740 1.00 0.26 A H
ATOM 1171 CB GLU A 150 89.960 57.020 39.720 1.00 0.26 A C
ATOM 1172 HB1 GLU A 150 90.340 56.550 40.640 1.00 0.26 A H
ATOM 1173 HB2 GLU A 150 89.430 57.940 39.930 1.00 0.26 A H
ATOM 1174 CG GLU A 150 91.010 57.420 38.740 1.00 0.26 A C
ATOM 1175 HG1 GLU A 150 90.480 57.960 37.960 1.00 0.26 A H
ATOM 1176 HG2 GLU A 150 91.480 56.560 38.260 1.00 0.26 A H
ATOM 1177 CD GLU A 150 91.980 58.360 39.490 1.00 0.26 A C
ATOM 1178 OE1 GLU A 150 92.300 59.400 38.990 1.00 0.26 A O
ATOM 1179 OE2 GLU A 150 92.370 58.020 40.630 1.00 0.26 A O
ATOM 1180 C GLU A 150 87.960 56.950 37.980 1.00 0.26 A C
ATOM 1181 O GLU A 150 87.240 57.760 38.470 1.00 0.26 A O
ATOM 1182 N GLY A 151 87.940 56.730 36.700 1.00 0.16 A N
ATOM 1183 H GLY A 151 88.600 56.050 36.340 1.00 0.16 A H
ATOM 1184 CA GLY A 151 87.010 57.450 35.820 1.00 0.16 A C
ATOM 1185 HA1 GLY A 151 86.180 57.680 36.490 1.00 0.16 A H
ATOM 1186 HA2 GLY A 151 86.640 56.830 34.990 1.00 0.16 A H
ATOM 1187 C GLY A 151 87.510 58.800 35.380 1.00 0.16 A C
ATOM 1188 O GLY A 151 88.520 59.310 35.870 1.00 0.16 A O
ATOM 1189 N PRO A 152 86.760 59.480 34.440 1.00 0.15 A N
ATOM 1190 CD PRO A 152 85.670 58.870 33.740 1.00 0.15 A C
ATOM 1191 HD1 PRO A 152 84.810 58.720 34.390 1.00 0.15 A H
ATOM 1192 HD2 PRO A 152 86.060 58.010 33.180 1.00 0.15 A H
ATOM 1193 CG PRO A 152 85.180 59.960 32.740 1.00 0.15 A C
ATOM 1194 HG1 PRO A 152 84.090 59.900 32.620 1.00 0.15 A H
ATOM 1195 HG2 PRO A 152 85.780 59.820 31.840 1.00 0.15 A H
ATOM 1196 CB PRO A 152 85.530 61.230 33.460 1.00 0.15 A C
ATOM 1197 HB1 PRO A 152 84.760 61.270 34.230 1.00 0.15 A H
ATOM 1198 HB2 PRO A 152 85.610 62.100 32.810 1.00 0.15 A H
ATOM 1199 CA PRO A 152 86.870 60.930 34.200 1.00 0.15 A C
ATOM 1200 HA PRO A 152 87.610 61.060 33.400 1.00 0.15 A H
ATOM 1201 C PRO A 152 87.060 61.820 35.410 1.00 0.15 A C
ATOM 1202 O PRO A 152 86.320 61.780 36.410 1.00 0.15 A O
ATOM 1203 N ALA A 153 88.090 62.670 35.420 1.00 0.11 A N
ATOM 1204 H ALA A 153 88.800 62.690 34.710 1.00 0.11 A H
ATOM 1205 CA ALA A 153 88.430 63.660 36.510 1.00 0.11 A C
ATOM 1206 HA ALA A 153 88.970 63.090 37.260 1.00 0.11 A H
ATOM 1207 CB ALA A 153 89.450 64.640 35.930 1.00 0.11 A C
ATOM 1208 HB1 ALA A 153 88.900 65.180 35.170 1.00 0.11 A H
ATOM 1209 HB2 ALA A 153 89.780 65.320 36.700 1.00 0.11 A H
ATOM 1210 HB3 ALA A 153 90.280 64.220 35.350 1.00 0.11 A H
ATOM 1211 C ALA A 153 87.310 64.490 37.240 1.00 0.11 A C
ATOM 1212 O ALA A 153 86.250 64.870 36.740 1.00 0.11 A O
ATOM 1213 N GLY A 154 87.600 65.000 38.470 1.00 0.10 A N
ATOM 1214 H GLY A 154 88.510 64.840 38.880 1.00 0.10 A H
ATOM 1215 CA GLY A 154 86.600 65.700 39.310 1.00 0.10 A C
ATOM 1216 HA1 GLY A 154 86.860 65.520 40.360 1.00 0.10 A H
ATOM 1217 HA2 GLY A 154 85.610 65.320 39.090 1.00 0.10 A H
ATOM 1218 C GLY A 154 86.540 67.230 38.980 1.00 0.10 A C
ATOM 1219 O GLY A 154 85.880 67.990 39.750 1.00 0.10 A O
ATOM 1220 N LEU A 155 87.170 67.660 37.840 1.00 0.10 A N
ATOM 1221 H LEU A 155 87.740 66.940 37.430 1.00 0.10 A H
ATOM 1222 CA LEU A 155 87.010 68.970 37.170 1.00 0.10 A C
ATOM 1223 HA LEU A 155 87.880 69.090 36.500 1.00 0.10 A H
ATOM 1224 CB LEU A 155 85.750 68.930 36.350 1.00 0.10 A C
ATOM 1225 HB1 LEU A 155 85.610 69.900 35.890 1.00 0.10 A H
ATOM 1226 HB2 LEU A 155 84.920 68.850 37.060 1.00 0.10 A H
ATOM 1227 CG LEU A 155 85.520 67.790 35.290 1.00 0.10 A C
ATOM 1228 HG LEU A 155 85.500 66.860 35.860 1.00 0.10 A H
ATOM 1229 CD1 LEU A 155 84.250 67.870 34.540 1.00 0.10 A C
ATOM 1230 HD11 LEU A 155 83.400 67.800 35.210 1.00 0.10 A H
ATOM 1231 HD12 LEU A 155 84.230 68.850 34.050 1.00 0.10 A H
ATOM 1232 HD13 LEU A 155 84.180 67.110 33.760 1.00 0.10 A H
ATOM 1233 CD2 LEU A 155 86.760 67.720 34.360 1.00 0.10 A C
ATOM 1234 HD21 LEU A 155 86.770 66.850 33.710 1.00 0.10 A H
ATOM 1235 HD22 LEU A 155 86.740 68.670 33.810 1.00 0.10 A H
ATOM 1236 HD23 LEU A 155 87.660 67.710 34.980 1.00 0.10 A H
ATOM 1237 C LEU A 155 87.220 70.180 38.140 1.00 0.10 A C
ATOM 1238 O LEU A 155 86.640 71.260 37.940 1.00 0.10 A O
ATOM 1239 N GLN A 156 87.870 70.030 39.180 1.00 0.20 A N
ATOM 1240 H GLN A 156 88.310 69.130 39.290 1.00 0.20 A H
ATOM 1241 CA GLN A 156 88.290 71.060 40.100 1.00 0.20 A C
ATOM 1242 HA GLN A 156 87.600 71.900 40.120 1.00 0.20 A H
ATOM 1243 CB GLN A 156 88.440 70.460 41.540 1.00 0.20 A C
ATOM 1244 HB1 GLN A 156 89.400 70.000 41.750 1.00 0.20 A H
ATOM 1245 HB2 GLN A 156 87.710 69.690 41.800 1.00 0.20 A H
ATOM 1246 CG GLN A 156 88.250 71.560 42.610 1.00 0.20 A C
ATOM 1247 HG1 GLN A 156 88.940 72.360 42.350 1.00 0.20 A H
ATOM 1248 HG2 GLN A 156 88.450 71.120 43.600 1.00 0.20 A H
ATOM 1249 CD GLN A 156 86.900 72.170 42.710 1.00 0.20 A C
ATOM 1250 OE1 GLN A 156 85.890 71.590 42.470 1.00 0.20 A O
ATOM 1251 NE2 GLN A 156 86.700 73.360 43.190 1.00 0.20 A N
ATOM 1252 HE21 GLN A 156 87.450 73.860 43.660 1.00 0.20 A H
ATOM 1253 HE22 GLN A 156 85.740 73.650 43.260 1.00 0.20 A H
ATOM 1254 C GLN A 156 89.590 71.700 39.640 1.00 0.20 A C
ATOM 1255 O GLN A 156 90.210 72.470 40.400 1.00 0.20 A O
ATOM 1256 N ASP A 157 90.130 71.190 38.530 1.00 0.15 A N
ATOM 1257 H ASP A 157 89.610 70.650 37.860 1.00 0.15 A H
ATOM 1258 CA ASP A 157 91.370 71.730 37.910 1.00 0.15 A C
ATOM 1259 HA ASP A 157 91.530 72.680 38.410 1.00 0.15 A H
ATOM 1260 CB ASP A 157 92.540 70.780 38.290 1.00 0.15 A C
ATOM 1261 HB1 ASP A 157 92.480 69.850 37.730 1.00 0.15 A H
ATOM 1262 HB2 ASP A 157 92.480 70.530 39.360 1.00 0.15 A H
ATOM 1263 CG ASP A 157 93.790 71.660 37.990 1.00 0.15 A C
ATOM 1264 OD1 ASP A 157 94.140 71.860 36.810 1.00 0.15 A O
ATOM 1265 OD2 ASP A 157 94.430 72.260 38.880 1.00 0.15 A O
ATOM 1266 C ASP A 157 91.260 72.040 36.380 1.00 0.15 A C
ATOM 1267 O ASP A 157 90.650 71.220 35.650 1.00 0.15 A O
ATOM 1268 N PHE A 158 91.540 73.280 35.980 1.00 0.24 A N
ATOM 1269 H PHE A 158 91.920 73.930 36.660 1.00 0.24 A H
ATOM 1270 CA PHE A 158 91.300 73.700 34.580 1.00 0.24 A C
ATOM 1271 HA PHE A 158 90.220 73.620 34.420 1.00 0.24 A H
ATOM 1272 CB PHE A 158 91.630 75.170 34.460 1.00 0.24 A C
ATOM 1273 HB1 PHE A 158 92.700 75.400 34.530 1.00 0.24 A H
ATOM 1274 HB2 PHE A 158 91.170 75.740 35.260 1.00 0.24 A H
ATOM 1275 CG PHE A 158 91.160 75.720 33.120 1.00 0.24 A C
ATOM 1276 CD1 PHE A 158 89.790 75.970 32.950 1.00 0.24 A C
ATOM 1277 HD1 PHE A 158 88.990 75.750 33.650 1.00 0.24 A H
ATOM 1278 CE1 PHE A 158 89.340 76.480 31.740 1.00 0.24 A C
ATOM 1279 HE1 PHE A 158 88.290 76.720 31.640 1.00 0.24 A H
ATOM 1280 CZ PHE A 158 90.180 76.660 30.620 1.00 0.24 A C
ATOM 1281 HZ PHE A 158 89.820 76.970 29.660 1.00 0.24 A H
ATOM 1282 CE2 PHE A 158 91.570 76.470 30.810 1.00 0.24 A C
ATOM 1283 HE2 PHE A 158 92.320 76.480 30.030 1.00 0.24 A H
ATOM 1284 CD2 PHE A 158 92.050 76.100 32.050 1.00 0.24 A C
ATOM 1285 HD2 PHE A 158 93.110 75.930 32.230 1.00 0.24 A H
ATOM 1286 C PHE A 158 92.060 72.760 33.550 1.00 0.24 A C
ATOM 1287 O PHE A 158 91.590 72.580 32.430 1.00 0.24 A O
ATOM 1288 N SER A 159 93.160 72.080 33.970 1.00 0.13 A N
ATOM 1289 H SER A 159 93.430 72.100 34.940 1.00 0.13 A H
ATOM 1290 CA SER A 159 93.790 71.010 33.190 1.00 0.13 A C
ATOM 1291 HA SER A 159 94.040 71.510 32.260 1.00 0.13 A H
ATOM 1292 CB SER A 159 95.100 70.700 33.910 1.00 0.13 A C
ATOM 1293 HB1 SER A 159 95.700 71.590 34.090 1.00 0.13 A H
ATOM 1294 HB2 SER A 159 95.590 69.900 33.340 1.00 0.13 A H
ATOM 1295 OG SER A 159 94.780 70.050 35.130 1.00 0.13 A O
ATOM 1296 HG SER A 159 94.640 70.730 35.780 1.00 0.13 A H
ATOM 1297 C SER A 159 92.920 69.770 32.950 1.00 0.13 A C
ATOM 1298 O SER A 159 93.240 69.060 32.040 1.00 0.13 A O
ATOM 1299 N ASP A 160 91.790 69.530 33.670 1.00 0.11 A N
ATOM 1300 H ASP A 160 91.480 70.170 34.400 1.00 0.11 A H
ATOM 1301 CA ASP A 160 90.800 68.540 33.230 1.00 0.11 A C
ATOM 1302 HA ASP A 160 91.170 67.860 32.470 1.00 0.11 A H
ATOM 1303 CB ASP A 160 90.510 67.510 34.380 1.00 0.11 A C
ATOM 1304 HB1 ASP A 160 90.010 66.630 33.990 1.00 0.11 A H
ATOM 1305 HB2 ASP A 160 89.900 67.970 35.170 1.00 0.11 A H
ATOM 1306 CG ASP A 160 91.770 67.020 35.050 1.00 0.11 A C
ATOM 1307 OD1 ASP A 160 91.940 67.210 36.280 1.00 0.11 A O
ATOM 1308 OD2 ASP A 160 92.530 66.320 34.320 1.00 0.11 A O
ATOM 1309 C ASP A 160 89.500 69.190 32.640 1.00 0.11 A C
ATOM 1310 O ASP A 160 88.880 68.710 31.750 1.00 0.11 A O
ATOM 1311 N VAL A 161 89.210 70.460 32.990 1.00 0.08 A N
ATOM 1312 H VAL A 161 89.670 70.650 33.880 1.00 0.08 A H
ATOM 1313 CA VAL A 161 88.150 71.260 32.430 1.00 0.08 A C
ATOM 1314 HA VAL A 161 87.250 70.650 32.460 1.00 0.08 A H
ATOM 1315 CB VAL A 161 87.750 72.540 33.210 1.00 0.08 A C
ATOM 1316 HB VAL A 161 88.480 73.350 33.160 1.00 0.08 A H
ATOM 1317 CG1 VAL A 161 86.520 73.140 32.500 1.00 0.08 A C
ATOM 1318 HG11 VAL A 161 86.120 74.000 33.020 1.00 0.08 A H
ATOM 1319 HG12 VAL A 161 86.820 73.440 31.500 1.00 0.08 A H
ATOM 1320 HG13 VAL A 161 85.770 72.350 32.410 1.00 0.08 A H
ATOM 1321 CG2 VAL A 161 87.520 72.200 34.690 1.00 0.08 A C
ATOM 1322 HG21 VAL A 161 86.950 72.980 35.190 1.00 0.08 A H
ATOM 1323 HG22 VAL A 161 86.930 71.280 34.690 1.00 0.08 A H
ATOM 1324 HG23 VAL A 161 88.370 72.060 35.340 1.00 0.08 A H
ATOM 1325 C VAL A 161 88.440 71.500 30.890 1.00 0.08 A C
ATOM 1326 O VAL A 161 87.500 71.430 30.120 1.00 0.08 A O
ATOM 1327 N GLU A 162 89.710 71.810 30.590 1.00 0.17 A N
ATOM 1328 H GLU A 162 90.470 71.960 31.230 1.00 0.17 A H
ATOM 1329 CA GLU A 162 90.070 71.960 29.140 1.00 0.17 A C
ATOM 1330 HA GLU A 162 89.460 72.780 28.790 1.00 0.17 A H
ATOM 1331 CB GLU A 162 91.480 72.550 28.970 1.00 0.17 A C
ATOM 1332 HB1 GLU A 162 91.540 73.390 29.670 1.00 0.17 A H
ATOM 1333 HB2 GLU A 162 91.540 72.960 27.960 1.00 0.17 A H
ATOM 1334 CG GLU A 162 92.730 71.670 29.290 1.00 0.17 A C
ATOM 1335 HG1 GLU A 162 92.750 70.780 28.650 1.00 0.17 A H
ATOM 1336 HG2 GLU A 162 92.580 71.220 30.260 1.00 0.17 A H
ATOM 1337 CD GLU A 162 94.080 72.370 29.100 1.00 0.17 A C
ATOM 1338 OE1 GLU A 162 94.890 72.280 30.070 1.00 0.17 A O
ATOM 1339 OE2 GLU A 162 94.210 73.240 28.200 1.00 0.17 A O
ATOM 1340 C GLU A 162 89.970 70.690 28.310 1.00 0.17 A C
ATOM 1341 O GLU A 162 89.950 70.680 27.120 1.00 0.17 A O
ATOM 1342 N ARG A 163 90.020 69.540 28.990 1.00 0.11 A N
ATOM 1343 H ARG A 163 90.020 69.640 30.000 1.00 0.11 A H
ATOM 1344 CA ARG A 163 89.840 68.190 28.410 1.00 0.11 A C
ATOM 1345 HA ARG A 163 90.250 68.220 27.400 1.00 0.11 A H
ATOM 1346 CB ARG A 163 90.660 67.150 29.230 1.00 0.11 A C
ATOM 1347 HB1 ARG A 163 90.490 66.150 28.790 1.00 0.11 A H
ATOM 1348 HB2 ARG A 163 90.270 67.020 30.230 1.00 0.11 A H
ATOM 1349 CG ARG A 163 92.180 67.430 29.160 1.00 0.11 A C
ATOM 1350 HG1 ARG A 163 92.530 68.410 29.510 1.00 0.11 A H
ATOM 1351 HG2 ARG A 163 92.450 67.490 28.110 1.00 0.11 A H
ATOM 1352 CD ARG A 163 92.980 66.340 29.750 1.00 0.11 A C
ATOM 1353 HD1 ARG A 163 93.970 66.780 29.890 1.00 0.11 A H
ATOM 1354 HD2 ARG A 163 93.130 65.570 28.980 1.00 0.11 A H
ATOM 1355 NE ARG A 163 92.490 65.870 31.090 1.00 0.11 A N
ATOM 1356 HE ARG A 163 92.660 66.460 31.890 1.00 0.11 A H
ATOM 1357 CZ ARG A 163 91.850 64.680 31.270 1.00 0.11 A C
ATOM 1358 NH1 ARG A 163 91.560 63.750 30.360 1.00 0.11 A N
ATOM 1359 HH11 ARG A 163 91.610 63.900 29.360 1.00 0.11 A H
ATOM 1360 HH12 ARG A 163 91.310 62.830 30.660 1.00 0.11 A H
ATOM 1361 NH2 ARG A 163 91.730 64.390 32.560 1.00 0.11 A N
ATOM 1362 HH21 ARG A 163 91.940 65.100 33.230 1.00 0.11 A H
ATOM 1363 HH22 ARG A 163 91.320 63.480 32.780 1.00 0.11 A H
ATOM 1364 C ARG A 163 88.380 67.850 28.280 1.00 0.11 A C
ATOM 1365 O ARG A 163 87.930 67.490 27.210 1.00 0.11 A O
ATOM 1366 N PHE A 164 87.580 68.060 29.300 1.00 0.09 A N
ATOM 1367 H PHE A 164 87.970 68.190 30.220 1.00 0.09 A H
ATOM 1368 CA PHE A 164 86.100 68.110 29.300 1.00 0.09 A C
ATOM 1369 HA PHE A 164 85.680 67.150 29.010 1.00 0.09 A H
ATOM 1370 CB PHE A 164 85.550 68.380 30.760 1.00 0.09 A C
ATOM 1371 HB1 PHE A 164 86.190 69.150 31.200 1.00 0.09 A H
ATOM 1372 HB2 PHE A 164 85.740 67.440 31.280 1.00 0.09 A H
ATOM 1373 CG PHE A 164 84.130 68.790 30.940 1.00 0.09 A C
ATOM 1374 CD1 PHE A 164 83.730 70.130 30.940 1.00 0.09 A C
ATOM 1375 HD1 PHE A 164 84.480 70.910 30.940 1.00 0.09 A H
ATOM 1376 CE1 PHE A 164 82.360 70.470 31.120 1.00 0.09 A C
ATOM 1377 HE1 PHE A 164 82.010 71.480 31.160 1.00 0.09 A H
ATOM 1378 CZ PHE A 164 81.410 69.360 31.190 1.00 0.09 A C
ATOM 1379 HZ PHE A 164 80.360 69.530 31.360 1.00 0.09 A H
ATOM 1380 CE2 PHE A 164 81.860 67.980 31.170 1.00 0.09 A C
ATOM 1381 HE2 PHE A 164 81.190 67.150 31.340 1.00 0.09 A H
ATOM 1382 CD2 PHE A 164 83.190 67.740 31.100 1.00 0.09 A C
ATOM 1383 HD2 PHE A 164 83.530 66.730 31.170 1.00 0.09 A H
ATOM 1384 C PHE A 164 85.500 69.060 28.250 1.00 0.09 A C
ATOM 1385 O PHE A 164 84.820 68.550 27.390 1.00 0.09 A O
ATOM 1386 N ILE A 165 85.710 70.350 28.310 1.00 0.09 A N
ATOM 1387 H ILE A 165 86.240 70.650 29.120 1.00 0.09 A H
ATOM 1388 CA ILE A 165 85.280 71.280 27.290 1.00 0.09 A C
ATOM 1389 HA ILE A 165 84.210 71.450 27.260 1.00 0.09 A H
ATOM 1390 CB ILE A 165 85.790 72.790 27.570 1.00 0.09 A C
ATOM 1391 HB ILE A 165 86.850 72.700 27.820 1.00 0.09 A H
ATOM 1392 CG2 ILE A 165 85.630 73.790 26.370 1.00 0.09 A C
ATOM 1393 HG21 ILE A 165 86.260 73.570 25.510 1.00 0.09 A H
ATOM 1394 HG22 ILE A 165 84.570 73.870 26.180 1.00 0.09 A H
ATOM 1395 HG23 ILE A 165 86.040 74.760 26.660 1.00 0.09 A H
ATOM 1396 CG1 ILE A 165 85.100 73.410 28.740 1.00 0.09 A C
ATOM 1397 HG11 ILE A 165 85.200 72.710 29.580 1.00 0.09 A H
ATOM 1398 HG12 ILE A 165 84.030 73.420 28.590 1.00 0.09 A H
ATOM 1399 CD ILE A 165 85.600 74.770 29.310 1.00 0.09 A C
ATOM 1400 HD1 ILE A 165 86.630 74.670 29.640 1.00 0.09 A H
ATOM 1401 HD2 ILE A 165 85.410 75.630 28.650 1.00 0.09 A H
ATOM 1402 HD3 ILE A 165 85.040 74.990 30.220 1.00 0.09 A H
ATOM 1403 C ILE A 165 85.620 70.790 25.820 1.00 0.09 A C
ATOM 1404 O ILE A 165 84.890 71.080 24.870 1.00 0.09 A O
ATOM 1405 N HIS A 166 86.760 70.080 25.620 1.00 0.16 A N
ATOM 1406 H HIS A 166 87.300 69.790 26.430 1.00 0.16 A H
ATOM 1407 CA HIS A 166 87.070 69.580 24.310 1.00 0.16 A C
ATOM 1408 HA HIS A 166 86.700 70.250 23.540 1.00 0.16 A H
ATOM 1409 CB HIS A 166 88.610 69.450 24.220 1.00 0.16 A C
ATOM 1410 HB1 HIS A 166 88.870 68.710 24.990 1.00 0.16 A H
ATOM 1411 HB2 HIS A 166 89.050 70.410 24.420 1.00 0.16 A H
ATOM 1412 CG HIS A 166 89.000 68.740 22.980 1.00 0.16 A C
ATOM 1413 ND1 HIS A 166 89.130 67.350 22.800 1.00 0.16 A N
ATOM 1414 CE1 HIS A 166 89.370 67.160 21.480 1.00 0.16 A C
ATOM 1415 HE1 HIS A 166 89.680 66.240 21.000 1.00 0.16 A H
ATOM 1416 NE2 HIS A 166 89.470 68.330 20.870 1.00 0.16 A N
ATOM 1417 HE2 HIS A 166 89.630 68.410 19.880 1.00 0.16 A H
ATOM 1418 CD2 HIS A 166 89.260 69.360 21.780 1.00 0.16 A C
ATOM 1419 HD2 HIS A 166 89.260 70.420 21.560 1.00 0.16 A H
ATOM 1420 C HIS A 166 86.320 68.290 24.000 1.00 0.16 A C
ATOM 1421 O HIS A 166 85.660 68.230 22.980 1.00 0.16 A O
ATOM 1422 N ASN A 167 86.310 67.290 24.880 1.00 0.18 A N
ATOM 1423 H ASN A 167 86.900 67.420 25.700 1.00 0.18 A H
ATOM 1424 CA ASN A 167 85.700 66.040 24.650 1.00 0.18 A C
ATOM 1425 HA ASN A 167 86.270 65.620 23.810 1.00 0.18 A H
ATOM 1426 CB ASN A 167 86.100 65.040 25.800 1.00 0.18 A C
ATOM 1427 HB1 ASN A 167 85.870 65.450 26.780 1.00 0.18 A H
ATOM 1428 HB2 ASN A 167 87.160 64.820 25.710 1.00 0.18 A H
ATOM 1429 CG ASN A 167 85.330 63.710 25.730 1.00 0.18 A C
ATOM 1430 OD1 ASN A 167 84.850 63.230 26.770 1.00 0.18 A O
ATOM 1431 ND2 ASN A 167 85.000 63.030 24.660 1.00 0.18 A N
ATOM 1432 HD21 ASN A 167 85.290 63.200 23.700 1.00 0.18 A H
ATOM 1433 HD22 ASN A 167 84.410 62.220 24.780 1.00 0.18 A H
ATOM 1434 C ASN A 167 84.220 66.100 24.310 1.00 0.18 A C
ATOM 1435 O ASN A 167 83.790 65.540 23.330 1.00 0.18 A O
ATOM 1436 N GLU A 168 83.490 66.800 25.210 1.00 0.13 A N
ATOM 1437 H GLU A 168 83.950 67.340 25.930 1.00 0.13 A H
ATOM 1438 CA GLU A 168 82.070 67.130 25.010 1.00 0.13 A C
ATOM 1439 HA GLU A 168 81.600 66.160 24.780 1.00 0.13 A H
ATOM 1440 CB GLU A 168 81.480 67.490 26.430 1.00 0.13 A C
ATOM 1441 HB1 GLU A 168 80.410 67.750 26.340 1.00 0.13 A H
ATOM 1442 HB2 GLU A 168 82.010 68.360 26.840 1.00 0.13 A H
ATOM 1443 CG GLU A 168 81.650 66.390 27.470 1.00 0.13 A C
ATOM 1444 HG1 GLU A 168 81.120 66.730 28.350 1.00 0.13 A H
ATOM 1445 HG2 GLU A 168 82.700 66.270 27.720 1.00 0.13 A H
ATOM 1446 CD GLU A 168 80.870 65.100 27.110 1.00 0.13 A C
ATOM 1447 OE1 GLU A 168 79.960 65.200 26.230 1.00 0.13 A O
ATOM 1448 OE2 GLU A 168 81.030 64.030 27.740 1.00 0.13 A O
ATOM 1449 C GLU A 168 81.750 68.160 23.910 1.00 0.13 A C
ATOM 1450 O GLU A 168 80.570 68.380 23.640 1.00 0.13 A O
ATOM 1451 N GLY A 169 82.750 68.760 23.220 1.00 0.11 A N
ATOM 1452 H GLY A 169 83.700 68.420 23.290 1.00 0.11 A H
ATOM 1453 CA GLY A 169 82.440 69.630 22.100 1.00 0.11 A C
ATOM 1454 HA1 GLY A 169 81.740 69.110 21.430 1.00 0.11 A H
ATOM 1455 HA2 GLY A 169 83.430 69.880 21.710 1.00 0.11 A H
ATOM 1456 C GLY A 169 81.670 70.940 22.550 1.00 0.11 A C
ATOM 1457 O GLY A 169 80.770 71.380 21.880 1.00 0.11 A O
ATOM 1458 N LEU A 170 81.990 71.530 23.730 1.00 0.09 A N
ATOM 1459 H LEU A 170 82.680 71.040 24.270 1.00 0.09 A H
ATOM 1460 CA LEU A 170 81.560 72.790 24.220 1.00 0.09 A C
ATOM 1461 HA LEU A 170 80.580 72.920 23.770 1.00 0.09 A H
ATOM 1462 CB LEU A 170 81.520 72.730 25.810 1.00 0.09 A C
ATOM 1463 HB1 LEU A 170 81.230 73.690 26.250 1.00 0.09 A H
ATOM 1464 HB2 LEU A 170 82.550 72.570 26.120 1.00 0.09 A H
ATOM 1465 CG LEU A 170 80.760 71.570 26.380 1.00 0.09 A C
ATOM 1466 HG LEU A 170 81.110 70.650 25.930 1.00 0.09 A H
ATOM 1467 CD1 LEU A 170 80.850 71.520 27.950 1.00 0.09 A C
ATOM 1468 HD11 LEU A 170 80.530 70.540 28.310 1.00 0.09 A H
ATOM 1469 HD12 LEU A 170 81.890 71.500 28.270 1.00 0.09 A H
ATOM 1470 HD13 LEU A 170 80.380 72.390 28.390 1.00 0.09 A H
ATOM 1471 CD2 LEU A 170 79.260 71.710 26.120 1.00 0.09 A C
ATOM 1472 HD21 LEU A 170 78.730 70.870 26.580 1.00 0.09 A H
ATOM 1473 HD22 LEU A 170 78.840 72.590 26.610 1.00 0.09 A H
ATOM 1474 HD23 LEU A 170 78.910 71.830 25.090 1.00 0.09 A H
ATOM 1475 C LEU A 170 82.410 74.030 23.840 1.00 0.09 A C
ATOM 1476 O LEU A 170 83.530 73.860 23.440 1.00 0.09 A O
ATOM 1477 N THR A 171 81.860 75.260 23.850 1.00 0.09 A N
ATOM 1478 H THR A 171 80.890 75.230 24.140 1.00 0.09 A H
ATOM 1479 CA THR A 171 82.500 76.620 23.870 1.00 0.09 A C
ATOM 1480 HA THR A 171 83.540 76.510 24.180 1.00 0.09 A H
ATOM 1481 CB THR A 171 82.390 77.430 22.540 1.00 0.09 A C
ATOM 1482 HB THR A 171 81.370 77.810 22.410 1.00 0.09 A H
ATOM 1483 CG2 THR A 171 83.420 78.540 22.360 1.00 0.09 A C
ATOM 1484 HG21 THR A 171 84.280 78.230 22.950 1.00 0.09 A H
ATOM 1485 HG22 THR A 171 83.560 78.650 21.290 1.00 0.09 A H
ATOM 1486 HG23 THR A 171 82.900 79.440 22.680 1.00 0.09 A H
ATOM 1487 OG1 THR A 171 82.580 76.490 21.470 1.00 0.09 A O
ATOM 1488 HG1 THR A 171 81.820 75.910 21.440 1.00 0.09 A H
ATOM 1489 C THR A 171 81.800 77.560 24.900 1.00 0.09 A C
ATOM 1490 O THR A 171 80.560 77.360 25.200 1.00 0.09 A O
ATOM 1491 N ARG A 172 82.470 78.540 25.490 1.00 0.21 A N
ATOM 1492 H ARG A 172 83.420 78.720 25.210 1.00 0.21 A H
ATOM 1493 CA ARG A 172 81.810 79.410 26.460 1.00 0.21 A C
ATOM 1494 HA ARG A 172 81.010 78.870 26.970 1.00 0.21 A H
ATOM 1495 CB ARG A 172 82.810 79.840 27.510 1.00 0.21 A C
ATOM 1496 HB1 ARG A 172 83.540 79.040 27.660 1.00 0.21 A H
ATOM 1497 HB2 ARG A 172 82.280 79.940 28.460 1.00 0.21 A H
ATOM 1498 CG ARG A 172 83.540 81.140 27.190 1.00 0.21 A C
ATOM 1499 HG1 ARG A 172 82.790 81.940 27.320 1.00 0.21 A H
ATOM 1500 HG2 ARG A 172 83.870 81.010 26.160 1.00 0.21 A H
ATOM 1501 CD ARG A 172 84.740 81.460 28.040 1.00 0.21 A C
ATOM 1502 HD1 ARG A 172 85.330 80.580 27.810 1.00 0.21 A H
ATOM 1503 HD2 ARG A 172 84.540 81.450 29.120 1.00 0.21 A H
ATOM 1504 NE ARG A 172 85.330 82.740 27.700 1.00 0.21 A N
ATOM 1505 HE ARG A 172 86.250 82.720 27.270 1.00 0.21 A H
ATOM 1506 CZ ARG A 172 84.890 83.920 27.970 1.00 0.21 A C
ATOM 1507 NH1 ARG A 172 83.830 84.140 28.740 1.00 0.21 A N
ATOM 1508 HH11 ARG A 172 83.280 83.460 29.250 1.00 0.21 A H
ATOM 1509 HH12 ARG A 172 83.480 85.070 28.840 1.00 0.21 A H
ATOM 1510 NH2 ARG A 172 85.460 85.030 27.530 1.00 0.21 A N
ATOM 1511 HH21 ARG A 172 86.050 84.830 26.740 1.00 0.21 A H
ATOM 1512 HH22 ARG A 172 84.990 85.920 27.640 1.00 0.21 A H
ATOM 1513 C ARG A 172 80.920 80.500 25.860 1.00 0.21 A C
ATOM 1514 O ARG A 172 81.190 81.090 24.790 1.00 0.21 A O
ATOM 1515 N VAL A 173 79.840 80.840 26.520 1.00 0.09 A N
ATOM 1516 H VAL A 173 79.670 80.430 27.430 1.00 0.09 A H
ATOM 1517 CA VAL A 173 79.000 82.040 26.270 1.00 0.09 A C
ATOM 1518 HA VAL A 173 78.770 82.090 25.210 1.00 0.09 A H
ATOM 1519 CB VAL A 173 77.730 82.000 27.090 1.00 0.09 A C
ATOM 1520 HB VAL A 173 78.010 81.800 28.120 1.00 0.09 A H
ATOM 1521 CG1 VAL A 173 76.860 83.280 26.950 1.00 0.09 A C
ATOM 1522 HG11 VAL A 173 76.910 83.460 25.870 1.00 0.09 A H
ATOM 1523 HG12 VAL A 173 75.870 83.120 27.370 1.00 0.09 A H
ATOM 1524 HG13 VAL A 173 77.330 84.090 27.500 1.00 0.09 A H
ATOM 1525 CG2 VAL A 173 76.940 80.850 26.500 1.00 0.09 A C
ATOM 1526 HG21 VAL A 173 76.610 81.030 25.480 1.00 0.09 A H
ATOM 1527 HG22 VAL A 173 77.460 79.890 26.630 1.00 0.09 A H
ATOM 1528 HG23 VAL A 173 76.000 80.810 27.040 1.00 0.09 A H
ATOM 1529 C VAL A 173 79.840 83.300 26.580 1.00 0.09 A C
ATOM 1530 O VAL A 173 80.600 83.220 27.520 1.00 0.09 A O
ATOM 1531 N ASP A 174 79.660 84.420 25.890 1.00 0.16 A N
ATOM 1532 H ASP A 174 78.860 84.440 25.280 1.00 0.16 A H
ATOM 1533 CA ASP A 174 80.340 85.710 26.200 1.00 0.16 A C
ATOM 1534 HA ASP A 174 81.360 85.520 26.560 1.00 0.16 A H
ATOM 1535 CB ASP A 174 80.600 86.560 24.930 1.00 0.16 A C
ATOM 1536 HB1 ASP A 174 79.650 86.920 24.540 1.00 0.16 A H
ATOM 1537 HB2 ASP A 174 81.200 86.070 24.160 1.00 0.16 A H
ATOM 1538 CG ASP A 174 81.420 87.900 25.250 1.00 0.16 A C
ATOM 1539 OD1 ASP A 174 82.120 88.500 24.380 1.00 0.16 A O
ATOM 1540 OD2 ASP A 174 81.540 88.320 26.450 1.00 0.16 A O
ATOM 1541 C ASP A 174 79.450 86.400 27.290 1.00 0.16 A C
ATOM 1542 O ASP A 174 78.330 86.790 27.100 1.00 0.16 A O
ATOM 1543 N LEU A 175 80.050 86.700 28.460 1.00 0.12 A N
ATOM 1544 H LEU A 175 81.030 86.500 28.590 1.00 0.12 A H
ATOM 1545 CA LEU A 175 79.390 87.250 29.640 1.00 0.12 A C
ATOM 1546 HA LEU A 175 78.350 86.990 29.490 1.00 0.12 A H
ATOM 1547 CB LEU A 175 80.010 86.630 30.900 1.00 0.12 A C
ATOM 1548 HB1 LEU A 175 79.490 87.040 31.770 1.00 0.12 A H
ATOM 1549 HB2 LEU A 175 81.020 86.990 31.060 1.00 0.12 A H
ATOM 1550 CG LEU A 175 80.010 85.120 31.090 1.00 0.12 A C
ATOM 1551 HG LEU A 175 80.560 84.660 30.270 1.00 0.12 A H
ATOM 1552 CD1 LEU A 175 80.780 84.770 32.350 1.00 0.12 A C
ATOM 1553 HD11 LEU A 175 80.300 85.220 33.220 1.00 0.12 A H
ATOM 1554 HD12 LEU A 175 80.850 83.690 32.530 1.00 0.12 A H
ATOM 1555 HD13 LEU A 175 81.790 85.180 32.410 1.00 0.12 A H
ATOM 1556 CD2 LEU A 175 78.600 84.570 31.130 1.00 0.12 A C
ATOM 1557 HD21 LEU A 175 78.630 83.490 31.010 1.00 0.12 A H
ATOM 1558 HD22 LEU A 175 78.090 84.750 32.070 1.00 0.12 A H
ATOM 1559 HD23 LEU A 175 78.070 85.050 30.310 1.00 0.12 A H
ATOM 1560 C LEU A 175 79.410 88.780 29.550 1.00 0.12 A C
ATOM 1561 O LEU A 175 80.360 89.380 29.080 1.00 0.12 A O
ATOM 1562 N PRO A 176 78.360 89.520 30.000 1.00 0.12 A N
ATOM 1563 CD PRO A 176 77.030 89.070 30.370 1.00 0.12 A C
ATOM 1564 HD1 PRO A 176 77.050 88.330 31.170 1.00 0.12 A H
ATOM 1565 HD2 PRO A 176 76.570 88.720 29.440 1.00 0.12 A H
ATOM 1566 CG PRO A 176 76.340 90.350 30.810 1.00 0.12 A C
ATOM 1567 HG1 PRO A 176 76.530 90.380 31.890 1.00 0.12 A H
ATOM 1568 HG2 PRO A 176 75.260 90.260 30.760 1.00 0.12 A H
ATOM 1569 CB PRO A 176 76.940 91.440 29.980 1.00 0.12 A C
ATOM 1570 HB1 PRO A 176 76.870 92.380 30.540 1.00 0.12 A H
ATOM 1571 HB2 PRO A 176 76.460 91.560 29.010 1.00 0.12 A H
ATOM 1572 CA PRO A 176 78.430 90.990 29.950 1.00 0.12 A C
ATOM 1573 HA PRO A 176 78.890 91.250 29.000 1.00 0.12 A H
ATOM 1574 C PRO A 176 79.220 91.420 31.100 1.00 0.12 A C
ATOM 1575 O PRO A 176 79.150 90.890 32.200 1.00 0.12 A O
ATOM 1576 N ASP A 177 79.900 92.530 30.930 1.00 0.24 A N
ATOM 1577 H ASP A 177 79.740 93.050 30.080 1.00 0.24 A H
ATOM 1578 CA ASP A 177 80.540 93.220 32.030 1.00 0.24 A C
ATOM 1579 HA ASP A 177 81.380 92.600 32.330 1.00 0.24 A H
ATOM 1580 CB ASP A 177 81.150 94.470 31.670 1.00 0.24 A C
ATOM 1581 HB1 ASP A 177 81.940 94.090 31.020 1.00 0.24 A H
ATOM 1582 HB2 ASP A 177 81.760 94.910 32.450 1.00 0.24 A H
ATOM 1583 CG ASP A 177 80.240 95.500 31.000 1.00 0.24 A C
ATOM 1584 OD1 ASP A 177 79.680 95.180 29.910 1.00 0.24 A O
ATOM 1585 OD2 ASP A 177 79.940 96.510 31.670 1.00 0.24 A O
ATOM 1586 C ASP A 177 79.620 93.650 33.170 1.00 0.24 A C
ATOM 1587 O ASP A 177 80.080 93.730 34.280 1.00 0.24 A O
ATOM 1588 N ASN A 178 78.360 94.050 32.930 1.00 0.21 A N
ATOM 1589 H ASN A 178 78.160 94.130 31.940 1.00 0.21 A H
ATOM 1590 CA ASN A 178 77.390 94.510 33.890 1.00 0.21 A C
ATOM 1591 HA ASN A 178 77.960 95.100 34.610 1.00 0.21 A H
ATOM 1592 CB ASN A 178 76.360 95.430 33.170 1.00 0.21 A C
ATOM 1593 HB1 ASN A 178 75.490 94.830 32.910 1.00 0.21 A H
ATOM 1594 HB2 ASN A 178 76.740 95.850 32.240 1.00 0.21 A H
ATOM 1595 CG ASN A 178 75.890 96.480 34.180 1.00 0.21 A C
ATOM 1596 OD1 ASN A 178 74.740 96.780 34.330 1.00 0.21 A O
ATOM 1597 ND2 ASN A 178 76.790 97.340 34.690 1.00 0.21 A N
ATOM 1598 HD21 ASN A 178 77.730 97.060 34.480 1.00 0.21 A H
ATOM 1599 HD22 ASN A 178 76.410 98.040 35.320 1.00 0.21 A H
ATOM 1600 C ASN A 178 76.700 93.370 34.660 1.00 0.21 A C
ATOM 1601 O ASN A 178 75.930 93.670 35.560 1.00 0.21 A O
ATOM 1602 N GLU A 179 77.070 92.150 34.470 1.00 0.19 A N
ATOM 1603 H GLU A 179 77.820 92.070 33.810 1.00 0.19 A H
ATOM 1604 CA GLU A 179 76.640 90.990 35.350 1.00 0.19 A C
ATOM 1605 HA GLU A 179 76.780 90.120 34.710 1.00 0.19 A H
ATOM 1606 CB GLU A 179 77.540 90.880 36.540 1.00 0.19 A C
ATOM 1607 HB1 GLU A 179 77.230 89.920 36.930 1.00 0.19 A H
ATOM 1608 HB2 GLU A 179 77.330 91.530 37.380 1.00 0.19 A H
ATOM 1609 CG GLU A 179 79.060 90.700 36.300 1.00 0.19 A C
ATOM 1610 HG1 GLU A 179 79.490 91.600 35.840 1.00 0.19 A H
ATOM 1611 HG2 GLU A 179 79.270 89.920 35.580 1.00 0.19 A H
ATOM 1612 CD GLU A 179 79.820 90.230 37.600 1.00 0.19 A C
ATOM 1613 OE1 GLU A 179 81.030 89.910 37.470 1.00 0.19 A O
ATOM 1614 OE2 GLU A 179 79.300 90.290 38.740 1.00 0.19 A O
ATOM 1615 C GLU A 179 75.130 90.940 35.640 1.00 0.19 A C
ATOM 1616 O GLU A 179 74.720 90.210 36.580 1.00 0.19 A O
ATOM 1617 N ARG A 180 74.230 91.530 34.830 1.00 0.25 A N
ATOM 1618 H ARG A 180 74.510 92.260 34.190 1.00 0.25 A H
ATOM 1619 CA ARG A 180 72.810 91.230 34.860 1.00 0.25 A C
ATOM 1620 HA ARG A 180 72.620 90.350 35.470 1.00 0.25 A H
ATOM 1621 CB ARG A 180 71.980 92.390 35.590 1.00 0.25 A C
ATOM 1622 HB1 ARG A 180 72.270 93.390 35.270 1.00 0.25 A H
ATOM 1623 HB2 ARG A 180 72.310 92.370 36.620 1.00 0.25 A H
ATOM 1624 CG ARG A 180 70.470 92.190 35.500 1.00 0.25 A C
ATOM 1625 HG1 ARG A 180 70.080 91.530 36.280 1.00 0.25 A H
ATOM 1626 HG2 ARG A 180 70.060 91.930 34.520 1.00 0.25 A H
ATOM 1627 CD ARG A 180 69.890 93.560 35.900 1.00 0.25 A C
ATOM 1628 HD1 ARG A 180 70.220 94.230 35.100 1.00 0.25 A H
ATOM 1629 HD2 ARG A 180 70.260 93.940 36.860 1.00 0.25 A H
ATOM 1630 NE ARG A 180 68.470 93.410 36.060 1.00 0.25 A N
ATOM 1631 HE ARG A 180 68.120 92.980 36.910 1.00 0.25 A H
ATOM 1632 CZ ARG A 180 67.580 93.770 35.160 1.00 0.25 A C
ATOM 1633 NH1 ARG A 180 67.880 94.370 34.050 1.00 0.25 A N
ATOM 1634 HH11 ARG A 180 68.850 94.450 33.810 1.00 0.25 A H
ATOM 1635 HH12 ARG A 180 67.090 94.570 33.450 1.00 0.25 A H
ATOM 1636 NH2 ARG A 180 66.330 93.560 35.420 1.00 0.25 A N
ATOM 1637 HH21 ARG A 180 66.120 92.920 36.180 1.00 0.25 A H
ATOM 1638 HH22 ARG A 180 65.660 93.720 34.680 1.00 0.25 A H
ATOM 1639 C ARG A 180 72.240 90.890 33.550 1.00 0.25 A C
ATOM 1640 O ARG A 180 72.160 91.760 32.640 1.00 0.25 A O
ATOM 1641 N PHE A 181 71.850 89.620 33.370 1.00 0.09 A N
ATOM 1642 H PHE A 181 71.970 88.970 34.130 1.00 0.09 A H
ATOM 1643 CA PHE A 181 71.010 89.110 32.290 1.00 0.09 A C
ATOM 1644 HA PHE A 181 71.450 89.560 31.390 1.00 0.09 A H
ATOM 1645 CB PHE A 181 71.230 87.560 32.220 1.00 0.09 A C
ATOM 1646 HB1 PHE A 181 70.440 87.200 31.560 1.00 0.09 A H
ATOM 1647 HB2 PHE A 181 71.050 87.050 33.160 1.00 0.09 A H
ATOM 1648 CG PHE A 181 72.550 87.130 31.580 1.00 0.09 A C
ATOM 1649 CD1 PHE A 181 73.530 86.550 32.420 1.00 0.09 A C
ATOM 1650 HD1 PHE A 181 73.280 86.390 33.470 1.00 0.09 A H
ATOM 1651 CE1 PHE A 181 74.770 86.230 31.880 1.00 0.09 A C
ATOM 1652 HE1 PHE A 181 75.580 85.820 32.470 1.00 0.09 A H
ATOM 1653 CZ PHE A 181 74.950 86.360 30.520 1.00 0.09 A C
ATOM 1654 HZ PHE A 181 75.860 85.960 30.100 1.00 0.09 A H
ATOM 1655 CE2 PHE A 181 73.990 86.920 29.650 1.00 0.09 A C
ATOM 1656 HE2 PHE A 181 74.060 87.110 28.590 1.00 0.09 A H
ATOM 1657 CD2 PHE A 181 72.700 87.240 30.220 1.00 0.09 A C
ATOM 1658 HD2 PHE A 181 71.830 87.550 29.670 1.00 0.09 A H
ATOM 1659 C PHE A 181 69.520 89.380 32.400 1.00 0.09 A C
ATOM 1660 O PHE A 181 68.900 89.300 33.460 1.00 0.09 A O
ATOM 1661 N THR A 182 68.860 89.540 31.240 1.00 0.09 A N
ATOM 1662 H THR A 182 69.450 89.690 30.430 1.00 0.09 A H
ATOM 1663 CA THR A 182 67.390 89.670 31.060 1.00 0.09 A C
ATOM 1664 HA THR A 182 66.810 89.710 31.980 1.00 0.09 A H
ATOM 1665 CB THR A 182 67.010 90.980 30.340 1.00 0.09 A C
ATOM 1666 HB THR A 182 65.960 90.950 30.020 1.00 0.09 A H
ATOM 1667 CG2 THR A 182 67.410 92.150 31.190 1.00 0.09 A C
ATOM 1668 HG21 THR A 182 68.470 92.230 31.440 1.00 0.09 A H
ATOM 1669 HG22 THR A 182 67.150 93.030 30.600 1.00 0.09 A H
ATOM 1670 HG23 THR A 182 66.870 92.050 32.130 1.00 0.09 A H
ATOM 1671 OG1 THR A 182 67.780 91.060 29.160 1.00 0.09 A O
ATOM 1672 HG1 THR A 182 68.620 91.420 29.480 1.00 0.09 A H
ATOM 1673 C THR A 182 66.810 88.530 30.220 1.00 0.09 A C
ATOM 1674 O THR A 182 67.540 87.760 29.640 1.00 0.09 A O
ATOM 1675 N HIS A 183 65.460 88.390 30.210 1.00 0.11 A N
ATOM 1676 H HIS A 183 65.040 89.230 30.560 1.00 0.11 A H
ATOM 1677 CA HIS A 183 64.560 87.390 29.600 1.00 0.11 A C
ATOM 1678 HA HIS A 183 64.840 86.420 30.000 1.00 0.11 A H
ATOM 1679 CB HIS A 183 63.070 87.780 29.810 1.00 0.11 A C
ATOM 1680 HB1 HIS A 183 62.800 88.820 29.610 1.00 0.11 A H
ATOM 1681 HB2 HIS A 183 62.850 87.680 30.880 1.00 0.11 A H
ATOM 1682 CG HIS A 183 62.090 86.930 29.070 1.00 0.11 A C
ATOM 1683 ND1 HIS A 183 61.760 85.640 29.250 1.00 0.11 A N
ATOM 1684 CE1 HIS A 183 60.880 85.310 28.350 1.00 0.11 A C
ATOM 1685 HE1 HIS A 183 60.510 84.310 28.180 1.00 0.11 A H
ATOM 1686 NE2 HIS A 183 60.600 86.350 27.550 1.00 0.11 A N
ATOM 1687 HE2 HIS A 183 60.000 86.330 26.740 1.00 0.11 A H
ATOM 1688 CD2 HIS A 183 61.340 87.420 28.050 1.00 0.11 A C
ATOM 1689 HD2 HIS A 183 61.200 88.430 27.710 1.00 0.11 A H
ATOM 1690 C HIS A 183 64.780 87.250 28.000 1.00 0.11 A C
ATOM 1691 O HIS A 183 64.840 86.130 27.490 1.00 0.11 A O
ATOM 1692 N GLU A 184 65.010 88.400 27.300 1.00 0.15 A N
ATOM 1693 H GLU A 184 64.890 89.350 27.620 1.00 0.15 A H
ATOM 1694 CA GLU A 184 65.290 88.380 25.900 1.00 0.15 A C
ATOM 1695 HA GLU A 184 64.740 87.550 25.470 1.00 0.15 A H
ATOM 1696 CB GLU A 184 64.850 89.650 25.190 1.00 0.15 A C
ATOM 1697 HB1 GLU A 184 63.760 89.690 25.330 1.00 0.15 A H
ATOM 1698 HB2 GLU A 184 65.170 89.640 24.150 1.00 0.15 A H
ATOM 1699 CG GLU A 184 65.380 90.950 25.890 1.00 0.15 A C
ATOM 1700 HG1 GLU A 184 66.450 90.900 26.090 1.00 0.15 A H
ATOM 1701 HG2 GLU A 184 64.980 91.060 26.890 1.00 0.15 A H
ATOM 1702 CD GLU A 184 64.890 92.120 25.060 1.00 0.15 A C
ATOM 1703 OE1 GLU A 184 65.760 92.770 24.420 1.00 0.15 A O
ATOM 1704 OE2 GLU A 184 63.700 92.430 25.230 1.00 0.15 A O
ATOM 1705 C GLU A 184 66.770 88.150 25.520 1.00 0.15 A C
ATOM 1706 O GLU A 184 67.100 87.520 24.550 1.00 0.15 A O
ATOM 1707 N GLU A 185 67.610 88.450 26.460 1.00 0.15 A N
ATOM 1708 H GLU A 185 67.160 88.910 27.230 1.00 0.15 A H
ATOM 1709 CA GLU A 185 69.010 88.090 26.390 1.00 0.15 A C
ATOM 1710 HA GLU A 185 69.360 88.430 25.410 1.00 0.15 A H
ATOM 1711 CB GLU A 185 69.820 88.800 27.460 1.00 0.15 A C
ATOM 1712 HB1 GLU A 185 70.790 88.310 27.400 1.00 0.15 A H
ATOM 1713 HB2 GLU A 185 69.370 88.620 28.440 1.00 0.15 A H
ATOM 1714 CG GLU A 185 69.960 90.270 27.070 1.00 0.15 A C
ATOM 1715 HG1 GLU A 185 68.990 90.760 26.980 1.00 0.15 A H
ATOM 1716 HG2 GLU A 185 70.520 90.340 26.140 1.00 0.15 A H
ATOM 1717 CD GLU A 185 70.730 91.080 28.120 1.00 0.15 A C
ATOM 1718 OE1 GLU A 185 71.840 91.590 27.760 1.00 0.15 A O
ATOM 1719 OE2 GLU A 185 70.290 91.290 29.260 1.00 0.15 A O
ATOM 1720 C GLU A 185 69.190 86.510 26.410 1.00 0.15 A C
ATOM 1721 O GLU A 185 69.880 85.920 25.550 1.00 0.15 A O
ATOM 1722 N LEU A 186 68.590 85.880 27.400 1.00 0.07 A N
ATOM 1723 H LEU A 186 68.020 86.390 28.070 1.00 0.07 A H
ATOM 1724 CA LEU A 186 68.570 84.420 27.500 1.00 0.07 A C
ATOM 1725 HA LEU A 186 69.550 83.950 27.440 1.00 0.07 A H
ATOM 1726 CB LEU A 186 68.010 84.100 28.920 1.00 0.07 A C
ATOM 1727 HB1 LEU A 186 67.680 83.060 28.920 1.00 0.07 A H
ATOM 1728 HB2 LEU A 186 67.100 84.690 29.010 1.00 0.07 A H
ATOM 1729 CG LEU A 186 68.880 84.450 30.140 1.00 0.07 A C
ATOM 1730 HG LEU A 186 69.160 85.490 30.010 1.00 0.07 A H
ATOM 1731 CD1 LEU A 186 68.060 84.230 31.440 1.00 0.07 A C
ATOM 1732 HD11 LEU A 186 67.080 84.700 31.370 1.00 0.07 A H
ATOM 1733 HD12 LEU A 186 67.990 83.150 31.590 1.00 0.07 A H
ATOM 1734 HD13 LEU A 186 68.550 84.730 32.280 1.00 0.07 A H
ATOM 1735 CD2 LEU A 186 70.170 83.670 30.230 1.00 0.07 A C
ATOM 1736 HD21 LEU A 186 70.760 83.750 29.310 1.00 0.07 A H
ATOM 1737 HD22 LEU A 186 70.760 84.060 31.060 1.00 0.07 A H
ATOM 1738 HD23 LEU A 186 70.030 82.660 30.590 1.00 0.07 A H
ATOM 1739 C LEU A 186 67.790 83.720 26.360 1.00 0.07 A C
ATOM 1740 O LEU A 186 68.190 82.650 25.990 1.00 0.07 A O
ATOM 1741 N GLY A 187 66.730 84.380 25.820 1.00 0.08 A N
ATOM 1742 H GLY A 187 66.420 85.250 26.220 1.00 0.08 A H
ATOM 1743 CA GLY A 187 66.000 83.790 24.710 1.00 0.08 A C
ATOM 1744 HA1 GLY A 187 65.020 84.270 24.610 1.00 0.08 A H
ATOM 1745 HA2 GLY A 187 65.750 82.770 24.970 1.00 0.08 A H
ATOM 1746 C GLY A 187 66.800 83.770 23.380 1.00 0.08 A C
ATOM 1747 O GLY A 187 66.880 82.820 22.610 1.00 0.08 A O
ATOM 1748 N ALA A 188 67.760 84.710 23.240 1.00 0.09 A N
ATOM 1749 H ALA A 188 67.770 85.490 23.890 1.00 0.09 A H
ATOM 1750 CA ALA A 188 68.720 84.800 22.170 1.00 0.09 A C
ATOM 1751 HA ALA A 188 68.330 84.700 21.150 1.00 0.09 A H
ATOM 1752 CB ALA A 188 69.300 86.280 22.220 1.00 0.09 A C
ATOM 1753 HB1 ALA A 188 68.430 86.910 22.030 1.00 0.09 A H
ATOM 1754 HB2 ALA A 188 69.530 86.650 23.220 1.00 0.09 A H
ATOM 1755 HB3 ALA A 188 70.060 86.510 21.470 1.00 0.09 A H
ATOM 1756 C ALA A 188 69.760 83.690 22.210 1.00 0.09 A C
ATOM 1757 O ALA A 188 70.040 83.140 21.110 1.00 0.09 A O
ATOM 1758 N LEU A 189 70.340 83.360 23.400 1.00 0.11 A N
ATOM 1759 H LEU A 189 70.080 83.860 24.230 1.00 0.11 A H
ATOM 1760 CA LEU A 189 71.170 82.170 23.780 1.00 0.11 A C
ATOM 1761 HA LEU A 189 72.050 82.180 23.140 1.00 0.11 A H
ATOM 1762 CB LEU A 189 71.680 82.230 25.240 1.00 0.11 A C
ATOM 1763 HB1 LEU A 189 72.230 81.310 25.420 1.00 0.11 A H
ATOM 1764 HB2 LEU A 189 70.850 82.050 25.910 1.00 0.11 A H
ATOM 1765 CG LEU A 189 72.520 83.500 25.620 1.00 0.11 A C
ATOM 1766 HG LEU A 189 71.900 84.360 25.380 1.00 0.11 A H
ATOM 1767 CD1 LEU A 189 72.830 83.420 27.070 1.00 0.11 A C
ATOM 1768 HD11 LEU A 189 71.840 83.340 27.510 1.00 0.11 A H
ATOM 1769 HD12 LEU A 189 73.420 82.520 27.260 1.00 0.11 A H
ATOM 1770 HD13 LEU A 189 73.250 84.320 27.510 1.00 0.11 A H
ATOM 1771 CD2 LEU A 189 73.730 83.700 24.840 1.00 0.11 A C
ATOM 1772 HD21 LEU A 189 74.060 84.740 24.830 1.00 0.11 A H
ATOM 1773 HD22 LEU A 189 74.490 83.070 25.280 1.00 0.11 A H
ATOM 1774 HD23 LEU A 189 73.610 83.510 23.770 1.00 0.11 A H
ATOM 1775 C LEU A 189 70.540 80.870 23.370 1.00 0.11 A C
ATOM 1776 O LEU A 189 71.110 80.060 22.620 1.00 0.11 A O
ATOM 1777 N LEU A 190 69.300 80.680 23.880 1.00 0.09 A N
ATOM 1778 H LEU A 190 69.010 81.280 24.650 1.00 0.09 A H
ATOM 1779 CA LEU A 190 68.550 79.410 23.580 1.00 0.09 A C
ATOM 1780 HA LEU A 190 69.200 78.570 23.820 1.00 0.09 A H
ATOM 1781 CB LEU A 190 67.310 79.290 24.420 1.00 0.09 A C
ATOM 1782 HB1 LEU A 190 66.740 78.430 24.080 1.00 0.09 A H
ATOM 1783 HB2 LEU A 190 66.610 80.100 24.230 1.00 0.09 A H
ATOM 1784 CG LEU A 190 67.490 79.060 25.950 1.00 0.09 A C
ATOM 1785 HG LEU A 190 68.290 79.720 26.290 1.00 0.09 A H
ATOM 1786 CD1 LEU A 190 66.190 79.320 26.720 1.00 0.09 A C
ATOM 1787 HD11 LEU A 190 65.930 80.370 26.850 1.00 0.09 A H
ATOM 1788 HD12 LEU A 190 65.360 78.820 26.220 1.00 0.09 A H
ATOM 1789 HD13 LEU A 190 66.170 78.840 27.700 1.00 0.09 A H
ATOM 1790 CD2 LEU A 190 67.970 77.690 26.220 1.00 0.09 A C
ATOM 1791 HD21 LEU A 190 68.050 77.650 27.300 1.00 0.09 A H
ATOM 1792 HD22 LEU A 190 67.250 76.970 25.820 1.00 0.09 A H
ATOM 1793 HD23 LEU A 190 68.960 77.570 25.780 1.00 0.09 A H
ATOM 1794 C LEU A 190 68.310 79.300 22.100 1.00 0.09 A C
ATOM 1795 O LEU A 190 68.450 78.190 21.570 1.00 0.09 A O
ATOM 1796 N TYR A 191 67.950 80.360 21.430 1.00 0.16 A N
ATOM 1797 H TYR A 191 67.740 81.280 21.810 1.00 0.16 A H
ATOM 1798 CA TYR A 191 67.750 80.310 19.990 1.00 0.16 A C
ATOM 1799 HA TYR A 191 67.010 79.510 19.860 1.00 0.16 A H
ATOM 1800 CB TYR A 191 67.010 81.580 19.530 1.00 0.16 A C
ATOM 1801 HB1 TYR A 191 67.580 82.490 19.740 1.00 0.16 A H
ATOM 1802 HB2 TYR A 191 66.030 81.610 20.020 1.00 0.16 A H
ATOM 1803 CG TYR A 191 66.730 81.730 18.040 1.00 0.16 A C
ATOM 1804 CD1 TYR A 191 65.470 81.340 17.570 1.00 0.16 A C
ATOM 1805 HD1 TYR A 191 64.740 80.910 18.230 1.00 0.16 A H
ATOM 1806 CE1 TYR A 191 65.180 81.430 16.180 1.00 0.16 A C
ATOM 1807 HE1 TYR A 191 64.240 81.070 15.770 1.00 0.16 A H
ATOM 1808 CZ TYR A 191 66.130 81.970 15.280 1.00 0.16 A C
ATOM 1809 OH TYR A 191 65.840 82.060 13.930 1.00 0.16 A O
ATOM 1810 HH TYR A 191 66.600 82.360 13.430 1.00 0.16 A H
ATOM 1811 CE2 TYR A 191 67.340 82.420 15.800 1.00 0.16 A C
ATOM 1812 HE2 TYR A 191 68.040 82.850 15.080 1.00 0.16 A H
ATOM 1813 CD2 TYR A 191 67.700 82.310 17.140 1.00 0.16 A C
ATOM 1814 HD2 TYR A 191 68.620 82.720 17.540 1.00 0.16 A H
ATOM 1815 C TYR A 191 69.050 80.100 19.230 1.00 0.16 A C
ATOM 1816 O TYR A 191 69.130 79.260 18.300 1.00 0.16 A O
ATOM 1817 N LYS A 192 70.130 80.840 19.560 1.00 0.18 A N
ATOM 1818 H LYS A 192 69.990 81.630 20.190 1.00 0.18 A H
ATOM 1819 CA LYS A 192 71.410 80.700 18.890 1.00 0.18 A C
ATOM 1820 HA LYS A 192 71.130 80.940 17.860 1.00 0.18 A H
ATOM 1821 CB LYS A 192 72.370 81.790 19.460 1.00 0.18 A C
ATOM 1822 HB1 LYS A 192 72.830 81.470 20.410 1.00 0.18 A H
ATOM 1823 HB2 LYS A 192 71.890 82.760 19.540 1.00 0.18 A H
ATOM 1824 CG LYS A 192 73.510 82.170 18.560 1.00 0.18 A C
ATOM 1825 HG1 LYS A 192 74.030 81.300 18.160 1.00 0.18 A H
ATOM 1826 HG2 LYS A 192 74.240 82.810 19.040 1.00 0.18 A H
ATOM 1827 CD LYS A 192 72.970 83.010 17.340 1.00 0.18 A C
ATOM 1828 HD1 LYS A 192 72.320 83.800 17.720 1.00 0.18 A H
ATOM 1829 HD2 LYS A 192 72.380 82.340 16.720 1.00 0.18 A H
ATOM 1830 CE LYS A 192 74.050 83.700 16.500 1.00 0.18 A C
ATOM 1831 HE1 LYS A 192 74.590 82.940 15.930 1.00 0.18 A H
ATOM 1832 HE2 LYS A 192 74.750 84.070 17.240 1.00 0.18 A H
ATOM 1833 NZ LYS A 192 73.360 84.790 15.670 1.00 0.18 A N
ATOM 1834 HZ1 LYS A 192 72.520 84.530 15.170 1.00 0.18 A H
ATOM 1835 HZ2 LYS A 192 73.130 85.520 16.340 1.00 0.18 A H
ATOM 1836 HZ3 LYS A 192 73.970 85.240 15.000 1.00 0.18 A H
ATOM 1837 C LYS A 192 72.090 79.330 18.970 1.00 0.18 A C
ATOM 1838 O LYS A 192 72.610 78.780 17.980 1.00 0.18 A O
ATOM 1839 N HIS A 193 72.170 78.770 20.240 1.00 0.12 A N
ATOM 1840 H HIS A 193 71.730 79.270 21.000 1.00 0.12 A H
ATOM 1841 CA HIS A 193 73.110 77.640 20.620 1.00 0.12 A C
ATOM 1842 HA HIS A 193 73.730 77.310 19.790 1.00 0.12 A H
ATOM 1843 CB HIS A 193 74.090 78.150 21.790 1.00 0.12 A C
ATOM 1844 HB1 HIS A 193 74.720 77.380 22.240 1.00 0.12 A H
ATOM 1845 HB2 HIS A 193 73.400 78.500 22.560 1.00 0.12 A H
ATOM 1846 CG HIS A 193 74.970 79.340 21.440 1.00 0.12 A C
ATOM 1847 ND1 HIS A 193 75.570 79.400 20.190 1.00 0.12 A N
ATOM 1848 CE1 HIS A 193 75.940 80.720 20.070 1.00 0.12 A C
ATOM 1849 HE1 HIS A 193 76.470 81.220 19.270 1.00 0.12 A H
ATOM 1850 NE2 HIS A 193 75.680 81.320 21.140 1.00 0.12 A N
ATOM 1851 HE2 HIS A 193 75.900 82.300 21.230 1.00 0.12 A H
ATOM 1852 CD2 HIS A 193 74.980 80.590 22.000 1.00 0.12 A C
ATOM 1853 HD2 HIS A 193 74.430 80.870 22.890 1.00 0.12 A H
ATOM 1854 C HIS A 193 72.360 76.410 20.990 1.00 0.12 A C
ATOM 1855 O HIS A 193 72.870 75.290 20.780 1.00 0.12 A O
ATOM 1856 N GLY A 194 71.150 76.580 21.530 1.00 0.08 A N
ATOM 1857 H GLY A 194 70.820 77.510 21.750 1.00 0.08 A H
ATOM 1858 CA GLY A 194 70.320 75.590 22.130 1.00 0.08 A C
ATOM 1859 HA1 GLY A 194 70.550 74.600 21.720 1.00 0.08 A H
ATOM 1860 HA2 GLY A 194 69.290 75.730 21.810 1.00 0.08 A H
ATOM 1861 C GLY A 194 70.340 75.610 23.650 1.00 0.08 A C
ATOM 1862 O GLY A 194 70.640 76.700 24.280 1.00 0.08 A O
ATOM 1863 N PRO A 195 70.010 74.520 24.340 1.00 0.08 A N
ATOM 1864 CD PRO A 195 69.810 73.210 23.780 1.00 0.08 A C
ATOM 1865 HD1 PRO A 195 70.650 72.870 23.170 1.00 0.08 A H
ATOM 1866 HD2 PRO A 195 68.860 73.240 23.240 1.00 0.08 A H
ATOM 1867 CG PRO A 195 69.770 72.210 24.930 1.00 0.08 A C
ATOM 1868 HG1 PRO A 195 70.680 71.670 25.180 1.00 0.08 A H
ATOM 1869 HG2 PRO A 195 68.960 71.510 24.670 1.00 0.08 A H
ATOM 1870 CB PRO A 195 69.460 73.120 26.150 1.00 0.08 A C
ATOM 1871 HB1 PRO A 195 69.880 72.640 27.030 1.00 0.08 A H
ATOM 1872 HB2 PRO A 195 68.400 73.350 26.220 1.00 0.08 A H
ATOM 1873 CA PRO A 195 70.070 74.450 25.840 1.00 0.08 A C
ATOM 1874 HA PRO A 195 69.330 75.170 26.180 1.00 0.08 A H
ATOM 1875 C PRO A 195 71.450 74.700 26.460 1.00 0.08 A C
ATOM 1876 O PRO A 195 72.410 74.150 26.020 1.00 0.08 A O
ATOM 1877 N ILE A 196 71.490 75.560 27.500 1.00 0.10 A N
ATOM 1878 H ILE A 196 70.660 76.040 27.810 1.00 0.10 A H
ATOM 1879 CA ILE A 196 72.830 76.090 27.880 1.00 0.10 A C
ATOM 1880 HA ILE A 196 73.590 75.820 27.140 1.00 0.10 A H
ATOM 1881 CB ILE A 196 72.790 77.640 28.020 1.00 0.10 A C
ATOM 1882 HB ILE A 196 71.970 77.870 28.690 1.00 0.10 A H
ATOM 1883 CG2 ILE A 196 74.140 78.260 28.470 1.00 0.10 A C
ATOM 1884 HG21 ILE A 196 74.320 78.240 29.540 1.00 0.10 A H
ATOM 1885 HG22 ILE A 196 74.990 77.910 27.880 1.00 0.10 A H
ATOM 1886 HG23 ILE A 196 74.080 79.320 28.210 1.00 0.10 A H
ATOM 1887 CG1 ILE A 196 72.380 78.280 26.680 1.00 0.10 A C
ATOM 1888 HG11 ILE A 196 72.240 79.350 26.860 1.00 0.10 A H
ATOM 1889 HG12 ILE A 196 71.430 77.810 26.430 1.00 0.10 A H
ATOM 1890 CD ILE A 196 73.500 78.180 25.530 1.00 0.10 A C
ATOM 1891 HD1 ILE A 196 73.160 78.720 24.650 1.00 0.10 A H
ATOM 1892 HD2 ILE A 196 74.390 78.720 25.830 1.00 0.10 A H
ATOM 1893 HD3 ILE A 196 73.630 77.150 25.170 1.00 0.10 A H
ATOM 1894 C ILE A 196 73.150 75.490 29.270 1.00 0.10 A C
ATOM 1895 O ILE A 196 72.360 75.550 30.230 1.00 0.10 A O
ATOM 1896 N ILE A 197 74.340 74.870 29.370 1.00 0.06 A N
ATOM 1897 H ILE A 197 74.940 74.930 28.560 1.00 0.06 A H
ATOM 1898 CA ILE A 197 74.870 74.370 30.650 1.00 0.06 A C
ATOM 1899 HA ILE A 197 74.120 73.870 31.270 1.00 0.06 A H
ATOM 1900 CB ILE A 197 76.090 73.460 30.370 1.00 0.06 A C
ATOM 1901 HB ILE A 197 76.810 74.050 29.820 1.00 0.06 A H
ATOM 1902 CG2 ILE A 197 76.750 73.120 31.740 1.00 0.06 A C
ATOM 1903 HG21 ILE A 197 77.430 73.890 32.110 1.00 0.06 A H
ATOM 1904 HG22 ILE A 197 75.940 72.840 32.400 1.00 0.06 A H
ATOM 1905 HG23 ILE A 197 77.330 72.200 31.700 1.00 0.06 A H
ATOM 1906 CG1 ILE A 197 75.690 72.270 29.540 1.00 0.06 A C
ATOM 1907 HG11 ILE A 197 75.210 72.490 28.590 1.00 0.06 A H
ATOM 1908 HG12 ILE A 197 74.980 71.800 30.220 1.00 0.06 A H
ATOM 1909 CD ILE A 197 76.800 71.190 29.340 1.00 0.06 A C
ATOM 1910 HD1 ILE A 197 76.800 70.590 30.250 1.00 0.06 A H
ATOM 1911 HD2 ILE A 197 76.460 70.490 28.570 1.00 0.06 A H
ATOM 1912 HD3 ILE A 197 77.730 71.700 29.090 1.00 0.06 A H
ATOM 1913 C ILE A 197 75.350 75.660 31.440 1.00 0.06 A C
ATOM 1914 O ILE A 197 76.050 76.480 30.890 1.00 0.06 A O
ATOM 1915 N PHE A 198 75.050 75.800 32.760 1.00 0.05 A N
ATOM 1916 H PHE A 198 74.520 75.000 33.110 1.00 0.05 A H
ATOM 1917 CA PHE A 198 75.360 76.930 33.640 1.00 0.05 A C
ATOM 1918 HA PHE A 198 76.110 77.500 33.100 1.00 0.05 A H
ATOM 1919 CB PHE A 198 74.010 77.660 33.770 1.00 0.05 A C
ATOM 1920 HB1 PHE A 198 73.650 77.910 32.780 1.00 0.05 A H
ATOM 1921 HB2 PHE A 198 74.220 78.650 34.180 1.00 0.05 A H
ATOM 1922 CG PHE A 198 72.850 77.060 34.520 1.00 0.05 A C
ATOM 1923 CD1 PHE A 198 71.810 76.400 33.880 1.00 0.05 A C
ATOM 1924 HD1 PHE A 198 71.940 76.140 32.840 1.00 0.05 A H
ATOM 1925 CE1 PHE A 198 70.650 76.010 34.570 1.00 0.05 A C
ATOM 1926 HE1 PHE A 198 69.950 75.340 34.110 1.00 0.05 A H
ATOM 1927 CZ PHE A 198 70.490 76.390 35.900 1.00 0.05 A C
ATOM 1928 HZ PHE A 198 69.620 76.020 36.420 1.00 0.05 A H
ATOM 1929 CE2 PHE A 198 71.510 77.150 36.540 1.00 0.05 A C
ATOM 1930 HE2 PHE A 198 71.390 77.540 37.540 1.00 0.05 A H
ATOM 1931 CD2 PHE A 198 72.630 77.560 35.850 1.00 0.05 A C
ATOM 1932 HD2 PHE A 198 73.290 78.280 36.320 1.00 0.05 A H
ATOM 1933 C PHE A 198 75.950 76.470 34.980 1.00 0.05 A C
ATOM 1934 O PHE A 198 75.530 75.480 35.500 1.00 0.05 A O
ATOM 1935 N GLY A 199 76.860 77.350 35.540 1.00 0.04 A N
ATOM 1936 H GLY A 199 77.190 78.110 34.950 1.00 0.04 A H
ATOM 1937 CA GLY A 199 77.250 77.240 36.940 1.00 0.04 A C
ATOM 1938 HA1 GLY A 199 78.270 77.580 37.060 1.00 0.04 A H
ATOM 1939 HA2 GLY A 199 77.200 76.200 37.260 1.00 0.04 A H
ATOM 1940 C GLY A 199 76.350 78.040 37.870 1.00 0.04 A C
ATOM 1941 O GLY A 199 75.910 79.120 37.450 1.00 0.04 A O
ATOM 1942 N TRP A 200 75.990 77.450 39.060 1.00 0.06 A N
ATOM 1943 H TRP A 200 76.120 76.460 39.160 1.00 0.06 A H
ATOM 1944 CA TRP A 200 75.150 78.140 40.040 1.00 0.06 A C
ATOM 1945 HA TRP A 200 75.390 79.190 39.950 1.00 0.06 A H
ATOM 1946 CB TRP A 200 73.720 78.110 39.550 1.00 0.06 A C
ATOM 1947 HB1 TRP A 200 73.680 78.340 38.490 1.00 0.06 A H
ATOM 1948 HB2 TRP A 200 73.130 78.810 40.150 1.00 0.06 A H
ATOM 1949 CG TRP A 200 73.020 76.840 39.690 1.00 0.06 A C
ATOM 1950 CD1 TRP A 200 73.180 75.680 38.960 1.00 0.06 A C
ATOM 1951 HD1 TRP A 200 73.990 75.640 38.240 1.00 0.06 A H
ATOM 1952 NE1 TRP A 200 72.310 74.720 39.360 1.00 0.06 A N
ATOM 1953 HE1 TRP A 200 72.230 73.860 38.820 1.00 0.06 A H
ATOM 1954 CE2 TRP A 200 71.420 75.190 40.260 1.00 0.06 A C
ATOM 1955 CZ2 TRP A 200 70.260 74.620 40.790 1.00 0.06 A C
ATOM 1956 HZ2 TRP A 200 69.960 73.650 40.410 1.00 0.06 A H
ATOM 1957 CH2 TRP A 200 69.580 75.350 41.800 1.00 0.06 A C
ATOM 1958 HH2 TRP A 200 68.730 74.980 42.340 1.00 0.06 A H
ATOM 1959 CZ3 TRP A 200 70.030 76.670 42.100 1.00 0.06 A C
ATOM 1960 HZ3 TRP A 200 69.510 77.230 42.880 1.00 0.06 A H
ATOM 1961 CE3 TRP A 200 71.150 77.260 41.460 1.00 0.06 A C
ATOM 1962 HE3 TRP A 200 71.440 78.250 41.770 1.00 0.06 A H
ATOM 1963 CD2 TRP A 200 71.880 76.510 40.520 1.00 0.06 A C
ATOM 1964 C TRP A 200 75.280 77.680 41.510 1.00 0.06 A C
ATOM 1965 O TRP A 200 75.600 76.510 41.890 1.00 0.06 A O
ATOM 1966 N LYS A 201 74.990 78.690 42.380 1.00 0.10 A N
ATOM 1967 H LYS A 201 74.980 79.630 42.000 1.00 0.10 A H
ATOM 1968 CA LYS A 201 75.070 78.520 43.810 1.00 0.10 A C
ATOM 1969 HA LYS A 201 75.650 77.640 44.080 1.00 0.10 A H
ATOM 1970 CB LYS A 201 75.650 79.760 44.480 1.00 0.10 A C
ATOM 1971 HB1 LYS A 201 74.920 80.570 44.520 1.00 0.10 A H
ATOM 1972 HB2 LYS A 201 76.580 80.020 43.970 1.00 0.10 A H
ATOM 1973 CG LYS A 201 76.160 79.310 45.860 1.00 0.10 A C
ATOM 1974 HG1 LYS A 201 77.020 78.640 45.800 1.00 0.10 A H
ATOM 1975 HG2 LYS A 201 75.320 78.830 46.360 1.00 0.10 A H
ATOM 1976 CD LYS A 201 76.590 80.550 46.710 1.00 0.10 A C
ATOM 1977 HD1 LYS A 201 75.750 81.250 46.770 1.00 0.10 A H
ATOM 1978 HD2 LYS A 201 77.350 81.070 46.130 1.00 0.10 A H
ATOM 1979 CE LYS A 201 76.990 80.160 48.190 1.00 0.10 A C
ATOM 1980 HE1 LYS A 201 77.610 79.280 48.010 1.00 0.10 A H
ATOM 1981 HE2 LYS A 201 76.070 79.870 48.680 1.00 0.10 A H
ATOM 1982 NZ LYS A 201 77.810 81.260 48.710 1.00 0.10 A N
ATOM 1983 HZ1 LYS A 201 77.330 82.140 48.630 1.00 0.10 A H
ATOM 1984 HZ2 LYS A 201 77.970 81.150 49.710 1.00 0.10 A H
ATOM 1985 HZ3 LYS A 201 78.660 81.370 48.180 1.00 0.10 A H
ATOM 1986 C LYS A 201 73.640 78.120 44.380 1.00 0.10 A C
ATOM 1987 O LYS A 201 72.740 79.010 44.410 1.00 0.10 A O
ATOM 1988 N THR A 202 73.480 76.910 44.740 1.00 0.08 A N
ATOM 1989 H THR A 202 74.290 76.300 44.810 1.00 0.08 A H
ATOM 1990 CA THR A 202 72.230 76.440 45.340 1.00 0.08 A C
ATOM 1991 HA THR A 202 71.390 76.390 44.650 1.00 0.08 A H
ATOM 1992 CB THR A 202 72.200 74.980 45.770 1.00 0.08 A C
ATOM 1993 HB THR A 202 71.260 74.660 46.200 1.00 0.08 A H
ATOM 1994 CG2 THR A 202 72.680 74.020 44.660 1.00 0.08 A C
ATOM 1995 HG21 THR A 202 71.980 74.090 43.830 1.00 0.08 A H
ATOM 1996 HG22 THR A 202 73.740 74.110 44.380 1.00 0.08 A H
ATOM 1997 HG23 THR A 202 72.570 73.020 45.060 1.00 0.08 A H
ATOM 1998 OG1 THR A 202 73.150 74.770 46.720 1.00 0.08 A O
ATOM 1999 HG1 THR A 202 74.060 74.830 46.390 1.00 0.08 A H
ATOM 2000 C THR A 202 71.760 77.180 46.610 1.00 0.08 A C
ATOM 2001 O THR A 202 72.610 77.750 47.300 1.00 0.08 A O
ATOM 2002 N PRO A 203 70.480 77.110 46.990 1.00 0.10 A N
ATOM 2003 CD PRO A 203 69.290 76.610 46.270 1.00 0.10 A C
ATOM 2004 HD1 PRO A 203 69.280 75.510 46.310 1.00 0.10 A H
ATOM 2005 HD2 PRO A 203 69.090 77.030 45.290 1.00 0.10 A H
ATOM 2006 CG PRO A 203 67.980 76.950 47.100 1.00 0.10 A C
ATOM 2007 HG1 PRO A 203 67.310 76.090 47.000 1.00 0.10 A H
ATOM 2008 HG2 PRO A 203 67.460 77.840 46.760 1.00 0.10 A H
ATOM 2009 CB PRO A 203 68.570 77.090 48.580 1.00 0.10 A C
ATOM 2010 HB1 PRO A 203 68.480 76.130 49.090 1.00 0.10 A H
ATOM 2011 HB2 PRO A 203 68.100 77.830 49.200 1.00 0.10 A H
ATOM 2012 CA PRO A 203 70.030 77.490 48.350 1.00 0.10 A C
ATOM 2013 HA PRO A 203 70.080 78.570 48.440 1.00 0.10 A H
ATOM 2014 C PRO A 203 70.800 76.810 49.530 1.00 0.10 A C
ATOM 2015 O PRO A 203 70.900 77.410 50.570 1.00 0.10 A O
ATOM 2016 N ASN A 204 71.380 75.620 49.420 1.00 0.15 A N
ATOM 2017 H ASN A 204 71.220 75.100 48.570 1.00 0.15 A H
ATOM 2018 CA ASN A 204 72.250 75.020 50.480 1.00 0.15 A C
ATOM 2019 HA ASN A 204 71.860 75.210 51.470 1.00 0.15 A H
ATOM 2020 CB ASN A 204 72.390 73.500 50.090 1.00 0.15 A C
ATOM 2021 HB1 ASN A 204 73.270 73.400 49.450 1.00 0.15 A H
ATOM 2022 HB2 ASN A 204 71.540 73.210 49.450 1.00 0.15 A H
ATOM 2023 CG ASN A 204 72.480 72.610 51.280 1.00 0.15 A C
ATOM 2024 OD1 ASN A 204 72.010 71.470 51.130 1.00 0.15 A O
ATOM 2025 ND2 ASN A 204 73.220 72.840 52.350 1.00 0.15 A N
ATOM 2026 HD21 ASN A 204 73.700 73.730 52.440 1.00 0.15 A H
ATOM 2027 HD22 ASN A 204 73.310 72.130 53.070 1.00 0.15 A H
ATOM 2028 C ASN A 204 73.690 75.650 50.490 1.00 0.15 A C
ATOM 2029 O ASN A 204 74.700 75.100 50.980 1.00 0.15 A O
ATOM 2030 N ASP A 205 73.960 76.700 49.700 1.00 0.13 A N
ATOM 2031 H ASP A 205 73.120 77.200 49.430 1.00 0.13 A H
ATOM 2032 CA ASP A 205 75.300 77.260 49.480 1.00 0.13 A C
ATOM 2033 HA ASP A 205 75.080 77.960 48.680 1.00 0.13 A H
ATOM 2034 CB ASP A 205 75.880 78.000 50.740 1.00 0.13 A C
ATOM 2035 HB1 ASP A 205 76.660 78.680 50.440 1.00 0.13 A H
ATOM 2036 HB2 ASP A 205 76.370 77.240 51.340 1.00 0.13 A H
ATOM 2037 CG ASP A 205 74.790 78.710 51.550 1.00 0.13 A C
ATOM 2038 OD1 ASP A 205 74.790 78.670 52.800 1.00 0.13 A O
ATOM 2039 OD2 ASP A 205 73.920 79.370 50.880 1.00 0.13 A O
ATOM 2040 C ASP A 205 76.230 76.340 48.660 1.00 0.13 A C
ATOM 2041 O ASP A 205 77.350 76.800 48.420 1.00 0.13 A O
ATOM 2042 N SER A 206 75.800 75.110 48.300 1.00 0.10 A N
ATOM 2043 H SER A 206 74.830 74.860 48.430 1.00 0.10 A H
ATOM 2044 CA SER A 206 76.710 74.290 47.490 1.00 0.10 A C
ATOM 2045 HA SER A 206 77.700 74.410 47.900 1.00 0.10 A H
ATOM 2046 CB SER A 206 76.340 72.840 47.580 1.00 0.10 A C
ATOM 2047 HB1 SER A 206 77.150 72.330 47.070 1.00 0.10 A H
ATOM 2048 HB2 SER A 206 75.450 72.760 46.970 1.00 0.10 A H
ATOM 2049 OG SER A 206 76.230 72.400 48.930 1.00 0.10 A O
ATOM 2050 HG SER A 206 77.080 72.340 49.370 1.00 0.10 A H
ATOM 2051 C SER A 206 76.730 74.810 46.060 1.00 0.10 A C
ATOM 2052 O SER A 206 75.630 75.080 45.500 1.00 0.10 A O
ATOM 2053 N TRP A 207 77.930 75.040 45.430 1.00 0.07 A N
ATOM 2054 H TRP A 207 78.690 75.110 46.070 1.00 0.07 A H
ATOM 2055 CA TRP A 207 78.090 75.400 44.040 1.00 0.07 A C
ATOM 2056 HA TRP A 207 77.280 76.090 43.820 1.00 0.07 A H
ATOM 2057 CB TRP A 207 79.460 76.080 43.720 1.00 0.07 A C
ATOM 2058 HB1 TRP A 207 79.630 76.000 42.640 1.00 0.07 A H
ATOM 2059 HB2 TRP A 207 80.220 75.410 44.100 1.00 0.07 A H
ATOM 2060 CG TRP A 207 79.600 77.510 44.070 1.00 0.07 A C
ATOM 2061 CD1 TRP A 207 80.060 77.990 45.220 1.00 0.07 A C
ATOM 2062 HD1 TRP A 207 80.480 77.350 45.990 1.00 0.07 A H
ATOM 2063 NE1 TRP A 207 80.050 79.360 45.210 1.00 0.07 A N
ATOM 2064 HE1 TRP A 207 80.250 79.780 46.110 1.00 0.07 A H
ATOM 2065 CE2 TRP A 207 79.530 79.900 44.040 1.00 0.07 A C
ATOM 2066 CZ2 TRP A 207 79.160 81.120 43.640 1.00 0.07 A C
ATOM 2067 HZ2 TRP A 207 79.390 81.990 44.230 1.00 0.07 A H
ATOM 2068 CH2 TRP A 207 78.480 81.280 42.420 1.00 0.07 A C
ATOM 2069 HH2 TRP A 207 78.120 82.220 42.050 1.00 0.07 A H
ATOM 2070 CZ3 TRP A 207 78.170 80.130 41.620 1.00 0.07 A C
ATOM 2071 HZ3 TRP A 207 77.590 80.320 40.730 1.00 0.07 A H
ATOM 2072 CE3 TRP A 207 78.610 78.840 42.030 1.00 0.07 A C
ATOM 2073 HE3 TRP A 207 78.370 78.010 41.380 1.00 0.07 A H
ATOM 2074 CD2 TRP A 207 79.160 78.650 43.300 1.00 0.07 A C
ATOM 2075 C TRP A 207 77.940 74.180 43.140 1.00 0.07 A C
ATOM 2076 O TRP A 207 78.280 73.070 43.560 1.00 0.07 A O
ATOM 2077 N HIS A 208 77.290 74.310 41.890 1.00 0.06 A N
ATOM 2078 H HIS A 208 77.020 75.220 41.550 1.00 0.06 A H
ATOM 2079 CA HIS A 208 76.580 73.130 41.230 1.00 0.06 A C
ATOM 2080 HA HIS A 208 77.190 72.230 41.320 1.00 0.06 A H
ATOM 2081 CB HIS A 208 75.180 73.070 41.910 1.00 0.06 A C
ATOM 2082 HB1 HIS A 208 74.640 73.980 41.630 1.00 0.06 A H
ATOM 2083 HB2 HIS A 208 75.280 73.030 42.990 1.00 0.06 A H
ATOM 2084 CG HIS A 208 74.280 71.930 41.440 1.00 0.06 A C
ATOM 2085 ND1 HIS A 208 74.690 70.600 41.140 1.00 0.06 A N
ATOM 2086 CE1 HIS A 208 73.510 70.040 40.670 1.00 0.06 A C
ATOM 2087 HE1 HIS A 208 73.490 69.040 40.270 1.00 0.06 A H
ATOM 2088 NE2 HIS A 208 72.460 70.830 40.710 1.00 0.06 A N
ATOM 2089 HE2 HIS A 208 71.570 70.530 40.360 1.00 0.06 A H
ATOM 2090 CD2 HIS A 208 72.930 72.070 41.120 1.00 0.06 A C
ATOM 2091 HD2 HIS A 208 72.320 72.960 41.220 1.00 0.06 A H
ATOM 2092 C HIS A 208 76.530 73.350 39.690 1.00 0.06 A C
ATOM 2093 O HIS A 208 76.830 74.490 39.310 1.00 0.06 A O
ATOM 2094 N MET A 209 76.050 72.420 38.880 1.00 0.08 A N
ATOM 2095 H MET A 209 75.670 71.630 39.380 1.00 0.08 A H
ATOM 2096 CA MET A 209 75.820 72.510 37.480 1.00 0.08 A C
ATOM 2097 HA MET A 209 75.810 73.580 37.240 1.00 0.08 A H
ATOM 2098 CB MET A 209 77.060 71.960 36.840 1.00 0.08 A C
ATOM 2099 HB1 MET A 209 77.060 70.900 37.050 1.00 0.08 A H
ATOM 2100 HB2 MET A 209 77.960 72.400 37.290 1.00 0.08 A H
ATOM 2101 CG MET A 209 77.020 72.350 35.320 1.00 0.08 A C
ATOM 2102 HG1 MET A 209 76.530 73.320 35.290 1.00 0.08 A H
ATOM 2103 HG2 MET A 209 76.330 71.670 34.830 1.00 0.08 A H
ATOM 2104 SD MET A 209 78.610 72.440 34.470 1.00 0.08 A S
ATOM 2105 CE MET A 209 79.260 73.960 35.150 1.00 0.08 A C
ATOM 2106 HE1 MET A 209 78.780 74.830 34.720 1.00 0.08 A H
ATOM 2107 HE2 MET A 209 79.250 73.910 36.230 1.00 0.08 A H
ATOM 2108 HE3 MET A 209 80.290 73.990 34.770 1.00 0.08 A H
ATOM 2109 C MET A 209 74.490 71.930 36.950 1.00 0.08 A C
ATOM 2110 O MET A 209 74.010 70.890 37.440 1.00 0.08 A O
ATOM 2111 N SER A 210 73.890 72.570 35.970 1.00 0.05 A N
ATOM 2112 H SER A 210 74.480 73.150 35.400 1.00 0.05 A H
ATOM 2113 CA SER A 210 72.550 72.260 35.420 1.00 0.05 A C
ATOM 2114 HA SER A 210 72.320 71.200 35.460 1.00 0.05 A H
ATOM 2115 CB SER A 210 71.510 72.900 36.340 1.00 0.05 A C
ATOM 2116 HB1 SER A 210 70.480 72.660 36.040 1.00 0.05 A H
ATOM 2117 HB2 SER A 210 71.690 73.960 36.490 1.00 0.05 A H
ATOM 2118 OG SER A 210 71.600 72.290 37.660 1.00 0.05 A O
ATOM 2119 HG SER A 210 72.140 71.490 37.700 1.00 0.05 A H
ATOM 2120 C SER A 210 72.420 72.780 33.960 1.00 0.05 A C
ATOM 2121 O SER A 210 73.350 73.290 33.390 1.00 0.05 A O
ATOM 2122 N VAL A 211 71.260 72.500 33.370 1.00 0.07 A N
ATOM 2123 H VAL A 211 70.540 72.020 33.920 1.00 0.07 A H
ATOM 2124 CA VAL A 211 70.910 72.930 32.020 1.00 0.07 A C
ATOM 2125 HA VAL A 211 71.730 73.530 31.620 1.00 0.07 A H
ATOM 2126 CB VAL A 211 70.860 71.730 31.050 1.00 0.07 A C
ATOM 2127 HB VAL A 211 69.960 71.130 31.220 1.00 0.07 A H
ATOM 2128 CG1 VAL A 211 70.900 72.340 29.630 1.00 0.07 A C
ATOM 2129 HG11 VAL A 211 69.980 72.810 29.320 1.00 0.07 A H
ATOM 2130 HG12 VAL A 211 71.770 73.000 29.600 1.00 0.07 A H
ATOM 2131 HG13 VAL A 211 71.150 71.490 28.990 1.00 0.07 A H
ATOM 2132 CG2 VAL A 211 72.130 70.910 31.180 1.00 0.07 A C
ATOM 2133 HG21 VAL A 211 72.980 71.560 31.360 1.00 0.07 A H
ATOM 2134 HG22 VAL A 211 72.040 70.240 32.030 1.00 0.07 A H
ATOM 2135 HG23 VAL A 211 72.240 70.140 30.420 1.00 0.07 A H
ATOM 2136 C VAL A 211 69.620 73.790 31.920 1.00 0.07 A C
ATOM 2137 O VAL A 211 68.600 73.270 32.400 1.00 0.07 A O
ATOM 2138 N LEU A 212 69.690 74.930 31.290 1.00 0.09 A N
ATOM 2139 H LEU A 212 70.600 75.230 31.000 1.00 0.09 A H
ATOM 2140 CA LEU A 212 68.690 75.890 30.950 1.00 0.09 A C
ATOM 2141 HA LEU A 212 68.020 76.040 31.790 1.00 0.09 A H
ATOM 2142 CB LEU A 212 69.430 77.220 30.640 1.00 0.09 A C
ATOM 2143 HB1 LEU A 212 70.010 76.980 29.740 1.00 0.09 A H
ATOM 2144 HB2 LEU A 212 70.090 77.390 31.500 1.00 0.09 A H
ATOM 2145 CG LEU A 212 68.570 78.450 30.230 1.00 0.09 A C
ATOM 2146 HG LEU A 212 67.740 78.150 29.580 1.00 0.09 A H
ATOM 2147 CD1 LEU A 212 67.950 79.020 31.500 1.00 0.09 A C
ATOM 2148 HD11 LEU A 212 68.670 79.320 32.260 1.00 0.09 A H
ATOM 2149 HD12 LEU A 212 67.500 79.990 31.270 1.00 0.09 A H
ATOM 2150 HD13 LEU A 212 67.170 78.370 31.890 1.00 0.09 A H
ATOM 2151 CD2 LEU A 212 69.490 79.540 29.630 1.00 0.09 A C
ATOM 2152 HD21 LEU A 212 70.210 79.840 30.390 1.00 0.09 A H
ATOM 2153 HD22 LEU A 212 69.990 79.190 28.720 1.00 0.09 A H
ATOM 2154 HD23 LEU A 212 68.940 80.410 29.280 1.00 0.09 A H
ATOM 2155 C LEU A 212 67.830 75.360 29.800 1.00 0.09 A C
ATOM 2156 O LEU A 212 68.390 74.870 28.820 1.00 0.09 A O
ATOM 2157 N THR A 213 66.570 75.410 29.810 1.00 0.08 A N
ATOM 2158 H THR A 213 66.140 75.720 30.680 1.00 0.08 A H
ATOM 2159 CA THR A 213 65.630 74.940 28.780 1.00 0.08 A C
ATOM 2160 HA THR A 213 66.100 74.640 27.860 1.00 0.08 A H
ATOM 2161 CB THR A 213 64.910 73.660 29.310 1.00 0.08 A C
ATOM 2162 HB THR A 213 64.190 73.320 28.560 1.00 0.08 A H
ATOM 2163 CG2 THR A 213 65.820 72.540 29.780 1.00 0.08 A C
ATOM 2164 HG21 THR A 213 66.280 72.730 30.740 1.00 0.08 A H
ATOM 2165 HG22 THR A 213 65.360 71.540 29.780 1.00 0.08 A H
ATOM 2166 HG23 THR A 213 66.720 72.470 29.180 1.00 0.08 A H
ATOM 2167 OG1 THR A 213 64.100 74.010 30.440 1.00 0.08 A O
ATOM 2168 HG1 THR A 213 63.830 73.150 30.760 1.00 0.08 A H
ATOM 2169 C THR A 213 64.570 76.020 28.350 1.00 0.08 A C
ATOM 2170 O THR A 213 64.160 76.010 27.160 1.00 0.08 A O
ATOM 2171 N GLY A 214 64.280 77.070 29.080 1.00 0.07 A N
ATOM 2172 H GLY A 214 64.650 77.200 30.000 1.00 0.07 A H
ATOM 2173 CA GLY A 214 63.410 78.210 28.700 1.00 0.07 A C
ATOM 2174 HA1 GLY A 214 62.380 77.920 28.480 1.00 0.07 A H
ATOM 2175 HA2 GLY A 214 63.730 78.690 27.780 1.00 0.07 A H
ATOM 2176 C GLY A 214 63.430 79.340 29.710 1.00 0.07 A C
ATOM 2177 O GLY A 214 64.100 79.220 30.770 1.00 0.07 A O
ATOM 2178 N VAL A 215 62.690 80.420 29.400 1.00 0.08 A N
ATOM 2179 H VAL A 215 62.070 80.400 28.590 1.00 0.08 A H
ATOM 2180 CA VAL A 215 62.450 81.660 30.140 1.00 0.08 A C
ATOM 2181 HA VAL A 215 62.550 81.410 31.200 1.00 0.08 A H
ATOM 2182 CB VAL A 215 63.510 82.690 29.720 1.00 0.08 A C
ATOM 2183 HB VAL A 215 63.350 83.640 30.220 1.00 0.08 A H
ATOM 2184 CG1 VAL A 215 64.900 82.340 30.160 1.00 0.08 A C
ATOM 2185 HG11 VAL A 215 64.990 81.590 30.950 1.00 0.08 A H
ATOM 2186 HG12 VAL A 215 65.470 81.930 29.330 1.00 0.08 A H
ATOM 2187 HG13 VAL A 215 65.280 83.300 30.450 1.00 0.08 A H
ATOM 2188 CG2 VAL A 215 63.500 82.960 28.190 1.00 0.08 A C
ATOM 2189 HG21 VAL A 215 64.050 83.890 28.080 1.00 0.08 A H
ATOM 2190 HG22 VAL A 215 63.880 82.120 27.600 1.00 0.08 A H
ATOM 2191 HG23 VAL A 215 62.460 83.100 27.880 1.00 0.08 A H
ATOM 2192 C VAL A 215 61.010 82.140 29.930 1.00 0.08 A C
ATOM 2193 O VAL A 215 60.410 81.930 28.820 1.00 0.08 A O
ATOM 2194 N ASP A 216 60.360 82.740 30.930 1.00 0.11 A N
ATOM 2195 H ASP A 216 60.940 83.020 31.700 1.00 0.11 A H
ATOM 2196 CA ASP A 216 59.070 83.400 30.860 1.00 0.11 A C
ATOM 2197 HA ASP A 216 58.700 83.400 29.840 1.00 0.11 A H
ATOM 2198 CB ASP A 216 58.020 82.600 31.730 1.00 0.11 A C
ATOM 2199 HB1 ASP A 216 58.500 82.470 32.710 1.00 0.11 A H
ATOM 2200 HB2 ASP A 216 57.970 81.730 31.080 1.00 0.11 A H
ATOM 2201 CG ASP A 216 56.680 83.340 31.760 1.00 0.11 A C
ATOM 2202 OD1 ASP A 216 56.120 83.600 32.870 1.00 0.11 A O
ATOM 2203 OD2 ASP A 216 56.250 83.820 30.610 1.00 0.11 A O
ATOM 2204 C ASP A 216 59.110 84.890 31.230 1.00 0.11 A C
ATOM 2205 O ASP A 216 59.850 85.260 32.090 1.00 0.11 A O
ATOM 2206 N LYS A 217 58.270 85.760 30.600 1.00 0.17 A N
ATOM 2207 H LYS A 217 57.480 85.320 30.140 1.00 0.17 A H
ATOM 2208 CA LYS A 217 58.170 87.190 30.850 1.00 0.17 A C
ATOM 2209 HA LYS A 217 59.110 87.570 31.240 1.00 0.17 A H
ATOM 2210 CB LYS A 217 57.940 87.970 29.500 1.00 0.17 A C
ATOM 2211 HB1 LYS A 217 57.030 87.610 29.020 1.00 0.17 A H
ATOM 2212 HB2 LYS A 217 58.720 87.740 28.770 1.00 0.17 A H
ATOM 2213 CG LYS A 217 57.960 89.460 29.690 1.00 0.17 A C
ATOM 2214 HG1 LYS A 217 58.900 89.630 30.230 1.00 0.17 A H
ATOM 2215 HG2 LYS A 217 57.140 89.700 30.380 1.00 0.17 A H
ATOM 2216 CD LYS A 217 57.910 90.200 28.390 1.00 0.17 A C
ATOM 2217 HD1 LYS A 217 57.010 89.870 27.880 1.00 0.17 A H
ATOM 2218 HD2 LYS A 217 58.770 90.100 27.720 1.00 0.17 A H
ATOM 2219 CE LYS A 217 57.880 91.750 28.500 1.00 0.17 A C
ATOM 2220 HE1 LYS A 217 58.270 92.270 27.620 1.00 0.17 A H
ATOM 2221 HE2 LYS A 217 58.580 91.990 29.300 1.00 0.17 A H
ATOM 2222 NZ LYS A 217 56.580 92.420 28.840 1.00 0.17 A N
ATOM 2223 HZ1 LYS A 217 56.280 93.030 28.090 1.00 0.17 A H
ATOM 2224 HZ2 LYS A 217 55.860 91.740 29.020 1.00 0.17 A H
ATOM 2225 HZ3 LYS A 217 56.670 93.000 29.650 1.00 0.17 A H
ATOM 2226 C LYS A 217 57.130 87.640 31.810 1.00 0.17 A C
ATOM 2227 O LYS A 217 57.400 88.350 32.790 1.00 0.17 A O
ATOM 2228 N GLU A 218 55.980 86.970 31.730 1.00 0.23 A N
ATOM 2229 H GLU A 218 55.830 86.350 30.950 1.00 0.23 A H
ATOM 2230 CA GLU A 218 54.850 87.320 32.680 1.00 0.23 A C
ATOM 2231 HA GLU A 218 54.610 88.370 32.500 1.00 0.23 A H
ATOM 2232 CB GLU A 218 53.600 86.490 32.320 1.00 0.23 A C
ATOM 2233 HB1 GLU A 218 52.870 86.580 33.130 1.00 0.23 A H
ATOM 2234 HB2 GLU A 218 53.920 85.470 32.130 1.00 0.23 A H
ATOM 2235 CG GLU A 218 52.890 87.120 31.150 1.00 0.23 A C
ATOM 2236 HG1 GLU A 218 53.660 87.330 30.410 1.00 0.23 A H
ATOM 2237 HG2 GLU A 218 52.480 88.050 31.530 1.00 0.23 A H
ATOM 2238 CD GLU A 218 51.760 86.220 30.510 1.00 0.23 A C
ATOM 2239 OE1 GLU A 218 51.840 84.950 30.690 1.00 0.23 A O
ATOM 2240 OE2 GLU A 218 50.880 86.700 29.700 1.00 0.23 A O
ATOM 2241 C GLU A 218 55.290 87.000 34.120 1.00 0.23 A C
ATOM 2242 O GLU A 218 54.930 87.820 34.990 1.00 0.23 A O
ATOM 2243 N THR A 219 55.960 85.910 34.460 1.00 0.12 A N
ATOM 2244 H THR A 219 56.320 85.320 33.730 1.00 0.12 A H
ATOM 2245 CA THR A 219 56.320 85.430 35.810 1.00 0.12 A C
ATOM 2246 HA THR A 219 55.770 85.910 36.630 1.00 0.12 A H
ATOM 2247 CB THR A 219 56.140 83.900 36.000 1.00 0.12 A C
ATOM 2248 HB THR A 219 56.470 83.580 36.980 1.00 0.12 A H
ATOM 2249 CG2 THR A 219 54.720 83.310 35.780 1.00 0.12 A C
ATOM 2250 HG21 THR A 219 54.830 82.220 35.760 1.00 0.12 A H
ATOM 2251 HG22 THR A 219 54.220 83.620 36.690 1.00 0.12 A H
ATOM 2252 HG23 THR A 219 54.200 83.670 34.900 1.00 0.12 A H
ATOM 2253 OG1 THR A 219 57.010 83.260 35.140 1.00 0.12 A O
ATOM 2254 HG1 THR A 219 56.550 83.420 34.310 1.00 0.12 A H
ATOM 2255 C THR A 219 57.800 85.790 36.140 1.00 0.12 A C
ATOM 2256 O THR A 219 58.120 85.800 37.300 1.00 0.12 A O
ATOM 2257 N SER A 220 58.630 86.230 35.220 1.00 0.09 A N
ATOM 2258 H SER A 220 58.260 86.270 34.270 1.00 0.09 A H
ATOM 2259 CA SER A 220 60.050 86.610 35.500 1.00 0.09 A C
ATOM 2260 HA SER A 220 60.440 86.830 34.500 1.00 0.09 A H
ATOM 2261 CB SER A 220 60.260 87.840 36.370 1.00 0.09 A C
ATOM 2262 HB1 SER A 220 61.300 88.110 36.570 1.00 0.09 A H
ATOM 2263 HB2 SER A 220 59.830 87.630 37.360 1.00 0.09 A H
ATOM 2264 OG SER A 220 59.600 88.950 35.770 1.00 0.09 A O
ATOM 2265 HG SER A 220 58.650 88.900 35.900 1.00 0.09 A H
ATOM 2266 C SER A 220 60.820 85.430 36.090 1.00 0.09 A C
ATOM 2267 O SER A 220 61.590 85.550 37.040 1.00 0.09 A O
ATOM 2268 N SER A 221 60.480 84.280 35.520 1.00 0.09 A N
ATOM 2269 H SER A 221 59.660 84.290 34.930 1.00 0.09 A H
ATOM 2270 CA SER A 221 61.170 83.000 35.820 1.00 0.09 A C
ATOM 2271 HA SER A 221 61.860 83.080 36.660 1.00 0.09 A H
ATOM 2272 CB SER A 221 60.060 82.080 36.260 1.00 0.09 A C
ATOM 2273 HB1 SER A 221 59.490 82.540 37.070 1.00 0.09 A H
ATOM 2274 HB2 SER A 221 60.470 81.130 36.580 1.00 0.09 A H
ATOM 2275 OG SER A 221 59.120 81.700 35.190 1.00 0.09 A O
ATOM 2276 HG SER A 221 58.300 82.180 35.320 1.00 0.09 A H
ATOM 2277 C SER A 221 61.980 82.410 34.650 1.00 0.09 A C
ATOM 2278 O SER A 221 61.640 82.790 33.520 1.00 0.09 A O
ATOM 2279 N ILE A 222 62.900 81.500 34.890 1.00 0.07 A N
ATOM 2280 H ILE A 222 63.120 81.340 35.870 1.00 0.07 A H
ATOM 2281 CA ILE A 222 63.530 80.670 33.950 1.00 0.07 A C
ATOM 2282 HA ILE A 222 63.200 80.980 32.960 1.00 0.07 A H
ATOM 2283 CB ILE A 222 65.050 80.960 34.040 1.00 0.07 A C
ATOM 2284 HB ILE A 222 65.640 80.510 33.240 1.00 0.07 A H
ATOM 2285 CG2 ILE A 222 65.380 82.480 33.970 1.00 0.07 A C
ATOM 2286 HG21 ILE A 222 64.930 82.950 34.850 1.00 0.07 A H
ATOM 2287 HG22 ILE A 222 66.400 82.820 33.820 1.00 0.07 A H
ATOM 2288 HG23 ILE A 222 64.860 82.880 33.090 1.00 0.07 A H
ATOM 2289 CG1 ILE A 222 65.890 80.440 35.270 1.00 0.07 A C
ATOM 2290 HG11 ILE A 222 65.470 79.510 35.660 1.00 0.07 A H
ATOM 2291 HG12 ILE A 222 65.740 81.180 36.060 1.00 0.07 A H
ATOM 2292 CD ILE A 222 67.390 80.240 35.070 1.00 0.07 A C
ATOM 2293 HD1 ILE A 222 67.810 81.130 34.600 1.00 0.07 A H
ATOM 2294 HD2 ILE A 222 67.880 80.170 36.040 1.00 0.07 A H
ATOM 2295 HD3 ILE A 222 67.620 79.290 34.600 1.00 0.07 A H
ATOM 2296 C ILE A 222 63.290 79.130 34.240 1.00 0.07 A C
ATOM 2297 O ILE A 222 62.910 78.730 35.320 1.00 0.07 A O
ATOM 2298 N THR A 223 63.420 78.270 33.180 1.00 0.08 A N
ATOM 2299 H THR A 223 63.850 78.570 32.320 1.00 0.08 A H
ATOM 2300 CA THR A 223 63.200 76.850 33.380 1.00 0.08 A C
ATOM 2301 HA THR A 223 62.770 76.640 34.350 1.00 0.08 A H
ATOM 2302 CB THR A 223 62.170 76.310 32.270 1.00 0.08 A C
ATOM 2303 HB THR A 223 62.670 76.260 31.300 1.00 0.08 A H
ATOM 2304 CG2 THR A 223 61.650 74.880 32.530 1.00 0.08 A C
ATOM 2305 HG21 THR A 223 60.990 74.660 33.360 1.00 0.08 A H
ATOM 2306 HG22 THR A 223 61.140 74.650 31.590 1.00 0.08 A H
ATOM 2307 HG23 THR A 223 62.490 74.180 32.600 1.00 0.08 A H
ATOM 2308 OG1 THR A 223 61.000 77.110 32.030 1.00 0.08 A O
ATOM 2309 HG1 THR A 223 61.180 78.050 32.130 1.00 0.08 A H
ATOM 2310 C THR A 223 64.480 76.140 33.150 1.00 0.08 A C
ATOM 2311 O THR A 223 65.310 76.580 32.310 1.00 0.08 A O
ATOM 2312 N PHE A 224 64.700 74.960 33.860 1.00 0.07 A N
ATOM 2313 H PHE A 224 63.920 74.610 34.400 1.00 0.07 A H
ATOM 2314 CA PHE A 224 65.900 74.150 33.780 1.00 0.07 A C
ATOM 2315 HA PHE A 224 66.290 74.200 32.760 1.00 0.07 A H
ATOM 2316 CB PHE A 224 66.940 74.750 34.820 1.00 0.07 A C
ATOM 2317 HB1 PHE A 224 67.300 75.760 34.590 1.00 0.07 A H
ATOM 2318 HB2 PHE A 224 67.850 74.170 34.840 1.00 0.07 A H
ATOM 2319 CG PHE A 224 66.440 74.780 36.290 1.00 0.07 A C
ATOM 2320 CD1 PHE A 224 65.680 75.840 36.760 1.00 0.07 A C
ATOM 2321 HD1 PHE A 224 65.410 76.610 36.040 1.00 0.07 A H
ATOM 2322 CE1 PHE A 224 65.210 75.830 38.100 1.00 0.07 A C
ATOM 2323 HE1 PHE A 224 64.600 76.640 38.480 1.00 0.07 A H
ATOM 2324 CZ PHE A 224 65.500 74.710 38.930 1.00 0.07 A C
ATOM 2325 HZ PHE A 224 65.170 74.780 39.950 1.00 0.07 A H
ATOM 2326 CE2 PHE A 224 66.250 73.710 38.520 1.00 0.07 A C
ATOM 2327 HE2 PHE A 224 66.510 72.920 39.220 1.00 0.07 A H
ATOM 2328 CD2 PHE A 224 66.650 73.720 37.140 1.00 0.07 A C
ATOM 2329 HD2 PHE A 224 67.190 72.880 36.710 1.00 0.07 A H
ATOM 2330 C PHE A 224 65.660 72.650 34.030 1.00 0.07 A C
ATOM 2331 O PHE A 224 64.690 72.250 34.720 1.00 0.07 A O
ATOM 2332 N HIS A 225 66.570 71.800 33.490 1.00 0.09 A N
ATOM 2333 H HIS A 225 67.270 72.300 32.960 1.00 0.09 A H
ATOM 2334 CA HIS A 225 66.830 70.390 33.920 1.00 0.09 A C
ATOM 2335 HA HIS A 225 65.910 70.020 34.350 1.00 0.09 A H
ATOM 2336 CB HIS A 225 67.220 69.530 32.700 1.00 0.09 A C
ATOM 2337 HB1 HIS A 225 67.790 68.710 33.120 1.00 0.09 A H
ATOM 2338 HB2 HIS A 225 67.940 70.040 32.060 1.00 0.09 A H
ATOM 2339 CG HIS A 225 66.010 69.070 31.900 1.00 0.09 A C
ATOM 2340 ND1 HIS A 225 64.680 69.420 32.190 1.00 0.09 A N
ATOM 2341 CE1 HIS A 225 64.060 68.750 31.150 1.00 0.09 A C
ATOM 2342 HE1 HIS A 225 63.020 68.860 30.920 1.00 0.09 A H
ATOM 2343 NE2 HIS A 225 64.900 68.060 30.300 1.00 0.09 A N
ATOM 2344 HE2 HIS A 225 64.620 67.450 29.550 1.00 0.09 A H
ATOM 2345 CD2 HIS A 225 66.150 68.250 30.820 1.00 0.09 A C
ATOM 2346 HD2 HIS A 225 67.010 67.680 30.530 1.00 0.09 A H
ATOM 2347 C HIS A 225 68.050 70.320 34.930 1.00 0.09 A C
ATOM 2348 O HIS A 225 69.200 70.620 34.480 1.00 0.09 A O
ATOM 2349 N ASP A 226 67.780 69.860 36.200 1.00 0.07 A N
ATOM 2350 H ASP A 226 66.780 69.730 36.300 1.00 0.07 A H
ATOM 2351 CA ASP A 226 68.790 69.630 37.300 1.00 0.07 A C
ATOM 2352 HA ASP A 226 69.660 70.170 36.940 1.00 0.07 A H
ATOM 2353 CB ASP A 226 68.250 70.110 38.660 1.00 0.07 A C
ATOM 2354 HB1 ASP A 226 67.520 69.350 38.950 1.00 0.07 A H
ATOM 2355 HB2 ASP A 226 67.760 71.070 38.560 1.00 0.07 A H
ATOM 2356 CG ASP A 226 69.330 70.250 39.720 1.00 0.07 A C
ATOM 2357 OD1 ASP A 226 70.310 69.530 39.560 1.00 0.07 A O
ATOM 2358 OD2 ASP A 226 69.130 70.950 40.750 1.00 0.07 A O
ATOM 2359 C ASP A 226 69.130 68.130 37.480 1.00 0.07 A C
ATOM 2360 O ASP A 226 68.290 67.300 37.940 1.00 0.07 A O
ATOM 2361 N PRO A 227 70.390 67.690 37.180 1.00 0.08 A N
ATOM 2362 CD PRO A 227 71.460 68.500 36.460 1.00 0.08 A C
ATOM 2363 HD1 PRO A 227 71.760 69.340 37.080 1.00 0.08 A H
ATOM 2364 HD2 PRO A 227 71.120 68.820 35.480 1.00 0.08 A H
ATOM 2365 CG PRO A 227 72.580 67.490 36.220 1.00 0.08 A C
ATOM 2366 HG1 PRO A 227 73.520 68.030 36.370 1.00 0.08 A H
ATOM 2367 HG2 PRO A 227 72.430 67.020 35.260 1.00 0.08 A H
ATOM 2368 CB PRO A 227 72.370 66.410 37.350 1.00 0.08 A C
ATOM 2369 HB1 PRO A 227 72.840 66.760 38.270 1.00 0.08 A H
ATOM 2370 HB2 PRO A 227 72.800 65.440 37.100 1.00 0.08 A H
ATOM 2371 CA PRO A 227 70.840 66.390 37.570 1.00 0.08 A C
ATOM 2372 HA PRO A 227 70.380 65.660 36.910 1.00 0.08 A H
ATOM 2373 C PRO A 227 70.590 65.880 39.030 1.00 0.08 A C
ATOM 2374 O PRO A 227 70.630 64.640 39.220 1.00 0.08 A O
ATOM 2375 N ARG A 228 70.290 66.750 40.050 1.00 0.09 A N
ATOM 2376 H ARG A 228 70.420 67.740 39.890 1.00 0.09 A H
ATOM 2377 CA ARG A 228 69.970 66.410 41.410 1.00 0.09 A C
ATOM 2378 HA ARG A 228 70.260 65.390 41.590 1.00 0.09 A H
ATOM 2379 CB ARG A 228 70.800 67.340 42.270 1.00 0.09 A C
ATOM 2380 HB1 ARG A 228 70.550 68.370 41.980 1.00 0.09 A H
ATOM 2381 HB2 ARG A 228 71.840 67.260 41.950 1.00 0.09 A H
ATOM 2382 CG ARG A 228 70.670 67.080 43.760 1.00 0.09 A C
ATOM 2383 HG1 ARG A 228 70.560 66.010 43.930 1.00 0.09 A H
ATOM 2384 HG2 ARG A 228 69.810 67.600 44.170 1.00 0.09 A H
ATOM 2385 CD ARG A 228 71.990 67.420 44.550 1.00 0.09 A C
ATOM 2386 HD1 ARG A 228 72.790 67.030 43.910 1.00 0.09 A H
ATOM 2387 HD2 ARG A 228 72.100 67.080 45.570 1.00 0.09 A H
ATOM 2388 NE ARG A 228 72.200 68.880 44.520 1.00 0.09 A N
ATOM 2389 HE ARG A 228 71.440 69.500 44.270 1.00 0.09 A H
ATOM 2390 CZ ARG A 228 73.350 69.500 44.600 1.00 0.09 A C
ATOM 2391 NH1 ARG A 228 74.420 68.850 44.900 1.00 0.09 A N
ATOM 2392 HH11 ARG A 228 74.430 67.850 45.060 1.00 0.09 A H
ATOM 2393 HH12 ARG A 228 75.300 69.320 45.060 1.00 0.09 A H
ATOM 2394 NH2 ARG A 228 73.490 70.730 44.150 1.00 0.09 A N
ATOM 2395 HH21 ARG A 228 72.690 71.160 43.720 1.00 0.09 A H
ATOM 2396 HH22 ARG A 228 74.420 70.910 43.810 1.00 0.09 A H
ATOM 2397 C ARG A 228 68.430 66.530 41.720 1.00 0.09 A C
ATOM 2398 O ARG A 228 67.940 65.630 42.450 1.00 0.09 A O
ATOM 2399 N GLN A 229 67.780 67.650 41.270 1.00 0.10 A N
ATOM 2400 H GLN A 229 68.360 68.370 40.860 1.00 0.10 A H
ATOM 2401 CA GLN A 229 66.450 67.830 41.760 1.00 0.10 A C
ATOM 2402 HA GLN A 229 66.380 67.400 42.760 1.00 0.10 A H
ATOM 2403 CB GLN A 229 66.220 69.370 42.040 1.00 0.10 A C
ATOM 2404 HB1 GLN A 229 65.230 69.440 42.490 1.00 0.10 A H
ATOM 2405 HB2 GLN A 229 66.230 70.070 41.210 1.00 0.10 A H
ATOM 2406 CG GLN A 229 67.180 69.830 43.190 1.00 0.10 A C
ATOM 2407 HG1 GLN A 229 68.230 69.700 42.920 1.00 0.10 A H
ATOM 2408 HG2 GLN A 229 66.880 69.350 44.120 1.00 0.10 A H
ATOM 2409 CD GLN A 229 66.910 71.310 43.510 1.00 0.10 A C
ATOM 2410 OE1 GLN A 229 66.260 71.690 44.460 1.00 0.10 A O
ATOM 2411 NE2 GLN A 229 67.440 72.180 42.660 1.00 0.10 A N
ATOM 2412 HE21 GLN A 229 67.950 71.840 41.850 1.00 0.10 A H
ATOM 2413 HE22 GLN A 229 67.300 73.170 42.730 1.00 0.10 A H
ATOM 2414 C GLN A 229 65.420 67.180 40.800 1.00 0.10 A C
ATOM 2415 O GLN A 229 64.430 66.650 41.260 1.00 0.10 A O
ATOM 2416 N GLY A 230 65.720 67.190 39.510 1.00 0.09 A N
ATOM 2417 H GLY A 230 66.530 67.740 39.290 1.00 0.09 A H
ATOM 2418 CA GLY A 230 64.970 66.590 38.430 1.00 0.09 A C
ATOM 2419 HA1 GLY A 230 64.030 66.350 38.900 1.00 0.09 A H
ATOM 2420 HA2 GLY A 230 65.390 65.660 38.060 1.00 0.09 A H
ATOM 2421 C GLY A 230 64.620 67.490 37.230 1.00 0.09 A C
ATOM 2422 O GLY A 230 65.120 68.590 37.090 1.00 0.09 A O
ATOM 2423 N PRO A 231 63.800 67.070 36.250 1.00 0.10 A N
ATOM 2424 CD PRO A 231 63.550 65.640 36.090 1.00 0.10 A C
ATOM 2425 HD1 PRO A 231 63.150 65.100 36.950 1.00 0.10 A H
ATOM 2426 HD2 PRO A 231 64.450 65.080 35.870 1.00 0.10 A H
ATOM 2427 CG PRO A 231 62.670 65.500 34.830 1.00 0.10 A C
ATOM 2428 HG1 PRO A 231 61.610 65.670 35.010 1.00 0.10 A H
ATOM 2429 HG2 PRO A 231 62.860 64.560 34.320 1.00 0.10 A H
ATOM 2430 CB PRO A 231 63.270 66.630 33.980 1.00 0.10 A C
ATOM 2431 HB1 PRO A 231 62.610 66.910 33.160 1.00 0.10 A H
ATOM 2432 HB2 PRO A 231 64.160 66.230 33.520 1.00 0.10 A H
ATOM 2433 CA PRO A 231 63.530 67.790 35.000 1.00 0.10 A C
ATOM 2434 HA PRO A 231 64.300 68.450 34.640 1.00 0.10 A H
ATOM 2435 C PRO A 231 62.260 68.640 35.080 1.00 0.10 A C
ATOM 2436 O PRO A 231 61.420 68.290 35.830 1.00 0.10 A O
ATOM 2437 N ASP A 232 62.200 69.670 34.260 1.00 0.12 A N
ATOM 2438 H ASP A 232 63.050 69.860 33.740 1.00 0.12 A H
ATOM 2439 CA ASP A 232 61.110 70.640 34.170 1.00 0.12 A C
ATOM 2440 HA ASP A 232 61.530 71.320 33.440 1.00 0.12 A H
ATOM 2441 CB ASP A 232 59.820 70.100 33.510 1.00 0.12 A C
ATOM 2442 HB1 ASP A 232 59.160 70.950 33.400 1.00 0.12 A H
ATOM 2443 HB2 ASP A 232 59.500 69.360 34.250 1.00 0.12 A H
ATOM 2444 CG ASP A 232 60.100 69.540 32.060 1.00 0.12 A C
ATOM 2445 OD1 ASP A 232 59.510 68.480 31.780 1.00 0.12 A O
ATOM 2446 OD2 ASP A 232 60.810 70.220 31.290 1.00 0.12 A O
ATOM 2447 C ASP A 232 60.940 71.620 35.350 1.00 0.12 A C
ATOM 2448 O ASP A 232 59.830 72.040 35.710 1.00 0.12 A O
ATOM 2449 N LEU A 233 62.000 71.960 36.120 1.00 0.11 A N
ATOM 2450 H LEU A 233 62.950 71.760 35.820 1.00 0.11 A H
ATOM 2451 CA LEU A 233 61.870 72.910 37.220 1.00 0.11 A C
ATOM 2452 HA LEU A 233 60.840 72.900 37.580 1.00 0.11 A H
ATOM 2453 CB LEU A 233 62.740 72.470 38.430 1.00 0.11 A C
ATOM 2454 HB1 LEU A 233 62.680 73.200 39.240 1.00 0.11 A H
ATOM 2455 HB2 LEU A 233 63.780 72.470 38.110 1.00 0.11 A H
ATOM 2456 CG LEU A 233 62.440 71.070 39.060 1.00 0.11 A C
ATOM 2457 HG LEU A 233 62.250 70.320 38.300 1.00 0.11 A H
ATOM 2458 CD1 LEU A 233 63.580 70.460 39.930 1.00 0.11 A C
ATOM 2459 HD11 LEU A 233 64.440 70.440 39.270 1.00 0.11 A H
ATOM 2460 HD12 LEU A 233 63.850 71.130 40.750 1.00 0.11 A H
ATOM 2461 HD13 LEU A 233 63.310 69.480 40.300 1.00 0.11 A H
ATOM 2462 CD2 LEU A 233 61.160 71.090 39.810 1.00 0.11 A C
ATOM 2463 HD21 LEU A 233 60.880 70.120 40.250 1.00 0.11 A H
ATOM 2464 HD22 LEU A 233 61.180 71.730 40.690 1.00 0.11 A H
ATOM 2465 HD23 LEU A 233 60.340 71.380 39.160 1.00 0.11 A H
ATOM 2466 C LEU A 233 62.090 74.370 36.810 1.00 0.11 A C
ATOM 2467 O LEU A 233 62.440 74.690 35.680 1.00 0.11 A O
ATOM 2468 N ALA A 234 61.840 75.340 37.760 1.00 0.08 A N
ATOM 2469 H ALA A 234 61.390 75.000 38.600 1.00 0.08 A H
ATOM 2470 CA ALA A 234 61.770 76.820 37.550 1.00 0.08 A C
ATOM 2471 HA ALA A 234 62.530 77.070 36.810 1.00 0.08 A H
ATOM 2472 CB ALA A 234 60.410 77.130 36.990 1.00 0.08 A C
ATOM 2473 HB1 ALA A 234 60.400 78.170 36.640 1.00 0.08 A H
ATOM 2474 HB2 ALA A 234 60.200 76.510 36.120 1.00 0.08 A H
ATOM 2475 HB3 ALA A 234 59.600 76.960 37.690 1.00 0.08 A H
ATOM 2476 C ALA A 234 62.120 77.660 38.810 1.00 0.08 A C
ATOM 2477 O ALA A 234 61.520 77.500 39.870 1.00 0.08 A O
ATOM 2478 N MET A 235 63.020 78.660 38.610 1.00 0.08 A N
ATOM 2479 H MET A 235 63.230 78.930 37.660 1.00 0.08 A H
ATOM 2480 CA MET A 235 63.400 79.700 39.580 1.00 0.08 A C
ATOM 2481 HA MET A 235 62.780 79.730 40.480 1.00 0.08 A H
ATOM 2482 CB MET A 235 64.820 79.420 40.060 1.00 0.08 A C
ATOM 2483 HB1 MET A 235 64.970 78.390 40.390 1.00 0.08 A H
ATOM 2484 HB2 MET A 235 64.960 80.030 40.960 1.00 0.08 A H
ATOM 2485 CG MET A 235 65.870 79.780 38.970 1.00 0.08 A C
ATOM 2486 HG1 MET A 235 65.830 80.820 38.660 1.00 0.08 A H
ATOM 2487 HG2 MET A 235 65.680 79.140 38.100 1.00 0.08 A H
ATOM 2488 SD MET A 235 67.600 79.460 39.530 1.00 0.08 A S
ATOM 2489 CE MET A 235 67.830 77.670 39.260 1.00 0.08 A C
ATOM 2490 HE1 MET A 235 67.000 77.060 39.650 1.00 0.08 A H
ATOM 2491 HE2 MET A 235 68.000 77.390 38.220 1.00 0.08 A H
ATOM 2492 HE3 MET A 235 68.640 77.240 39.830 1.00 0.08 A H
ATOM 2493 C MET A 235 63.270 81.110 39.030 1.00 0.08 A C
ATOM 2494 O MET A 235 63.010 81.250 37.840 1.00 0.08 A O
ATOM 2495 N PRO A 236 63.110 82.150 39.890 1.00 0.07 A N
ATOM 2496 CD PRO A 236 62.960 82.120 41.330 1.00 0.07 A C
ATOM 2497 HD1 PRO A 236 63.910 81.880 41.820 1.00 0.07 A H
ATOM 2498 HD2 PRO A 236 62.170 81.400 41.540 1.00 0.07 A H
ATOM 2499 CG PRO A 236 62.450 83.490 41.740 1.00 0.07 A C
ATOM 2500 HG1 PRO A 236 62.820 83.800 42.710 1.00 0.07 A H
ATOM 2501 HG2 PRO A 236 61.380 83.490 41.520 1.00 0.07 A H
ATOM 2502 CB PRO A 236 63.020 84.380 40.710 1.00 0.07 A C
ATOM 2503 HB1 PRO A 236 64.070 84.660 40.900 1.00 0.07 A H
ATOM 2504 HB2 PRO A 236 62.390 85.260 40.570 1.00 0.07 A H
ATOM 2505 CA PRO A 236 63.130 83.530 39.440 1.00 0.07 A C
ATOM 2506 HA PRO A 236 62.240 83.720 38.810 1.00 0.07 A H
ATOM 2507 C PRO A 236 64.360 83.850 38.690 1.00 0.07 A C
ATOM 2508 O PRO A 236 65.500 83.430 38.930 1.00 0.07 A O
ATOM 2509 N LEU A 237 64.190 84.830 37.800 1.00 0.09 A N
ATOM 2510 H LEU A 237 63.240 85.040 37.530 1.00 0.09 A H
ATOM 2511 CA LEU A 237 65.180 85.480 36.950 1.00 0.09 A C
ATOM 2512 HA LEU A 237 65.780 84.730 36.450 1.00 0.09 A H
ATOM 2513 CB LEU A 237 64.410 86.320 35.960 1.00 0.09 A C
ATOM 2514 HB1 LEU A 237 63.610 86.970 36.340 1.00 0.09 A H
ATOM 2515 HB2 LEU A 237 63.950 85.560 35.330 1.00 0.09 A H
ATOM 2516 CG LEU A 237 65.280 87.140 35.030 1.00 0.09 A C
ATOM 2517 HG LEU A 237 65.950 87.680 35.690 1.00 0.09 A H
ATOM 2518 CD1 LEU A 237 66.110 86.160 34.090 1.00 0.09 A C
ATOM 2519 HD11 LEU A 237 66.780 85.460 34.600 1.00 0.09 A H
ATOM 2520 HD12 LEU A 237 65.390 85.610 33.490 1.00 0.09 A H
ATOM 2521 HD13 LEU A 237 66.660 86.770 33.370 1.00 0.09 A H
ATOM 2522 CD2 LEU A 237 64.580 88.140 34.100 1.00 0.09 A C
ATOM 2523 HD21 LEU A 237 63.930 88.800 34.680 1.00 0.09 A H
ATOM 2524 HD22 LEU A 237 65.290 88.840 33.650 1.00 0.09 A H
ATOM 2525 HD23 LEU A 237 64.120 87.570 33.300 1.00 0.09 A H
ATOM 2526 C LEU A 237 66.210 86.340 37.650 1.00 0.09 A C
ATOM 2527 O LEU A 237 67.400 86.340 37.420 1.00 0.09 A O
ATOM 2528 N ASP A 238 65.650 86.940 38.630 1.00 0.14 A N
ATOM 2529 H ASP A 238 64.660 86.800 38.730 1.00 0.14 A H
ATOM 2530 CA ASP A 238 66.400 87.640 39.700 1.00 0.14 A C
ATOM 2531 HA ASP A 238 67.040 88.410 39.270 1.00 0.14 A H
ATOM 2532 CB ASP A 238 65.430 88.510 40.630 1.00 0.14 A C
ATOM 2533 HB1 ASP A 238 65.150 89.460 40.180 1.00 0.14 A H
ATOM 2534 HB2 ASP A 238 65.930 88.680 41.570 1.00 0.14 A H
ATOM 2535 CG ASP A 238 64.090 87.800 40.870 1.00 0.14 A C
ATOM 2536 OD1 ASP A 238 63.250 87.730 39.940 1.00 0.14 A O
ATOM 2537 OD2 ASP A 238 63.900 87.330 42.020 1.00 0.14 A O
ATOM 2538 C ASP A 238 67.280 86.740 40.560 1.00 0.14 A C
ATOM 2539 O ASP A 238 68.420 87.100 40.730 1.00 0.14 A O
ATOM 2540 N TYR A 239 66.830 85.570 41.000 1.00 0.09 A N
ATOM 2541 H TYR A 239 65.860 85.340 40.800 1.00 0.09 A H
ATOM 2542 CA TYR A 239 67.680 84.590 41.650 1.00 0.09 A C
ATOM 2543 HA TYR A 239 68.180 85.170 42.410 1.00 0.09 A H
ATOM 2544 CB TYR A 239 66.880 83.540 42.340 1.00 0.09 A C
ATOM 2545 HB1 TYR A 239 66.460 82.830 41.620 1.00 0.09 A H
ATOM 2546 HB2 TYR A 239 66.110 84.060 42.910 1.00 0.09 A H
ATOM 2547 CG TYR A 239 67.600 82.610 43.340 1.00 0.09 A C
ATOM 2548 CD1 TYR A 239 67.960 81.310 42.960 1.00 0.09 A C
ATOM 2549 HD1 TYR A 239 67.680 80.940 41.980 1.00 0.09 A H
ATOM 2550 CE1 TYR A 239 68.530 80.460 43.970 1.00 0.09 A C
ATOM 2551 HE1 TYR A 239 68.880 79.450 43.820 1.00 0.09 A H
ATOM 2552 CZ TYR A 239 68.650 80.940 45.320 1.00 0.09 A C
ATOM 2553 OH TYR A 239 69.170 80.180 46.320 1.00 0.09 A O
ATOM 2554 HH TYR A 239 69.170 80.620 47.170 1.00 0.09 A H
ATOM 2555 CE2 TYR A 239 68.350 82.260 45.680 1.00 0.09 A C
ATOM 2556 HE2 TYR A 239 68.400 82.710 46.660 1.00 0.09 A H
ATOM 2557 CD2 TYR A 239 67.750 83.060 44.670 1.00 0.09 A C
ATOM 2558 HD2 TYR A 239 67.540 84.080 44.940 1.00 0.09 A H
ATOM 2559 C TYR A 239 68.730 83.970 40.730 1.00 0.09 A C
ATOM 2560 O TYR A 239 69.900 83.750 41.130 1.00 0.09 A O
ATOM 2561 N PHE A 240 68.450 83.750 39.440 1.00 0.06 A N
ATOM 2562 H PHE A 240 67.490 83.940 39.170 1.00 0.06 A H
ATOM 2563 CA PHE A 240 69.450 83.260 38.450 1.00 0.06 A C
ATOM 2564 HA PHE A 240 69.850 82.350 38.890 1.00 0.06 A H
ATOM 2565 CB PHE A 240 68.840 82.830 37.060 1.00 0.06 A C
ATOM 2566 HB1 PHE A 240 68.250 83.660 36.660 1.00 0.06 A H
ATOM 2567 HB2 PHE A 240 68.150 82.020 37.270 1.00 0.06 A H
ATOM 2568 CG PHE A 240 69.820 82.420 36.080 1.00 0.06 A C
ATOM 2569 CD1 PHE A 240 70.250 83.280 35.060 1.00 0.06 A C
ATOM 2570 HD1 PHE A 240 69.870 84.300 35.010 1.00 0.06 A H
ATOM 2571 CE1 PHE A 240 71.100 82.880 34.010 1.00 0.06 A C
ATOM 2572 HE1 PHE A 240 71.340 83.530 33.180 1.00 0.06 A H
ATOM 2573 CZ PHE A 240 71.520 81.570 34.080 1.00 0.06 A C
ATOM 2574 HZ PHE A 240 72.100 81.140 33.280 1.00 0.06 A H
ATOM 2575 CE2 PHE A 240 71.210 80.720 35.160 1.00 0.06 A C
ATOM 2576 HE2 PHE A 240 71.550 79.690 35.160 1.00 0.06 A H
ATOM 2577 CD2 PHE A 240 70.380 81.150 36.170 1.00 0.06 A C
ATOM 2578 HD2 PHE A 240 70.080 80.400 36.880 1.00 0.06 A H
ATOM 2579 C PHE A 240 70.620 84.250 38.420 1.00 0.06 A C
ATOM 2580 O PHE A 240 71.810 83.920 38.620 1.00 0.06 A O
ATOM 2581 N ASN A 241 70.300 85.570 38.210 1.00 0.07 A N
ATOM 2582 H ASN A 241 69.330 85.790 38.350 1.00 0.07 A H
ATOM 2583 CA ASN A 241 71.240 86.680 38.180 1.00 0.07 A C
ATOM 2584 HA ASN A 241 71.820 86.450 37.280 1.00 0.07 A H
ATOM 2585 CB ASN A 241 70.520 87.970 37.860 1.00 0.07 A C
ATOM 2586 HB1 ASN A 241 71.130 88.820 38.180 1.00 0.07 A H
ATOM 2587 HB2 ASN A 241 69.500 87.990 38.260 1.00 0.07 A H
ATOM 2588 CG ASN A 241 70.240 88.050 36.400 1.00 0.07 A C
ATOM 2589 OD1 ASN A 241 71.180 87.990 35.620 1.00 0.07 A O
ATOM 2590 ND2 ASN A 241 69.050 88.150 35.970 1.00 0.07 A N
ATOM 2591 HD21 ASN A 241 68.250 88.050 36.580 1.00 0.07 A H
ATOM 2592 HD22 ASN A 241 68.910 88.200 34.960 1.00 0.07 A H
ATOM 2593 C ASN A 241 72.070 86.680 39.530 1.00 0.07 A C
ATOM 2594 O ASN A 241 73.290 86.890 39.440 1.00 0.07 A O
ATOM 2595 N GLN A 242 71.440 86.540 40.690 1.00 0.14 A N
ATOM 2596 H GLN A 242 70.430 86.420 40.670 1.00 0.14 A H
ATOM 2597 CA GLN A 242 72.150 86.510 41.990 1.00 0.14 A C
ATOM 2598 HA GLN A 242 72.720 87.430 42.100 1.00 0.14 A H
ATOM 2599 CB GLN A 242 71.050 86.600 43.050 1.00 0.14 A C
ATOM 2600 HB1 GLN A 242 70.410 85.710 42.980 1.00 0.14 A H
ATOM 2601 HB2 GLN A 242 70.520 87.490 42.750 1.00 0.14 A H
ATOM 2602 CG GLN A 242 71.570 86.790 44.510 1.00 0.14 A C
ATOM 2603 HG1 GLN A 242 72.250 87.650 44.500 1.00 0.14 A H
ATOM 2604 HG2 GLN A 242 72.040 85.860 44.840 1.00 0.14 A H
ATOM 2605 CD GLN A 242 70.430 87.170 45.420 1.00 0.14 A C
ATOM 2606 OE1 GLN A 242 69.340 86.560 45.430 1.00 0.14 A O
ATOM 2607 NE2 GLN A 242 70.530 88.060 46.380 1.00 0.14 A N
ATOM 2608 HE21 GLN A 242 71.380 88.590 46.560 1.00 0.14 A H
ATOM 2609 HE22 GLN A 242 69.730 88.230 46.980 1.00 0.14 A H
ATOM 2610 C GLN A 242 73.120 85.330 42.150 1.00 0.14 A C
ATOM 2611 O GLN A 242 74.090 85.430 42.880 1.00 0.14 A O
ATOM 2612 N ARG A 243 72.740 84.180 41.500 1.00 0.11 A N
ATOM 2613 H ARG A 243 71.810 84.190 41.110 1.00 0.11 A H
ATOM 2614 CA ARG A 243 73.310 82.840 41.860 1.00 0.11 A C
ATOM 2615 HA ARG A 243 73.990 83.010 42.690 1.00 0.11 A H
ATOM 2616 CB ARG A 243 72.190 81.950 42.540 1.00 0.11 A C
ATOM 2617 HB1 ARG A 243 72.700 81.080 42.950 1.00 0.11 A H
ATOM 2618 HB2 ARG A 243 71.460 81.790 41.750 1.00 0.11 A H
ATOM 2619 CG ARG A 243 71.500 82.580 43.760 1.00 0.11 A C
ATOM 2620 HG1 ARG A 243 70.740 81.920 44.180 1.00 0.11 A H
ATOM 2621 HG2 ARG A 243 71.020 83.510 43.440 1.00 0.11 A H
ATOM 2622 CD ARG A 243 72.350 82.840 44.940 1.00 0.11 A C
ATOM 2623 HD1 ARG A 243 71.770 83.440 45.620 1.00 0.11 A H
ATOM 2624 HD2 ARG A 243 73.280 83.390 44.720 1.00 0.11 A H
ATOM 2625 NE ARG A 243 72.580 81.550 45.740 1.00 0.11 A N
ATOM 2626 HE ARG A 243 72.260 80.690 45.330 1.00 0.11 A H
ATOM 2627 CZ ARG A 243 72.820 81.580 47.050 1.00 0.11 A C
ATOM 2628 NH1 ARG A 243 73.060 82.650 47.680 1.00 0.11 A N
ATOM 2629 HH11 ARG A 243 72.990 83.510 47.170 1.00 0.11 A H
ATOM 2630 HH12 ARG A 243 73.370 82.550 48.640 1.00 0.11 A H
ATOM 2631 NH2 ARG A 243 72.990 80.460 47.710 1.00 0.11 A N
ATOM 2632 HH21 ARG A 243 72.910 79.570 47.230 1.00 0.11 A H
ATOM 2633 HH22 ARG A 243 72.930 80.440 48.710 1.00 0.11 A H
ATOM 2634 C ARG A 243 74.130 82.130 40.730 1.00 0.11 A C
ATOM 2635 O ARG A 243 74.870 81.220 41.080 1.00 0.11 A O
ATOM 2636 N LEU A 244 74.030 82.520 39.490 1.00 0.09 A N
ATOM 2637 H LEU A 244 73.310 83.200 39.270 1.00 0.09 A H
ATOM 2638 CA LEU A 244 74.920 82.100 38.430 1.00 0.09 A C
ATOM 2639 HA LEU A 244 74.690 81.050 38.240 1.00 0.09 A H
ATOM 2640 CB LEU A 244 74.530 83.020 37.210 1.00 0.09 A C
ATOM 2641 HB1 LEU A 244 74.480 84.050 37.540 1.00 0.09 A H
ATOM 2642 HB2 LEU A 244 73.550 82.640 36.960 1.00 0.09 A H
ATOM 2643 CG LEU A 244 75.340 83.050 35.840 1.00 0.09 A C
ATOM 2644 HG LEU A 244 76.350 83.400 36.080 1.00 0.09 A H
ATOM 2645 CD1 LEU A 244 75.300 81.690 35.180 1.00 0.09 A C
ATOM 2646 HD11 LEU A 244 75.820 81.690 34.220 1.00 0.09 A H
ATOM 2647 HD12 LEU A 244 75.760 80.860 35.730 1.00 0.09 A H
ATOM 2648 HD13 LEU A 244 74.250 81.390 35.070 1.00 0.09 A H
ATOM 2649 CD2 LEU A 244 74.740 84.070 34.830 1.00 0.09 A C
ATOM 2650 HD21 LEU A 244 73.690 83.790 34.680 1.00 0.09 A H
ATOM 2651 HD22 LEU A 244 74.750 85.140 35.100 1.00 0.09 A H
ATOM 2652 HD23 LEU A 244 75.230 84.080 33.870 1.00 0.09 A H
ATOM 2653 C LEU A 244 76.410 82.250 38.850 1.00 0.09 A C
ATOM 2654 O LEU A 244 76.790 83.170 39.640 1.00 0.09 A O
ATOM 2655 N ALA A 245 77.260 81.430 38.210 1.00 0.06 A N
ATOM 2656 H ALA A 245 76.860 80.720 37.620 1.00 0.06 A H
ATOM 2657 CA ALA A 245 78.690 81.310 38.520 1.00 0.06 A C
ATOM 2658 HA ALA A 245 78.750 81.420 39.600 1.00 0.06 A H
ATOM 2659 CB ALA A 245 79.280 79.880 38.260 1.00 0.06 A C
ATOM 2660 HB1 ALA A 245 78.550 79.160 38.630 1.00 0.06 A H
ATOM 2661 HB2 ALA A 245 79.510 79.730 37.200 1.00 0.06 A H
ATOM 2662 HB3 ALA A 245 80.250 79.820 38.760 1.00 0.06 A H
ATOM 2663 C ALA A 245 79.580 82.540 37.980 1.00 0.06 A C
ATOM 2664 O ALA A 245 80.730 82.260 37.580 1.00 0.06 A O
ATOM 2665 N TRP A 246 79.090 83.730 38.060 1.00 0.08 A N
ATOM 2666 H TRP A 246 78.290 83.860 38.660 1.00 0.08 A H
ATOM 2667 CA TRP A 246 79.800 84.950 37.680 1.00 0.08 A C
ATOM 2668 HA TRP A 246 79.930 85.010 36.600 1.00 0.08 A H
ATOM 2669 CB TRP A 246 79.100 86.150 38.300 1.00 0.08 A C
ATOM 2670 HB1 TRP A 246 79.680 87.050 38.080 1.00 0.08 A H
ATOM 2671 HB2 TRP A 246 79.030 86.020 39.380 1.00 0.08 A H
ATOM 2672 CG TRP A 246 77.750 86.500 37.860 1.00 0.08 A C
ATOM 2673 CD1 TRP A 246 76.710 86.490 38.670 1.00 0.08 A C
ATOM 2674 HD1 TRP A 246 76.710 86.190 39.700 1.00 0.08 A H
ATOM 2675 NE1 TRP A 246 75.580 86.900 37.980 1.00 0.08 A N
ATOM 2676 HE1 TRP A 246 74.640 86.880 38.360 1.00 0.08 A H
ATOM 2677 CE2 TRP A 246 75.890 87.200 36.680 1.00 0.08 A C
ATOM 2678 CZ2 TRP A 246 75.170 87.750 35.610 1.00 0.08 A C
ATOM 2679 HZ2 TRP A 246 74.130 88.020 35.760 1.00 0.08 A H
ATOM 2680 CH2 TRP A 246 75.790 87.990 34.360 1.00 0.08 A C
ATOM 2681 HH2 TRP A 246 75.230 88.280 33.480 1.00 0.08 A H
ATOM 2682 CZ3 TRP A 246 77.170 87.730 34.230 1.00 0.08 A C
ATOM 2683 HZ3 TRP A 246 77.710 87.990 33.330 1.00 0.08 A H
ATOM 2684 CE3 TRP A 246 77.890 87.120 35.290 1.00 0.08 A C
ATOM 2685 HE3 TRP A 246 78.960 86.950 35.160 1.00 0.08 A H
ATOM 2686 CD2 TRP A 246 77.290 86.940 36.580 1.00 0.08 A C
ATOM 2687 C TRP A 246 81.260 85.070 38.090 1.00 0.08 A C
ATOM 2688 O TRP A 246 81.990 85.810 37.450 1.00 0.08 A O
ATOM 2689 N GLN A 247 81.730 84.400 39.130 1.00 0.10 A N
ATOM 2690 H GLN A 247 81.070 83.950 39.750 1.00 0.10 A H
ATOM 2691 CA GLN A 247 83.130 84.620 39.600 1.00 0.10 A C
ATOM 2692 HA GLN A 247 83.140 85.710 39.550 1.00 0.10 A H
ATOM 2693 CB GLN A 247 83.340 84.030 41.040 1.00 0.10 A C
ATOM 2694 HB1 GLN A 247 82.680 84.420 41.810 1.00 0.10 A H
ATOM 2695 HB2 GLN A 247 84.370 84.210 41.340 1.00 0.10 A H
ATOM 2696 CG GLN A 247 83.170 82.500 41.090 1.00 0.10 A C
ATOM 2697 HG1 GLN A 247 83.460 82.260 42.110 1.00 0.10 A H
ATOM 2698 HG2 GLN A 247 83.840 81.970 40.420 1.00 0.10 A H
ATOM 2699 CD GLN A 247 81.780 81.980 41.110 1.00 0.10 A C
ATOM 2700 OE1 GLN A 247 80.810 82.710 40.930 1.00 0.10 A O
ATOM 2701 NE2 GLN A 247 81.620 80.680 41.290 1.00 0.10 A N
ATOM 2702 HE21 GLN A 247 82.420 80.130 41.600 1.00 0.10 A H
ATOM 2703 HE22 GLN A 247 80.700 80.310 41.440 1.00 0.10 A H
ATOM 2704 C GLN A 247 84.240 84.160 38.640 1.00 0.10 A C
ATOM 2705 O GLN A 247 85.360 84.630 38.640 1.00 0.10 A O
ATOM 2706 N VAL A 248 83.850 83.250 37.750 1.00 0.08 A N
ATOM 2707 H VAL A 248 82.850 83.050 37.740 1.00 0.08 A H
ATOM 2708 CA VAL A 248 84.740 82.730 36.640 1.00 0.08 A C
ATOM 2709 HA VAL A 248 85.710 83.190 36.810 1.00 0.08 A H
ATOM 2710 CB VAL A 248 84.710 81.240 36.640 1.00 0.08 A C
ATOM 2711 HB VAL A 248 85.180 80.870 35.720 1.00 0.08 A H
ATOM 2712 CG1 VAL A 248 85.640 80.590 37.740 1.00 0.08 A C
ATOM 2713 HG11 VAL A 248 85.700 79.500 37.660 1.00 0.08 A H
ATOM 2714 HG12 VAL A 248 86.620 81.060 37.590 1.00 0.08 A H
ATOM 2715 HG13 VAL A 248 85.200 80.890 38.690 1.00 0.08 A H
ATOM 2716 CG2 VAL A 248 83.400 80.420 36.650 1.00 0.08 A C
ATOM 2717 HG21 VAL A 248 83.580 79.340 36.620 1.00 0.08 A H
ATOM 2718 HG22 VAL A 248 82.880 80.610 37.580 1.00 0.08 A H
ATOM 2719 HG23 VAL A 248 82.740 80.820 35.880 1.00 0.08 A H
ATOM 2720 C VAL A 248 84.220 83.100 35.190 1.00 0.08 A C
ATOM 2721 O VAL A 248 83.000 83.400 35.060 1.00 0.08 A O
ATOM 2722 N PRO A 249 85.130 83.110 34.220 1.00 0.09 A N
ATOM 2723 CD PRO A 249 86.570 82.960 34.420 1.00 0.09 A C
ATOM 2724 HD1 PRO A 249 86.880 82.050 34.930 1.00 0.09 A H
ATOM 2725 HD2 PRO A 249 86.830 83.860 34.960 1.00 0.09 A H
ATOM 2726 CG PRO A 249 87.150 82.920 32.990 1.00 0.09 A C
ATOM 2727 HG1 PRO A 249 87.380 81.890 32.720 1.00 0.09 A H
ATOM 2728 HG2 PRO A 249 88.070 83.480 32.860 1.00 0.09 A H
ATOM 2729 CB PRO A 249 86.070 83.450 32.070 1.00 0.09 A C
ATOM 2730 HB1 PRO A 249 86.010 82.940 31.110 1.00 0.09 A H
ATOM 2731 HB2 PRO A 249 86.260 84.490 31.830 1.00 0.09 A H
ATOM 2732 CA PRO A 249 84.720 83.350 32.840 1.00 0.09 A C
ATOM 2733 HA PRO A 249 84.200 84.300 32.820 1.00 0.09 A H
ATOM 2734 C PRO A 249 83.830 82.300 32.120 1.00 0.09 A C
ATOM 2735 O PRO A 249 83.320 82.610 31.050 1.00 0.09 A O
ATOM 2736 N HIS A 250 83.580 81.130 32.700 1.00 0.10 A N
ATOM 2737 H HIS A 250 84.120 80.870 33.510 1.00 0.10 A H
ATOM 2738 CA HIS A 250 82.910 80.000 32.040 1.00 0.10 A C
ATOM 2739 HA HIS A 250 82.710 80.380 31.030 1.00 0.10 A H
ATOM 2740 CB HIS A 250 83.900 78.820 31.930 1.00 0.10 A C
ATOM 2741 HB1 HIS A 250 83.360 77.980 31.490 1.00 0.10 A H
ATOM 2742 HB2 HIS A 250 84.170 78.420 32.910 1.00 0.10 A H
ATOM 2743 CG HIS A 250 85.180 79.070 31.070 1.00 0.10 A C
ATOM 2744 ND1 HIS A 250 86.260 79.920 31.360 1.00 0.10 A N
ATOM 2745 CE1 HIS A 250 87.140 79.770 30.410 1.00 0.10 A C
ATOM 2746 HE1 HIS A 250 88.060 80.320 30.330 1.00 0.10 A H
ATOM 2747 NE2 HIS A 250 86.650 78.930 29.470 1.00 0.10 A N
ATOM 2748 HE2 HIS A 250 87.090 78.680 28.590 1.00 0.10 A H
ATOM 2749 CD2 HIS A 250 85.480 78.430 29.950 1.00 0.10 A C
ATOM 2750 HD2 HIS A 250 84.840 77.750 29.420 1.00 0.10 A H
ATOM 2751 C HIS A 250 81.540 79.690 32.610 1.00 0.10 A C
ATOM 2752 O HIS A 250 81.150 78.560 32.500 1.00 0.10 A O
ATOM 2753 N ALA A 251 80.880 80.670 33.270 1.00 0.06 A N
ATOM 2754 H ALA A 251 81.380 81.540 33.340 1.00 0.06 A H
ATOM 2755 CA ALA A 251 79.560 80.540 33.870 1.00 0.06 A C
ATOM 2756 HA ALA A 251 79.690 79.940 34.770 1.00 0.06 A H
ATOM 2757 CB ALA A 251 79.020 81.820 34.380 1.00 0.06 A C
ATOM 2758 HB1 ALA A 251 78.200 81.590 35.060 1.00 0.06 A H
ATOM 2759 HB2 ALA A 251 79.840 82.360 34.850 1.00 0.06 A H
ATOM 2760 HB3 ALA A 251 78.580 82.400 33.570 1.00 0.06 A H
ATOM 2761 C ALA A 251 78.490 79.870 33.000 1.00 0.06 A C
ATOM 2762 O ALA A 251 77.690 79.150 33.500 1.00 0.06 A O
ATOM 2763 N MET A 252 78.540 79.990 31.680 1.00 0.08 A N
ATOM 2764 H MET A 252 79.320 80.530 31.310 1.00 0.08 A H
ATOM 2765 CA MET A 252 77.670 79.320 30.700 1.00 0.08 A C
ATOM 2766 HA MET A 252 77.110 78.500 31.140 1.00 0.08 A H
ATOM 2767 CB MET A 252 76.540 80.270 30.380 1.00 0.08 A C
ATOM 2768 HB1 MET A 252 76.070 80.030 29.430 1.00 0.08 A H
ATOM 2769 HB2 MET A 252 76.890 81.310 30.340 1.00 0.08 A H
ATOM 2770 CG MET A 252 75.360 80.140 31.320 1.00 0.08 A C
ATOM 2771 HG1 MET A 252 75.600 80.710 32.210 1.00 0.08 A H
ATOM 2772 HG2 MET A 252 75.130 79.100 31.580 1.00 0.08 A H
ATOM 2773 SD MET A 252 73.800 80.890 30.830 1.00 0.08 A S
ATOM 2774 CE MET A 252 74.120 82.700 30.740 1.00 0.08 A C
ATOM 2775 HE1 MET A 252 73.160 83.200 30.830 1.00 0.08 A H
ATOM 2776 HE2 MET A 252 74.740 83.040 31.570 1.00 0.08 A H
ATOM 2777 HE3 MET A 252 74.580 82.950 29.790 1.00 0.08 A H
ATOM 2778 C MET A 252 78.360 78.800 29.460 1.00 0.08 A C
ATOM 2779 O MET A 252 79.180 79.480 28.860 1.00 0.08 A O
ATOM 2780 N LEU A 253 78.140 77.550 29.220 1.00 0.07 A N
ATOM 2781 H LEU A 253 77.420 77.030 29.690 1.00 0.07 A H
ATOM 2782 CA LEU A 253 78.810 76.760 28.090 1.00 0.07 A C
ATOM 2783 HA LEU A 253 79.470 77.290 27.420 1.00 0.07 A H
ATOM 2784 CB LEU A 253 79.640 75.530 28.660 1.00 0.07 A C
ATOM 2785 HB1 LEU A 253 80.060 74.890 27.880 1.00 0.07 A H
ATOM 2786 HB2 LEU A 253 78.850 74.960 29.130 1.00 0.07 A H
ATOM 2787 CG LEU A 253 80.820 75.860 29.710 1.00 0.07 A C
ATOM 2788 HG LEU A 253 80.410 76.510 30.480 1.00 0.07 A H
ATOM 2789 CD1 LEU A 253 81.440 74.610 30.380 1.00 0.07 A C
ATOM 2790 HD11 LEU A 253 81.920 74.880 31.320 1.00 0.07 A H
ATOM 2791 HD12 LEU A 253 80.620 73.960 30.700 1.00 0.07 A H
ATOM 2792 HD13 LEU A 253 82.030 74.050 29.660 1.00 0.07 A H
ATOM 2793 CD2 LEU A 253 81.970 76.640 29.070 1.00 0.07 A C
ATOM 2794 HD21 LEU A 253 81.540 77.590 28.760 1.00 0.07 A H
ATOM 2795 HD22 LEU A 253 82.670 76.990 29.830 1.00 0.07 A H
ATOM 2796 HD23 LEU A 253 82.330 76.090 28.190 1.00 0.07 A H
ATOM 2797 C LEU A 253 77.730 76.120 27.230 1.00 0.07 A C
ATOM 2798 O LEU A 253 76.570 75.880 27.670 1.00 0.07 A O
ATOM 2799 N TYR A 254 78.090 75.930 25.970 1.00 0.11 A N
ATOM 2800 H TYR A 254 79.030 76.190 25.720 1.00 0.11 A H
ATOM 2801 CA TYR A 254 77.250 75.370 24.910 1.00 0.11 A C
ATOM 2802 HA TYR A 254 76.430 74.860 25.400 1.00 0.11 A H
ATOM 2803 CB TYR A 254 76.620 76.500 24.100 1.00 0.11 A C
ATOM 2804 HB1 TYR A 254 75.970 77.160 24.680 1.00 0.11 A H
ATOM 2805 HB2 TYR A 254 76.080 76.000 23.300 1.00 0.11 A H
ATOM 2806 CG TYR A 254 77.570 77.310 23.210 1.00 0.11 A C
ATOM 2807 CD1 TYR A 254 77.990 76.840 21.930 1.00 0.11 A C
ATOM 2808 HD1 TYR A 254 77.590 75.890 21.620 1.00 0.11 A H
ATOM 2809 CE1 TYR A 254 78.740 77.650 21.100 1.00 0.11 A C
ATOM 2810 HE1 TYR A 254 78.920 77.310 20.090 1.00 0.11 A H
ATOM 2811 CZ TYR A 254 79.110 78.910 21.520 1.00 0.11 A C
ATOM 2812 OH TYR A 254 79.790 79.780 20.690 1.00 0.11 A O
ATOM 2813 HH TYR A 254 79.800 80.650 21.090 1.00 0.11 A H
ATOM 2814 CE2 TYR A 254 78.690 79.390 22.760 1.00 0.11 A C
ATOM 2815 HE2 TYR A 254 79.080 80.330 23.130 1.00 0.11 A H
ATOM 2816 CD2 TYR A 254 77.860 78.600 23.570 1.00 0.11 A C
ATOM 2817 HD2 TYR A 254 77.610 78.940 24.560 1.00 0.11 A H
ATOM 2818 C TYR A 254 78.020 74.390 24.020 1.00 0.11 A C
ATOM 2819 O TYR A 254 79.220 74.570 23.750 1.00 0.11 A O
ATOM 2820 N ARG A 255 77.260 73.440 23.590 1.00 0.19 A N
ATOM 2821 H ARG A 255 76.340 73.350 24.010 1.00 0.19 A H
ATOM 2822 CA ARG A 255 77.500 72.510 22.550 1.00 0.19 A C
ATOM 2823 HA ARG A 255 78.560 72.410 22.330 1.00 0.19 A H
ATOM 2824 CB ARG A 255 76.980 71.110 22.830 1.00 0.19 A C
ATOM 2825 HB1 ARG A 255 75.910 71.290 22.930 1.00 0.19 A H
ATOM 2826 HB2 ARG A 255 77.480 70.770 23.730 1.00 0.19 A H
ATOM 2827 CG ARG A 255 77.270 70.000 21.770 1.00 0.19 A C
ATOM 2828 HG1 ARG A 255 78.140 69.350 21.950 1.00 0.19 A H
ATOM 2829 HG2 ARG A 255 77.400 70.460 20.800 1.00 0.19 A H
ATOM 2830 CD ARG A 255 76.070 69.030 21.700 1.00 0.19 A C
ATOM 2831 HD1 ARG A 255 75.140 69.550 21.930 1.00 0.19 A H
ATOM 2832 HD2 ARG A 255 76.180 68.240 22.430 1.00 0.19 A H
ATOM 2833 NE ARG A 255 75.920 68.360 20.410 1.00 0.19 A N
ATOM 2834 HE ARG A 255 75.300 68.780 19.730 1.00 0.19 A H
ATOM 2835 CZ ARG A 255 76.600 67.270 20.000 1.00 0.19 A C
ATOM 2836 NH1 ARG A 255 77.470 66.680 20.730 1.00 0.19 A N
ATOM 2837 HH11 ARG A 255 77.700 67.030 21.640 1.00 0.19 A H
ATOM 2838 HH12 ARG A 255 77.930 65.830 20.420 1.00 0.19 A H
ATOM 2839 NH2 ARG A 255 76.330 66.720 18.870 1.00 0.19 A N
ATOM 2840 HH21 ARG A 255 75.860 67.300 18.200 1.00 0.19 A H
ATOM 2841 HH22 ARG A 255 76.910 65.920 18.610 1.00 0.19 A H
ATOM 2842 C ARG A 255 77.050 73.080 21.250 1.00 0.19 A C
ATOM 2843 OC1 ARG A 255 77.860 73.280 20.350 1.00 0.19 A O
ATOM 2844 OC2 ARG A 255 75.860 73.410 21.090 1.00 0.19 A O
ATOM 2845 N GLY B 1 60.630 59.430 10.260 1.00 1.30 B N
ATOM 2846 H1 GLY B 1 60.650 58.620 9.650 1.00 1.30 B H
ATOM 2847 H2 GLY B 1 60.340 59.150 11.180 1.00 1.30 B H
ATOM 2848 H3 GLY B 1 59.940 60.070 9.920 1.00 1.30 B H
ATOM 2849 CA GLY B 1 61.980 60.000 10.350 1.00 1.30 B C
ATOM 2850 HA1 GLY B 1 62.400 60.220 9.370 1.00 1.30 B H
ATOM 2851 HA2 GLY B 1 62.640 59.280 10.840 1.00 1.30 B H
ATOM 2852 C GLY B 1 61.990 61.230 11.250 1.00 1.30 B C
ATOM 2853 O GLY B 1 60.980 61.930 11.210 1.00 1.30 B O
ATOM 2854 N GLY B 2 63.060 61.590 12.000 1.00 1.14 B N
ATOM 2855 H GLY B 2 63.870 60.980 12.100 1.00 1.14 B H
ATOM 2856 CA GLY B 2 63.170 62.700 12.880 1.00 1.14 B C
ATOM 2857 HA1 GLY B 2 62.780 62.400 13.860 1.00 1.14 B H
ATOM 2858 HA2 GLY B 2 62.490 63.510 12.610 1.00 1.14 B H
ATOM 2859 C GLY B 2 64.670 63.130 13.020 1.00 1.14 B C
ATOM 2860 O GLY B 2 65.570 62.830 12.160 1.00 1.14 B O
ATOM 2861 N GLY B 3 64.940 63.900 14.040 1.00 0.99 B N
ATOM 2862 H GLY B 3 64.340 64.050 14.830 1.00 0.99 B H
ATOM 2863 CA GLY B 3 66.330 64.350 14.310 1.00 0.99 B C
ATOM 2864 HA1 GLY B 3 66.280 65.150 15.050 1.00 0.99 B H
ATOM 2865 HA2 GLY B 3 66.800 64.750 13.420 1.00 0.99 B H
ATOM 2866 C GLY B 3 67.140 63.130 14.890 1.00 0.99 B C
ATOM 2867 O GLY B 3 66.660 62.060 15.290 1.00 0.99 B O
ATOM 2868 N SER B 4 68.430 63.410 14.970 1.00 0.93 B N
ATOM 2869 H SER B 4 68.700 64.370 14.810 1.00 0.93 B H
ATOM 2870 CA SER B 4 69.360 62.470 15.510 1.00 0.93 B C
ATOM 2871 HA SER B 4 69.090 61.480 15.140 1.00 0.93 B H
ATOM 2872 CB SER B 4 70.780 62.630 15.030 1.00 0.93 B C
ATOM 2873 HB1 SER B 4 71.500 62.190 15.710 1.00 0.93 B H
ATOM 2874 HB2 SER B 4 71.040 63.690 15.000 1.00 0.93 B H
ATOM 2875 OG SER B 4 70.720 62.270 13.640 1.00 0.93 B O
ATOM 2876 HG SER B 4 69.840 62.420 13.280 1.00 0.93 B H
ATOM 2877 C SER B 4 69.410 62.380 17.150 1.00 0.93 B C
ATOM 2878 O SER B 4 70.280 61.610 17.590 1.00 0.93 B O
ATOM 2879 N GLY B 5 68.520 63.020 17.940 1.00 0.87 B N
ATOM 2880 H GLY B 5 67.830 63.550 17.430 1.00 0.87 B H
ATOM 2881 CA GLY B 5 68.470 63.040 19.400 1.00 0.87 B C
ATOM 2882 HA1 GLY B 5 68.020 63.960 19.750 1.00 0.87 B H
ATOM 2883 HA2 GLY B 5 69.460 62.870 19.810 1.00 0.87 B H
ATOM 2884 C GLY B 5 67.630 61.930 20.110 1.00 0.87 B C
ATOM 2885 O GLY B 5 67.110 61.090 19.440 1.00 0.87 B O
ATOM 2886 N GLY B 6 67.540 62.000 21.450 1.00 0.88 B N
ATOM 2887 H GLY B 6 67.960 62.820 21.850 1.00 0.88 B H
ATOM 2888 CA GLY B 6 66.970 60.970 22.420 1.00 0.88 B C
ATOM 2889 HA1 GLY B 6 67.540 61.070 23.350 1.00 0.88 B H
ATOM 2890 HA2 GLY B 6 67.090 59.950 22.060 1.00 0.88 B H
ATOM 2891 C GLY B 6 65.560 61.150 22.870 1.00 0.88 B C
ATOM 2892 O GLY B 6 65.320 60.880 24.100 1.00 0.88 B O
ATOM 2893 N GLY B 7 64.620 61.560 22.040 1.00 0.88 B N
ATOM 2894 H GLY B 7 64.890 61.810 21.110 1.00 0.88 B H
ATOM 2895 CA GLY B 7 63.210 61.590 22.380 1.00 0.88 B C
ATOM 2896 HA1 GLY B 7 63.020 60.660 22.910 1.00 0.88 B H
ATOM 2897 HA2 GLY B 7 62.530 61.530 21.540 1.00 0.88 B H
ATOM 2898 C GLY B 7 62.810 62.760 23.270 1.00 0.88 B C
ATOM 2899 O GLY B 7 61.610 63.040 23.530 1.00 0.88 B O
ATOM 2900 N GLY B 8 63.780 63.540 23.800 1.00 0.86 B N
ATOM 2901 H GLY B 8 64.750 63.380 23.580 1.00 0.86 B H
ATOM 2902 CA GLY B 8 63.530 64.750 24.670 1.00 0.86 B C
ATOM 2903 HA1 GLY B 8 62.980 65.510 24.120 1.00 0.86 B H
ATOM 2904 HA2 GLY B 8 64.520 65.110 24.980 1.00 0.86 B H
ATOM 2905 C GLY B 8 62.880 64.500 26.030 1.00 0.86 B C
ATOM 2906 O GLY B 8 62.420 65.470 26.640 1.00 0.86 B O
ATOM 2907 N SER B 9 62.700 63.220 26.360 1.00 0.83 B N
ATOM 2908 H SER B 9 63.090 62.490 25.780 1.00 0.83 B H
ATOM 2909 CA SER B 9 61.860 62.870 27.470 1.00 0.83 B C
ATOM 2910 HA SER B 9 61.000 63.500 27.190 1.00 0.83 B H
ATOM 2911 CB SER B 9 61.330 61.440 27.290 1.00 0.83 B C
ATOM 2912 HB1 SER B 9 60.860 61.200 26.340 1.00 0.83 B H
ATOM 2913 HB2 SER B 9 60.520 61.200 27.960 1.00 0.83 B H
ATOM 2914 OG SER B 9 62.310 60.520 27.610 1.00 0.83 B O
ATOM 2915 HG SER B 9 63.160 60.660 27.170 1.00 0.83 B H
ATOM 2916 C SER B 9 62.290 63.170 28.970 1.00 0.83 B C
ATOM 2917 O SER B 9 63.470 62.960 29.310 1.00 0.83 B O
ATOM 2918 N SER B 10 61.350 63.730 29.800 1.00 0.70 B N
ATOM 2919 H SER B 10 60.400 63.830 29.480 1.00 0.70 B H
ATOM 2920 CA SER B 10 61.580 64.150 31.210 1.00 0.70 B C
ATOM 2921 HA SER B 10 62.620 64.440 31.230 1.00 0.70 B H
ATOM 2922 CB SER B 10 60.640 65.350 31.560 1.00 0.70 B C
ATOM 2923 HB1 SER B 10 61.010 65.710 32.520 1.00 0.70 B H
ATOM 2924 HB2 SER B 10 59.600 65.040 31.670 1.00 0.70 B H
ATOM 2925 OG SER B 10 60.630 66.400 30.590 1.00 0.70 B O
ATOM 2926 HG SER B 10 60.280 67.170 31.030 1.00 0.70 B H
ATOM 2927 C SER B 10 61.350 63.010 32.170 1.00 0.70 B C
ATOM 2928 O SER B 10 60.730 63.150 33.230 1.00 0.70 B O
ATOM 2929 N GLY B 11 61.900 61.790 31.840 1.00 0.60 B N
ATOM 2930 H GLY B 11 62.370 61.800 30.950 1.00 0.60 B H
ATOM 2931 CA GLY B 11 61.740 60.620 32.660 1.00 0.60 B C
ATOM 2932 HA1 GLY B 11 62.240 60.590 33.620 1.00 0.60 B H
ATOM 2933 HA2 GLY B 11 62.210 59.780 32.120 1.00 0.60 B H
ATOM 2934 C GLY B 11 60.300 60.300 32.890 1.00 0.60 B C
ATOM 2935 O GLY B 11 59.420 60.420 32.060 1.00 0.60 B O
ATOM 2936 N SER B 12 59.930 59.880 34.110 1.00 0.51 B N
ATOM 2937 H SER B 12 60.580 59.890 34.880 1.00 0.51 B H
ATOM 2938 CA SER B 12 58.600 59.530 34.500 1.00 0.51 B C
ATOM 2939 HA SER B 12 58.100 58.930 33.750 1.00 0.51 B H
ATOM 2940 CB SER B 12 58.580 58.690 35.780 1.00 0.51 B C
ATOM 2941 HB1 SER B 12 57.530 58.440 36.000 1.00 0.51 B H
ATOM 2942 HB2 SER B 12 58.980 59.130 36.690 1.00 0.51 B H
ATOM 2943 OG SER B 12 59.250 57.540 35.460 1.00 0.51 B O
ATOM 2944 HG SER B 12 58.770 57.080 34.770 1.00 0.51 B H
ATOM 2945 C SER B 12 57.680 60.740 34.730 1.00 0.51 B C
ATOM 2946 O SER B 12 56.650 60.560 35.320 1.00 0.51 B O
ATOM 2947 N GLY B 13 58.030 61.870 34.160 1.00 0.44 B N
ATOM 2948 H GLY B 13 58.860 61.910 33.590 1.00 0.44 B H
ATOM 2949 CA GLY B 13 57.320 63.170 34.300 1.00 0.44 B C
ATOM 2950 HA1 GLY B 13 56.310 62.920 33.970 1.00 0.44 B H
ATOM 2951 HA2 GLY B 13 57.880 63.870 33.690 1.00 0.44 B H
ATOM 2952 C GLY B 13 57.250 63.740 35.740 1.00 0.44 B C
ATOM 2953 O GLY B 13 56.110 63.870 36.180 1.00 0.44 B O
ATOM 2954 N SER B 14 58.390 64.090 36.380 1.00 0.45 B N
ATOM 2955 H SER B 14 59.270 63.870 35.920 1.00 0.45 B H
ATOM 2956 CA SER B 14 58.450 65.010 37.540 1.00 0.45 B C
ATOM 2957 HA SER B 14 57.540 65.610 37.440 1.00 0.45 B H
ATOM 2958 CB SER B 14 59.620 65.970 37.430 1.00 0.45 B C
ATOM 2959 HB1 SER B 14 60.510 65.360 37.270 1.00 0.45 B H
ATOM 2960 HB2 SER B 14 59.720 66.550 38.350 1.00 0.45 B H
ATOM 2961 OG SER B 14 59.370 66.820 36.370 1.00 0.45 B O
ATOM 2962 HG SER B 14 60.160 67.370 36.250 1.00 0.45 B H
ATOM 2963 C SER B 14 58.430 64.250 38.900 1.00 0.45 B C
ATOM 2964 O SER B 14 57.850 64.740 39.940 1.00 0.45 B O
ATOM 2965 N VAL B 15 59.010 63.050 38.970 1.00 0.33 B N
ATOM 2966 H VAL B 15 59.490 62.790 38.120 1.00 0.33 B H
ATOM 2967 CA VAL B 15 59.090 62.210 40.130 1.00 0.33 B C
ATOM 2968 HA VAL B 15 58.140 62.320 40.650 1.00 0.33 B H
ATOM 2969 CB VAL B 15 59.360 60.780 39.760 1.00 0.33 B C
ATOM 2970 HB VAL B 15 59.480 60.160 40.650 1.00 0.33 B H
ATOM 2971 CG1 VAL B 15 58.200 60.130 39.020 1.00 0.33 B C
ATOM 2972 HG11 VAL B 15 57.820 60.780 38.240 1.00 0.33 B H
ATOM 2973 HG12 VAL B 15 58.400 59.130 38.620 1.00 0.33 B H
ATOM 2974 HG13 VAL B 15 57.330 59.990 39.670 1.00 0.33 B H
ATOM 2975 CG2 VAL B 15 60.730 60.530 39.030 1.00 0.33 B C
ATOM 2976 HG21 VAL B 15 61.530 60.820 39.710 1.00 0.33 B H
ATOM 2977 HG22 VAL B 15 60.840 59.500 38.710 1.00 0.33 B H
ATOM 2978 HG23 VAL B 15 60.670 61.260 38.230 1.00 0.33 B H
ATOM 2979 C VAL B 15 60.090 62.790 41.200 1.00 0.33 B C
ATOM 2980 O VAL B 15 61.030 63.450 40.830 1.00 0.33 B O
ATOM 2981 N PRO B 16 59.890 62.560 42.510 1.00 0.36 B N
ATOM 2982 CD PRO B 16 58.800 61.770 43.060 1.00 0.36 B C
ATOM 2983 HD1 PRO B 16 58.720 60.790 42.600 1.00 0.36 B H
ATOM 2984 HD2 PRO B 16 57.860 62.310 42.980 1.00 0.36 B H
ATOM 2985 CG PRO B 16 59.030 61.520 44.500 1.00 0.36 B C
ATOM 2986 HG1 PRO B 16 59.630 60.610 44.560 1.00 0.36 B H
ATOM 2987 HG2 PRO B 16 58.140 61.500 45.120 1.00 0.36 B H
ATOM 2988 CB PRO B 16 60.060 62.560 44.810 1.00 0.36 B C
ATOM 2989 HB1 PRO B 16 60.750 62.270 45.600 1.00 0.36 B H
ATOM 2990 HB2 PRO B 16 59.420 63.360 45.180 1.00 0.36 B H
ATOM 2991 CA PRO B 16 60.770 63.000 43.560 1.00 0.36 B C
ATOM 2992 HA PRO B 16 60.850 64.080 43.500 1.00 0.36 B H
ATOM 2993 C PRO B 16 62.210 62.460 43.380 1.00 0.36 B C
ATOM 2994 O PRO B 16 62.440 61.370 42.850 1.00 0.36 B O
ATOM 2995 N LYS B 17 63.180 63.260 43.820 1.00 0.33 B N
ATOM 2996 H LYS B 17 62.860 64.080 44.320 1.00 0.33 B H
ATOM 2997 CA LYS B 17 64.580 62.800 43.870 1.00 0.33 B C
ATOM 2998 HA LYS B 17 64.600 61.720 43.800 1.00 0.33 B H
ATOM 2999 CB LYS B 17 65.300 63.400 42.680 1.00 0.33 B C
ATOM 3000 HB1 LYS B 17 66.340 63.180 42.870 1.00 0.33 B H
ATOM 3001 HB2 LYS B 17 65.130 64.470 42.610 1.00 0.33 B H
ATOM 3002 CG LYS B 17 64.860 62.820 41.340 1.00 0.33 B C
ATOM 3003 HG1 LYS B 17 63.810 63.060 41.170 1.00 0.33 B H
ATOM 3004 HG2 LYS B 17 65.030 61.750 41.420 1.00 0.33 B H
ATOM 3005 CD LYS B 17 65.660 63.420 40.160 1.00 0.33 B C
ATOM 3006 HD1 LYS B 17 65.500 64.500 40.210 1.00 0.33 B H
ATOM 3007 HD2 LYS B 17 65.310 63.070 39.190 1.00 0.33 B H
ATOM 3008 CE LYS B 17 67.210 63.240 40.290 1.00 0.33 B C
ATOM 3009 HE1 LYS B 17 67.510 63.720 41.220 1.00 0.33 B H
ATOM 3010 HE2 LYS B 17 67.710 63.820 39.510 1.00 0.33 B H
ATOM 3011 NZ LYS B 17 67.490 61.790 40.210 1.00 0.33 B N
ATOM 3012 HZ1 LYS B 17 68.420 61.640 40.570 1.00 0.33 B H
ATOM 3013 HZ2 LYS B 17 66.920 61.170 40.760 1.00 0.33 B H
ATOM 3014 HZ3 LYS B 17 67.440 61.430 39.270 1.00 0.33 B H
ATOM 3015 C LYS B 17 65.310 63.080 45.180 1.00 0.33 B C
ATOM 3016 O LYS B 17 65.020 64.020 45.960 1.00 0.33 B O
ATOM 3017 N PHE B 18 66.340 62.260 45.410 1.00 0.26 B N
ATOM 3018 H PHE B 18 66.570 61.650 44.640 1.00 0.26 B H
ATOM 3019 CA PHE B 18 67.020 61.930 46.700 1.00 0.26 B C
ATOM 3020 HA PHE B 18 66.690 62.660 47.430 1.00 0.26 B H
ATOM 3021 CB PHE B 18 66.460 60.630 47.250 1.00 0.26 B C
ATOM 3022 HB1 PHE B 18 66.860 60.520 48.260 1.00 0.26 B H
ATOM 3023 HB2 PHE B 18 66.770 59.800 46.630 1.00 0.26 B H
ATOM 3024 CG PHE B 18 64.920 60.480 47.230 1.00 0.26 B C
ATOM 3025 CD1 PHE B 18 64.370 59.630 46.290 1.00 0.26 B C
ATOM 3026 HD1 PHE B 18 65.030 59.010 45.720 1.00 0.26 B H
ATOM 3027 CE1 PHE B 18 62.920 59.540 46.240 1.00 0.26 B C
ATOM 3028 HE1 PHE B 18 62.400 58.850 45.590 1.00 0.26 B H
ATOM 3029 CZ PHE B 18 62.120 60.240 47.130 1.00 0.26 B C
ATOM 3030 HZ PHE B 18 61.040 60.180 47.120 1.00 0.26 B H
ATOM 3031 CE2 PHE B 18 62.730 61.230 48.000 1.00 0.26 B C
ATOM 3032 HE2 PHE B 18 62.170 61.830 48.710 1.00 0.26 B H
ATOM 3033 CD2 PHE B 18 64.120 61.360 48.020 1.00 0.26 B C
ATOM 3034 HD2 PHE B 18 64.650 62.080 48.630 1.00 0.26 B H
ATOM 3035 C PHE B 18 68.560 61.960 46.700 1.00 0.26 B C
ATOM 3036 O PHE B 18 69.110 62.440 47.700 1.00 0.26 B O
ATOM 3037 N GLY B 19 69.230 61.540 45.660 1.00 0.13 B N
ATOM 3038 H GLY B 19 68.670 61.180 44.890 1.00 0.13 B H
ATOM 3039 CA GLY B 19 70.580 61.220 45.650 1.00 0.13 B C
ATOM 3040 HA1 GLY B 19 70.780 60.600 44.780 1.00 0.13 B H
ATOM 3041 HA2 GLY B 19 70.870 60.670 46.540 1.00 0.13 B H
ATOM 3042 C GLY B 19 71.460 62.500 45.530 1.00 0.13 B C
ATOM 3043 O GLY B 19 70.900 63.610 45.300 1.00 0.13 B O
ATOM 3044 N ASN B 20 72.790 62.430 45.650 1.00 0.13 B N
ATOM 3045 H ASN B 20 73.140 61.610 46.140 1.00 0.13 B H
ATOM 3046 CA ASN B 20 73.850 63.380 45.270 1.00 0.13 B C
ATOM 3047 HA ASN B 20 73.560 63.980 44.400 1.00 0.13 B H
ATOM 3048 CB ASN B 20 74.160 64.220 46.470 1.00 0.13 B C
ATOM 3049 HB1 ASN B 20 74.540 63.580 47.260 1.00 0.13 B H
ATOM 3050 HB2 ASN B 20 73.330 64.770 46.920 1.00 0.13 B H
ATOM 3051 CG ASN B 20 75.210 65.330 46.050 1.00 0.13 B C
ATOM 3052 OD1 ASN B 20 74.980 66.240 45.310 1.00 0.13 B O
ATOM 3053 ND2 ASN B 20 76.410 65.190 46.660 1.00 0.13 B N
ATOM 3054 HD21 ASN B 20 76.600 64.540 47.400 1.00 0.13 B H
ATOM 3055 HD22 ASN B 20 77.100 65.900 46.450 1.00 0.13 B H
ATOM 3056 C ASN B 20 75.080 62.610 44.730 1.00 0.13 B C
ATOM 3057 O ASN B 20 75.430 61.520 45.190 1.00 0.13 B O
ATOM 3058 N TRP B 21 75.810 63.210 43.830 1.00 0.10 B N
ATOM 3059 H TRP B 21 75.370 64.050 43.480 1.00 0.10 B H
ATOM 3060 CA TRP B 21 76.990 62.590 43.160 1.00 0.10 B C
ATOM 3061 HA TRP B 21 76.710 61.580 42.850 1.00 0.10 B H
ATOM 3062 CB TRP B 21 77.400 63.380 41.920 1.00 0.10 B C
ATOM 3063 HB1 TRP B 21 76.540 63.700 41.340 1.00 0.10 B H
ATOM 3064 HB2 TRP B 21 77.940 62.740 41.240 1.00 0.10 B H
ATOM 3065 CG TRP B 21 78.280 64.580 42.190 1.00 0.10 B C
ATOM 3066 CD1 TRP B 21 79.630 64.570 42.340 1.00 0.10 B C
ATOM 3067 HD1 TRP B 21 80.240 63.680 42.330 1.00 0.10 B H
ATOM 3068 NE1 TRP B 21 80.080 65.900 42.540 1.00 0.10 B N
ATOM 3069 HE1 TRP B 21 81.020 66.180 42.730 1.00 0.10 B H
ATOM 3070 CE2 TRP B 21 79.050 66.810 42.340 1.00 0.10 B C
ATOM 3071 CZ2 TRP B 21 78.910 68.190 42.500 1.00 0.10 B C
ATOM 3072 HZ2 TRP B 21 79.760 68.840 42.550 1.00 0.10 B H
ATOM 3073 CH2 TRP B 21 77.620 68.780 42.400 1.00 0.10 B C
ATOM 3074 HH2 TRP B 21 77.460 69.850 42.440 1.00 0.10 B H
ATOM 3075 CZ3 TRP B 21 76.420 67.990 42.390 1.00 0.10 B C
ATOM 3076 HZ3 TRP B 21 75.460 68.480 42.340 1.00 0.10 B H
ATOM 3077 CE3 TRP B 21 76.610 66.620 42.210 1.00 0.10 B C
ATOM 3078 HE3 TRP B 21 75.710 66.000 42.160 1.00 0.10 B H
ATOM 3079 CD2 TRP B 21 77.890 66.000 42.230 1.00 0.10 B C
ATOM 3080 C TRP B 21 78.120 62.240 44.080 1.00 0.10 B C
ATOM 3081 O TRP B 21 78.930 61.350 43.880 1.00 0.10 B O
ATOM 3082 N GLY B 22 78.300 63.010 45.130 1.00 0.21 B N
ATOM 3083 H GLY B 22 77.680 63.800 45.280 1.00 0.21 B H
ATOM 3084 CA GLY B 22 79.420 63.100 46.090 1.00 0.21 B C
ATOM 3085 HA1 GLY B 22 79.360 63.950 46.780 1.00 0.21 B H
ATOM 3086 HA2 GLY B 22 80.370 63.090 45.550 1.00 0.21 B H
ATOM 3087 C GLY B 22 79.480 61.940 47.110 1.00 0.21 B C
ATOM 3088 O GLY B 22 79.620 62.310 48.290 1.00 0.21 B O
ATOM 3089 N GLY B 23 79.380 60.670 46.670 1.00 0.23 B N
ATOM 3090 H GLY B 23 79.310 60.390 45.700 1.00 0.23 B H
ATOM 3091 CA GLY B 23 79.440 59.550 47.540 1.00 0.23 B C
ATOM 3092 HA1 GLY B 23 80.230 59.790 48.250 1.00 0.23 B H
ATOM 3093 HA2 GLY B 23 79.530 58.660 46.930 1.00 0.23 B H
ATOM 3094 C GLY B 23 78.150 59.320 48.360 1.00 0.23 B C
ATOM 3095 O GLY B 23 78.220 58.590 49.270 1.00 0.23 B O
ATOM 3096 N SER B 24 77.020 59.820 47.890 1.00 0.32 B N
ATOM 3097 H SER B 24 77.060 60.430 47.090 1.00 0.32 B H
ATOM 3098 CA SER B 24 75.700 59.780 48.540 1.00 0.32 B C
ATOM 3099 HA SER B 24 75.640 58.980 49.280 1.00 0.32 B H
ATOM 3100 CB SER B 24 75.430 60.920 49.560 1.00 0.32 B C
ATOM 3101 HB1 SER B 24 74.610 60.570 50.160 1.00 0.32 B H
ATOM 3102 HB2 SER B 24 75.050 61.760 48.980 1.00 0.32 B H
ATOM 3103 OG SER B 24 76.430 61.190 50.450 1.00 0.32 B O
ATOM 3104 HG SER B 24 76.050 61.370 51.320 1.00 0.32 B H
ATOM 3105 C SER B 24 74.630 59.610 47.450 1.00 0.32 B C
ATOM 3106 O SER B 24 73.770 60.480 47.330 1.00 0.32 B O
ATOM 3107 N GLY B 25 74.790 58.620 46.550 1.00 0.30 B N
ATOM 3108 H GLY B 25 75.600 58.030 46.650 1.00 0.30 B H
ATOM 3109 CA GLY B 25 73.930 58.370 45.430 1.00 0.30 B C
ATOM 3110 HA1 GLY B 25 74.480 57.680 44.790 1.00 0.30 B H
ATOM 3111 HA2 GLY B 25 73.820 59.300 44.890 1.00 0.30 B H
ATOM 3112 C GLY B 25 72.570 57.780 45.810 1.00 0.30 B C
ATOM 3113 O GLY B 25 72.370 57.230 46.880 1.00 0.30 B O
ATOM 3114 N GLY B 26 71.610 57.760 44.870 1.00 0.34 B N
ATOM 3115 H GLY B 26 71.780 58.100 43.930 1.00 0.34 B H
ATOM 3116 CA GLY B 26 70.240 57.290 45.080 1.00 0.34 B C
ATOM 3117 HA1 GLY B 26 69.880 57.820 45.970 1.00 0.34 B H
ATOM 3118 HA2 GLY B 26 70.250 56.220 45.230 1.00 0.34 B H
ATOM 3119 C GLY B 26 69.310 57.610 43.850 1.00 0.34 B C
ATOM 3120 O GLY B 26 69.750 58.060 42.750 1.00 0.34 B O
ATOM 3121 N GLY B 27 68.030 57.720 44.180 1.00 0.50 B N
ATOM 3122 H GLY B 27 67.810 57.430 45.110 1.00 0.50 B H
ATOM 3123 CA GLY B 27 66.860 58.240 43.400 1.00 0.50 B C
ATOM 3124 HA1 GLY B 27 65.890 58.110 43.890 1.00 0.50 B H
ATOM 3125 HA2 GLY B 27 66.780 57.640 42.490 1.00 0.50 B H
ATOM 3126 C GLY B 27 66.960 59.700 42.910 1.00 0.50 B C
ATOM 3127 OC1 GLY B 27 66.510 59.860 41.780 1.00 0.50 B O
ATOM 3128 OC2 GLY B 27 67.590 60.530 43.600 1.00 0.50 B O
END
CRYST1 147.037 147.037 147.037 109.47 109.47 109.47 0
ATOM 1 N MET A 1 120.792 92.319 38.316 1.00 0.00 N
ATOM 2 CA MET A 1 119.606 91.438 38.584 1.00 0.00 C
ATOM 3 C MET A 1 120.079 90.397 39.573 1.00 0.00 C
ATOM 4 O MET A 1 120.859 89.520 39.218 1.00 0.00 O
ATOM 5 CB MET A 1 118.907 90.936 37.247 1.00 0.00 C
ATOM 6 CG MET A 1 117.907 89.852 37.574 1.00 0.00 C
ATOM 7 SD MET A 1 116.714 89.585 36.266 1.00 0.00 S
ATOM 8 CE MET A 1 115.830 88.152 36.813 1.00 0.00 C
ATOM 9 HA MET A 1 118.866 92.091 39.046 1.00 0.00 H
ATOM 10 HB2 MET A 1 118.427 91.816 36.819 1.00 0.00 H
ATOM 11 HB3 MET A 1 119.664 90.473 36.614 1.00 0.00 H
ATOM 12 HG2 MET A 1 118.530 88.961 37.650 1.00 0.00 H
ATOM 13 HG3 MET A 1 117.412 90.127 38.505 1.00 0.00 H
ATOM 14 HE1 MET A 1 115.255 88.404 37.703 1.00 0.00 H
ATOM 15 HE2 MET A 1 115.215 87.813 35.979 1.00 0.00 H
ATOM 16 HE3 MET A 1 116.488 87.320 37.064 1.00 0.00 H
ATOM 17 H1 MET A 1 121.554 91.792 37.913 1.00 0.00 H
ATOM 18 H2 MET A 1 121.125 92.698 39.191 1.00 0.00 H
ATOM 19 H3 MET A 1 120.444 93.077 37.746 1.00 0.00 H
ATOM 20 N GLU A 2 119.661 90.476 40.823 1.00 0.00 N
ATOM 21 CA GLU A 2 120.151 89.615 41.845 1.00 0.00 C
ATOM 22 C GLU A 2 119.346 88.323 42.095 1.00 0.00 C
ATOM 23 O GLU A 2 119.814 87.493 42.852 1.00 0.00 O
ATOM 24 CB GLU A 2 120.435 90.427 43.084 1.00 0.00 C
ATOM 25 CG GLU A 2 121.176 89.766 44.303 1.00 0.00 C
ATOM 26 CD GLU A 2 122.073 90.730 45.115 1.00 0.00 C
ATOM 27 OE1 GLU A 2 121.750 91.909 45.317 1.00 0.00 O
ATOM 28 OE2 GLU A 2 123.168 90.251 45.539 1.00 0.00 O1-
ATOM 29 H GLU A 2 119.009 91.216 41.043 1.00 0.00 H
ATOM 30 HA GLU A 2 121.077 89.217 41.429 1.00 0.00 H
ATOM 31 HB2 GLU A 2 121.077 91.237 42.737 1.00 0.00 H
ATOM 32 HB3 GLU A 2 119.608 91.024 43.470 1.00 0.00 H
ATOM 33 HG2 GLU A 2 120.356 89.564 44.992 1.00 0.00 H
ATOM 34 HG3 GLU A 2 121.622 88.793 44.100 1.00 0.00 H
ATOM 35 N ASP A 3 118.197 88.110 41.421 1.00 0.00 N
ATOM 36 CA ASP A 3 117.649 86.732 41.238 1.00 0.00 C
ATOM 37 C ASP A 3 118.532 85.762 40.393 1.00 0.00 C
ATOM 38 O ASP A 3 119.269 86.254 39.506 1.00 0.00 O
ATOM 39 CB ASP A 3 116.243 86.776 40.539 1.00 0.00 C
ATOM 40 CG ASP A 3 115.115 87.188 41.403 1.00 0.00 C
ATOM 41 OD1 ASP A 3 114.886 86.377 42.340 1.00 0.00 O
ATOM 42 OD2 ASP A 3 114.383 88.203 41.127 1.00 0.00 O1-
ATOM 43 H ASP A 3 117.909 88.796 40.739 1.00 0.00 H
ATOM 44 HA ASP A 3 117.517 86.300 42.230 1.00 0.00 H
ATOM 45 HB2 ASP A 3 116.207 87.354 39.616 1.00 0.00 H
ATOM 46 HB3 ASP A 3 115.950 85.811 40.125 1.00 0.00 H
ATOM 47 N PRO A 4 118.383 84.433 40.497 1.00 0.00 N
ATOM 48 CA PRO A 4 118.977 83.318 39.703 1.00 0.00 C
ATOM 49 C PRO A 4 118.067 83.110 38.424 1.00 0.00 C
ATOM 50 O PRO A 4 118.368 82.201 37.696 1.00 0.00 O
ATOM 51 CB PRO A 4 118.986 82.112 40.577 1.00 0.00 C
ATOM 52 CG PRO A 4 117.658 82.304 41.386 1.00 0.00 C
ATOM 53 CD PRO A 4 117.493 83.826 41.489 1.00 0.00 C
ATOM 54 HA PRO A 4 119.947 83.704 39.388 1.00 0.00 H
ATOM 55 HB2 PRO A 4 118.905 81.213 39.966 1.00 0.00 H
ATOM 56 HB3 PRO A 4 119.877 82.194 41.200 1.00 0.00 H
ATOM 57 HG2 PRO A 4 116.841 81.865 40.813 1.00 0.00 H
ATOM 58 HG3 PRO A 4 117.688 81.855 42.379 1.00 0.00 H
ATOM 59 HD2 PRO A 4 116.443 84.051 41.301 1.00 0.00 H
ATOM 60 HD3 PRO A 4 117.686 84.189 42.498 1.00 0.00 H
ATOM 61 N ASP A 5 117.005 83.852 38.120 1.00 0.00 N
ATOM 62 CA ASP A 5 115.973 83.641 37.074 1.00 0.00 C
ATOM 63 C ASP A 5 116.505 84.402 35.864 1.00 0.00 C
ATOM 64 O ASP A 5 117.458 85.232 35.945 1.00 0.00 O
ATOM 65 CB ASP A 5 114.550 84.006 37.635 1.00 0.00 C
ATOM 66 CG ASP A 5 113.355 83.426 36.891 1.00 0.00 C
ATOM 67 OD1 ASP A 5 112.242 84.003 37.117 1.00 0.00 O
ATOM 68 OD2 ASP A 5 113.509 82.737 35.867 1.00 0.00 O1-
ATOM 69 H ASP A 5 116.790 84.548 38.820 1.00 0.00 H
ATOM 70 HA ASP A 5 116.036 82.594 36.777 1.00 0.00 H
ATOM 71 HB2 ASP A 5 114.519 83.851 38.713 1.00 0.00 H
ATOM 72 HB3 ASP A 5 114.513 85.094 37.702 1.00 0.00 H
ATOM 73 N ILE A 6 115.938 84.209 34.731 1.00 0.00 N
ATOM 74 CA ILE A 6 116.440 84.864 33.498 1.00 0.00 C
ATOM 75 C ILE A 6 115.849 86.269 33.316 1.00 0.00 C
ATOM 76 O ILE A 6 114.618 86.483 33.387 1.00 0.00 O
ATOM 77 CB ILE A 6 116.177 83.935 32.278 1.00 0.00 C
ATOM 78 CG1 ILE A 6 116.639 82.515 32.323 1.00 0.00 C
ATOM 79 CG2 ILE A 6 116.710 84.664 31.054 1.00 0.00 C
ATOM 80 CD1 ILE A 6 118.083 82.301 32.712 1.00 0.00 C
ATOM 81 H ILE A 6 115.175 83.559 34.615 1.00 0.00 H
ATOM 82 HA ILE A 6 117.522 84.992 33.525 1.00 0.00 H
ATOM 83 HB ILE A 6 115.097 83.930 32.138 1.00 0.00 H
ATOM 84 HG12 ILE A 6 116.072 82.036 33.121 1.00 0.00 H
ATOM 85 HG13 ILE A 6 116.375 82.081 31.359 1.00 0.00 H
ATOM 86 HG21 ILE A 6 117.690 85.085 31.279 1.00 0.00 H
ATOM 87 HG22 ILE A 6 116.750 83.913 30.265 1.00 0.00 H
ATOM 88 HG23 ILE A 6 116.170 85.548 30.716 1.00 0.00 H
ATOM 89 HD11 ILE A 6 118.645 82.958 32.048 1.00 0.00 H
ATOM 90 HD12 ILE A 6 118.251 82.593 33.749 1.00 0.00 H
ATOM 91 HD13 ILE A 6 118.366 81.275 32.476 1.00 0.00 H
ATOM 92 N LYS A 7 116.741 87.104 32.975 1.00 0.00 N
ATOM 93 CA LYS A 7 116.377 88.516 32.528 1.00 0.00 C
ATOM 94 C LYS A 7 115.161 88.663 31.596 1.00 0.00 C
ATOM 95 O LYS A 7 115.040 87.799 30.670 1.00 0.00 O
ATOM 96 CB LYS A 7 117.603 89.320 31.855 1.00 0.00 C
ATOM 97 CG LYS A 7 118.189 88.689 30.617 1.00 0.00 C
ATOM 98 CD LYS A 7 119.352 89.563 30.172 1.00 0.00 C
ATOM 99 CE LYS A 7 120.058 89.097 28.902 1.00 0.00 C
ATOM 100 NZ LYS A 7 119.189 89.061 27.660 1.00 0.00 N1+
ATOM 101 H LYS A 7 117.707 86.833 32.856 1.00 0.00 H
ATOM 102 HA LYS A 7 116.051 88.972 33.463 1.00 0.00 H
ATOM 103 HB2 LYS A 7 117.280 90.361 31.852 1.00 0.00 H
ATOM 104 HB3 LYS A 7 118.255 89.190 32.718 1.00 0.00 H
ATOM 105 HG2 LYS A 7 118.489 87.643 30.689 1.00 0.00 H
ATOM 106 HG3 LYS A 7 117.430 88.642 29.835 1.00 0.00 H
ATOM 107 HD2 LYS A 7 119.130 90.618 30.011 1.00 0.00 H
ATOM 108 HD3 LYS A 7 120.057 89.531 31.003 1.00 0.00 H
ATOM 109 HE2 LYS A 7 120.882 89.807 28.836 1.00 0.00 H
ATOM 110 HE3 LYS A 7 120.595 88.150 28.967 1.00 0.00 H
ATOM 111 HZ1 LYS A 7 119.669 88.987 26.775 1.00 0.00 H
ATOM 112 HZ2 LYS A 7 118.590 88.249 27.610 1.00 0.00 H
ATOM 113 HZ3 LYS A 7 118.593 89.876 27.631 1.00 0.00 H
ATOM 114 N ARG A 8 114.283 89.657 31.812 1.00 0.00 N
ATOM 115 CA ARG A 8 112.892 89.714 31.242 1.00 0.00 C
ATOM 116 C ARG A 8 112.759 90.668 30.002 1.00 0.00 C
ATOM 117 O ARG A 8 113.456 91.639 29.837 1.00 0.00 O
ATOM 118 CB ARG A 8 111.869 90.201 32.358 1.00 0.00 C
ATOM 119 CG ARG A 8 111.636 89.241 33.575 1.00 0.00 C
ATOM 120 CD ARG A 8 112.661 89.295 34.728 1.00 0.00 C
ATOM 121 NE ARG A 8 112.199 88.733 35.946 1.00 0.00 N
ATOM 122 CZ ARG A 8 112.177 87.428 36.182 1.00 0.00 C
ATOM 123 NH1 ARG A 8 112.610 86.472 35.358 1.00 0.00 N1+
ATOM 124 NH2 ARG A 8 111.772 87.049 37.367 1.00 0.00 N
ATOM 125 H ARG A 8 114.690 90.432 32.316 1.00 0.00 H
ATOM 126 HA ARG A 8 112.624 88.678 31.034 1.00 0.00 H
ATOM 127 HB2 ARG A 8 112.224 91.183 32.670 1.00 0.00 H
ATOM 128 HB3 ARG A 8 110.900 90.212 31.860 1.00 0.00 H
ATOM 129 HG2 ARG A 8 110.611 89.351 33.928 1.00 0.00 H
ATOM 130 HG3 ARG A 8 111.782 88.290 33.062 1.00 0.00 H
ATOM 131 HD2 ARG A 8 113.538 88.765 34.356 1.00 0.00 H
ATOM 132 HD3 ARG A 8 112.935 90.330 34.934 1.00 0.00 H
ATOM 133 HE ARG A 8 111.937 89.351 36.701 1.00 0.00 H
ATOM 134 HH11 ARG A 8 113.067 86.600 34.467 1.00 0.00 H
ATOM 135 HH12 ARG A 8 112.420 85.502 35.563 1.00 0.00 H
ATOM 136 HH21 ARG A 8 111.597 87.751 38.072 1.00 0.00 H
ATOM 137 HH22 ARG A 8 112.015 86.138 37.729 1.00 0.00 H
ATOM 138 N CYS A 9 111.632 90.371 29.262 1.00 0.00 N
ATOM 139 CA CYS A 9 111.296 91.213 28.079 1.00 0.00 C
ATOM 140 C CYS A 9 111.184 92.713 28.374 1.00 0.00 C
ATOM 141 O CYS A 9 110.751 93.131 29.491 1.00 0.00 O
ATOM 142 CB CYS A 9 109.998 90.612 27.476 1.00 0.00 C
ATOM 143 SG CYS A 9 109.496 91.546 25.958 1.00 0.00 S
ATOM 144 H CYS A 9 111.105 89.564 29.562 1.00 0.00 H
ATOM 145 HA CYS A 9 112.118 91.045 27.384 1.00 0.00 H
ATOM 146 HB2 CYS A 9 110.084 89.546 27.263 1.00 0.00 H
ATOM 147 HB3 CYS A 9 109.225 90.624 28.245 1.00 0.00 H
ATOM 148 HG CYS A 9 110.400 90.930 25.190 1.00 0.00 H
ATOM 149 N LYS A 10 111.340 93.616 27.366 1.00 0.00 N
ATOM 150 CA LYS A 10 110.997 95.052 27.457 1.00 0.00 C
ATOM 151 C LYS A 10 109.635 95.349 28.068 1.00 0.00 C
ATOM 152 O LYS A 10 109.507 96.364 28.760 1.00 0.00 O
ATOM 153 CB LYS A 10 111.303 95.734 26.149 1.00 0.00 C
ATOM 154 CG LYS A 10 110.166 95.592 25.012 1.00 0.00 C
ATOM 155 CD LYS A 10 110.480 96.345 23.712 1.00 0.00 C
ATOM 156 CE LYS A 10 110.786 97.805 24.057 1.00 0.00 C
ATOM 157 NZ LYS A 10 110.618 98.704 22.851 1.00 0.00 N1+
ATOM 158 H LYS A 10 111.634 93.227 26.482 1.00 0.00 H
ATOM 159 HA LYS A 10 111.695 95.521 28.150 1.00 0.00 H
ATOM 160 HB2 LYS A 10 111.573 96.788 26.212 1.00 0.00 H
ATOM 161 HB3 LYS A 10 112.171 95.172 25.805 1.00 0.00 H
ATOM 162 HG2 LYS A 10 109.959 94.540 24.816 1.00 0.00 H
ATOM 163 HG3 LYS A 10 109.228 96.041 25.337 1.00 0.00 H
ATOM 164 HD2 LYS A 10 111.349 95.877 23.248 1.00 0.00 H
ATOM 165 HD3 LYS A 10 109.586 96.322 23.089 1.00 0.00 H
ATOM 166 HE2 LYS A 10 110.179 98.075 24.921 1.00 0.00 H
ATOM 167 HE3 LYS A 10 111.838 97.941 24.307 1.00 0.00 H
ATOM 168 HZ1 LYS A 10 111.112 98.363 22.039 1.00 0.00 H
ATOM 169 HZ2 LYS A 10 109.667 98.764 22.516 1.00 0.00 H
ATOM 170 HZ3 LYS A 10 110.933 99.654 22.992 1.00 0.00 H
ATOM 171 N LEU A 11 108.634 94.421 27.927 1.00 0.00 N
ATOM 172 CA LEU A 11 107.379 94.559 28.614 1.00 0.00 C
ATOM 173 C LEU A 11 107.536 94.831 30.098 1.00 0.00 C
ATOM 174 O LEU A 11 106.878 95.703 30.593 1.00 0.00 O
ATOM 175 CB LEU A 11 106.521 93.302 28.252 1.00 0.00 C
ATOM 176 CG LEU A 11 105.081 93.241 28.821 1.00 0.00 C
ATOM 177 CD1 LEU A 11 104.057 93.956 27.935 1.00 0.00 C
ATOM 178 CD2 LEU A 11 104.601 91.833 28.808 1.00 0.00 C
ATOM 179 H LEU A 11 108.652 93.793 27.136 1.00 0.00 H
ATOM 180 HA LEU A 11 106.889 95.420 28.159 1.00 0.00 H
ATOM 181 HB2 LEU A 11 106.489 93.319 27.162 1.00 0.00 H
ATOM 182 HB3 LEU A 11 107.148 92.495 28.632 1.00 0.00 H
ATOM 183 HG LEU A 11 105.065 93.641 29.835 1.00 0.00 H
ATOM 184 HD11 LEU A 11 103.085 93.876 28.422 1.00 0.00 H
ATOM 185 HD12 LEU A 11 104.360 95.002 27.873 1.00 0.00 H
ATOM 186 HD13 LEU A 11 104.165 93.473 26.964 1.00 0.00 H
ATOM 187 HD21 LEU A 11 103.553 91.794 29.106 1.00 0.00 H
ATOM 188 HD22 LEU A 11 104.606 91.489 27.774 1.00 0.00 H
ATOM 189 HD23 LEU A 11 105.201 91.119 29.371 1.00 0.00 H
ATOM 190 N SER A 12 108.392 94.169 30.878 1.00 0.00 N
ATOM 191 CA SER A 12 108.600 94.396 32.289 1.00 0.00 C
ATOM 192 C SER A 12 108.995 95.868 32.668 1.00 0.00 C
ATOM 193 O SER A 12 108.701 96.215 33.808 1.00 0.00 O
ATOM 194 CB SER A 12 109.661 93.422 32.897 1.00 0.00 C
ATOM 195 OG SER A 12 110.849 93.604 32.304 1.00 0.00 O
ATOM 196 H SER A 12 108.802 93.353 30.446 1.00 0.00 H
ATOM 197 HA SER A 12 107.714 94.210 32.896 1.00 0.00 H
ATOM 198 HB2 SER A 12 109.614 93.490 33.984 1.00 0.00 H
ATOM 199 HB3 SER A 12 109.376 92.378 32.763 1.00 0.00 H
ATOM 200 HG SER A 12 110.790 93.578 31.346 1.00 0.00 H
ATOM 201 N CYS A 13 109.592 96.686 31.805 1.00 0.00 N
ATOM 202 CA CYS A 13 109.732 98.145 31.954 1.00 0.00 C
ATOM 203 C CYS A 13 108.351 98.885 31.955 1.00 0.00 C
ATOM 204 O CYS A 13 108.454 100.054 32.245 1.00 0.00 O
ATOM 205 CB CYS A 13 110.635 98.709 30.812 1.00 0.00 C
ATOM 206 SG CYS A 13 112.060 97.628 30.530 1.00 0.00 S
ATOM 207 H CYS A 13 109.779 96.308 30.887 1.00 0.00 H
ATOM 208 HA CYS A 13 110.243 98.370 32.890 1.00 0.00 H
ATOM 209 HB2 CYS A 13 110.079 98.816 29.880 1.00 0.00 H
ATOM 210 HB3 CYS A 13 111.015 99.705 31.040 1.00 0.00 H
ATOM 211 HG CYS A 13 112.389 97.516 31.820 1.00 0.00 H
ATOM 212 N VAL A 14 107.206 98.289 31.706 1.00 0.00 N
ATOM 213 CA VAL A 14 105.925 98.903 32.006 1.00 0.00 C
ATOM 214 C VAL A 14 105.080 98.047 32.943 1.00 0.00 C
ATOM 215 O VAL A 14 104.623 98.492 34.014 1.00 0.00 O
ATOM 216 CB VAL A 14 105.171 99.385 30.719 1.00 0.00 C
ATOM 217 CG1 VAL A 14 106.144 99.924 29.640 1.00 0.00 C
ATOM 218 CG2 VAL A 14 104.233 98.365 30.055 1.00 0.00 C
ATOM 219 H VAL A 14 107.175 97.285 31.599 1.00 0.00 H
ATOM 220 HA VAL A 14 106.165 99.795 32.584 1.00 0.00 H
ATOM 221 HB VAL A 14 104.552 100.203 31.090 1.00 0.00 H
ATOM 222 HG11 VAL A 14 106.592 99.084 29.109 1.00 0.00 H
ATOM 223 HG12 VAL A 14 105.572 100.465 28.886 1.00 0.00 H
ATOM 224 HG13 VAL A 14 106.928 100.498 30.135 1.00 0.00 H
ATOM 225 HG21 VAL A 14 104.882 97.558 29.713 1.00 0.00 H
ATOM 226 HG22 VAL A 14 103.575 98.023 30.853 1.00 0.00 H
ATOM 227 HG23 VAL A 14 103.672 98.747 29.202 1.00 0.00 H
ATOM 228 N ALA A 15 105.019 96.760 32.628 1.00 0.00 N
ATOM 229 CA ALA A 15 104.219 95.818 33.388 1.00 0.00 C
ATOM 230 C ALA A 15 104.812 95.620 34.847 1.00 0.00 C
ATOM 231 O ALA A 15 105.932 95.939 35.107 1.00 0.00 O
ATOM 232 CB ALA A 15 104.119 94.497 32.633 1.00 0.00 C
ATOM 233 H ALA A 15 105.391 96.407 31.758 1.00 0.00 H
ATOM 234 HA ALA A 15 103.180 96.090 33.572 1.00 0.00 H
ATOM 235 HB1 ALA A 15 103.546 93.731 33.155 1.00 0.00 H
ATOM 236 HB2 ALA A 15 103.823 94.643 31.594 1.00 0.00 H
ATOM 237 HB3 ALA A 15 105.162 94.181 32.642 1.00 0.00 H
ATOM 238 N THR A 16 104.041 95.055 35.759 1.00 0.00 N
ATOM 239 CA THR A 16 104.496 94.910 37.119 1.00 0.00 C
ATOM 240 C THR A 16 104.120 93.582 37.859 1.00 0.00 C
ATOM 241 O THR A 16 103.054 93.023 37.712 1.00 0.00 O
ATOM 242 CB THR A 16 103.983 96.152 37.970 1.00 0.00 C
ATOM 243 CG2 THR A 16 102.536 96.550 37.781 1.00 0.00 C
ATOM 244 OG1 THR A 16 104.269 95.988 39.353 1.00 0.00 O
ATOM 245 H THR A 16 103.103 94.752 35.539 1.00 0.00 H
ATOM 246 HA THR A 16 105.581 94.967 37.208 1.00 0.00 H
ATOM 247 HB THR A 16 104.562 97.025 37.666 1.00 0.00 H
ATOM 248 HG1 THR A 16 103.794 96.723 39.746 1.00 0.00 H
ATOM 249 HG21 THR A 16 102.505 97.331 37.020 1.00 0.00 H
ATOM 250 HG22 THR A 16 101.925 95.697 37.487 1.00 0.00 H
ATOM 251 HG23 THR A 16 102.122 96.944 38.709 1.00 0.00 H
ATOM 252 N VAL A 17 105.041 93.135 38.718 1.00 0.00 N
ATOM 253 CA VAL A 17 104.720 91.864 39.447 1.00 0.00 C
ATOM 254 C VAL A 17 103.567 92.002 40.404 1.00 0.00 C
ATOM 255 O VAL A 17 102.938 91.068 40.841 1.00 0.00 O
ATOM 256 CB VAL A 17 106.056 91.205 39.978 1.00 0.00 C
ATOM 257 CG1 VAL A 17 106.701 92.106 40.931 1.00 0.00 C
ATOM 258 CG2 VAL A 17 105.886 89.853 40.707 1.00 0.00 C
ATOM 259 H VAL A 17 106.008 93.425 38.677 1.00 0.00 H
ATOM 260 HA VAL A 17 104.367 91.073 38.786 1.00 0.00 H
ATOM 261 HB VAL A 17 106.738 90.987 39.156 1.00 0.00 H
ATOM 262 HG11 VAL A 17 107.710 91.733 41.105 1.00 0.00 H
ATOM 263 HG12 VAL A 17 106.785 93.117 40.533 1.00 0.00 H
ATOM 264 HG13 VAL A 17 106.171 92.107 41.884 1.00 0.00 H
ATOM 265 HG21 VAL A 17 105.357 89.211 40.002 1.00 0.00 H
ATOM 266 HG22 VAL A 17 106.865 89.393 40.842 1.00 0.00 H
ATOM 267 HG23 VAL A 17 105.526 89.907 41.734 1.00 0.00 H
ATOM 268 N ASP A 18 103.220 93.246 40.766 1.00 0.00 N
ATOM 269 CA ASP A 18 102.111 93.581 41.671 1.00 0.00 C
ATOM 270 C ASP A 18 100.724 93.068 41.108 1.00 0.00 C
ATOM 271 O ASP A 18 99.912 92.477 41.818 1.00 0.00 O
ATOM 272 CB ASP A 18 102.189 95.071 41.992 1.00 0.00 C
ATOM 273 CG ASP A 18 103.350 95.468 42.937 1.00 0.00 C
ATOM 274 OD1 ASP A 18 103.636 94.680 43.836 1.00 0.00 O
ATOM 275 OD2 ASP A 18 103.690 96.687 42.884 1.00 0.00 O1-
ATOM 276 H ASP A 18 103.632 93.999 40.233 1.00 0.00 H
ATOM 277 HA ASP A 18 102.183 93.045 42.618 1.00 0.00 H
ATOM 278 HB2 ASP A 18 102.238 95.515 40.998 1.00 0.00 H
ATOM 279 HB3 ASP A 18 101.225 95.309 42.442 1.00 0.00 H
ATOM 280 N ASP A 19 100.447 93.276 39.818 1.00 0.00 N
ATOM 281 CA ASP A 19 99.203 92.830 39.124 1.00 0.00 C
ATOM 282 C ASP A 19 99.057 91.335 39.181 1.00 0.00 C
ATOM 283 O ASP A 19 98.027 90.765 38.857 1.00 0.00 O
ATOM 284 CB ASP A 19 99.031 93.250 37.669 1.00 0.00 C
ATOM 285 CG ASP A 19 98.984 94.791 37.517 1.00 0.00 C
ATOM 286 OD1 ASP A 19 99.418 95.286 36.489 1.00 0.00 O
ATOM 287 OD2 ASP A 19 98.310 95.536 38.289 1.00 0.00 O1-
ATOM 288 H ASP A 19 101.136 93.764 39.263 1.00 0.00 H
ATOM 289 HA ASP A 19 98.386 93.223 39.730 1.00 0.00 H
ATOM 290 HB2 ASP A 19 99.846 92.780 37.119 1.00 0.00 H
ATOM 291 HB3 ASP A 19 98.107 92.835 37.268 1.00 0.00 H
ATOM 292 N VAL A 20 100.129 90.581 39.586 1.00 0.00 N
ATOM 293 CA VAL A 20 100.269 89.135 39.538 1.00 0.00 C
ATOM 294 C VAL A 20 100.293 88.565 41.003 1.00 0.00 C
ATOM 295 O VAL A 20 99.609 87.609 41.307 1.00 0.00 O
ATOM 296 CB VAL A 20 101.501 88.800 38.712 1.00 0.00 C
ATOM 297 CG1 VAL A 20 101.656 87.261 38.544 1.00 0.00 C
ATOM 298 CG2 VAL A 20 101.505 89.374 37.307 1.00 0.00 C
ATOM 299 H VAL A 20 100.878 91.023 40.100 1.00 0.00 H
ATOM 300 HA VAL A 20 99.452 88.682 38.976 1.00 0.00 H
ATOM 301 HB VAL A 20 102.374 89.115 39.283 1.00 0.00 H
ATOM 302 HG11 VAL A 20 100.797 86.824 38.035 1.00 0.00 H
ATOM 303 HG12 VAL A 20 102.538 86.957 37.980 1.00 0.00 H
ATOM 304 HG13 VAL A 20 101.924 86.851 39.517 1.00 0.00 H
ATOM 305 HG21 VAL A 20 100.740 88.812 36.772 1.00 0.00 H
ATOM 306 HG22 VAL A 20 101.234 90.427 37.229 1.00 0.00 H
ATOM 307 HG23 VAL A 20 102.460 89.256 36.794 1.00 0.00 H
ATOM 308 N ILE A 21 100.904 89.384 41.925 1.00 0.00 N
ATOM 309 CA ILE A 21 100.696 89.151 43.369 1.00 0.00 C
ATOM 310 C ILE A 21 99.234 89.408 43.749 1.00 0.00 C
ATOM 311 O ILE A 21 98.589 88.558 44.280 1.00 0.00 O
ATOM 312 CB ILE A 21 101.632 90.113 44.134 1.00 0.00 C
ATOM 313 CG1 ILE A 21 103.113 89.775 43.810 1.00 0.00 C
ATOM 314 CG2 ILE A 21 101.541 89.982 45.656 1.00 0.00 C
ATOM 315 CD1 ILE A 21 104.091 90.940 44.188 1.00 0.00 C
ATOM 316 H ILE A 21 101.588 90.043 41.581 1.00 0.00 H
ATOM 317 HA ILE A 21 101.008 88.116 43.505 1.00 0.00 H
ATOM 318 HB ILE A 21 101.437 91.153 43.871 1.00 0.00 H
ATOM 319 HG12 ILE A 21 103.466 88.916 44.380 1.00 0.00 H
ATOM 320 HG13 ILE A 21 103.283 89.531 42.761 1.00 0.00 H
ATOM 321 HG21 ILE A 21 101.817 88.975 45.969 1.00 0.00 H
ATOM 322 HG22 ILE A 21 102.013 90.708 46.318 1.00 0.00 H
ATOM 323 HG23 ILE A 21 100.519 90.299 45.865 1.00 0.00 H
ATOM 324 HD11 ILE A 21 105.105 90.771 43.825 1.00 0.00 H
ATOM 325 HD12 ILE A 21 103.684 91.779 43.623 1.00 0.00 H
ATOM 326 HD13 ILE A 21 104.174 91.142 45.256 1.00 0.00 H
ATOM 327 N GLU A 22 98.557 90.434 43.175 1.00 0.00 N
ATOM 328 CA GLU A 22 97.111 90.656 43.139 1.00 0.00 C
ATOM 329 C GLU A 22 96.207 89.506 42.721 1.00 0.00 C
ATOM 330 O GLU A 22 95.242 89.167 43.396 1.00 0.00 O
ATOM 331 CB GLU A 22 96.699 91.970 42.393 1.00 0.00 C
ATOM 332 CG GLU A 22 95.229 92.309 42.516 1.00 0.00 C
ATOM 333 CD GLU A 22 94.884 93.769 42.287 1.00 0.00 C
ATOM 334 OE1 GLU A 22 93.914 94.151 42.951 1.00 0.00 O
ATOM 335 OE2 GLU A 22 95.390 94.449 41.364 1.00 0.00 O1-
ATOM 336 H GLU A 22 99.048 91.236 42.806 1.00 0.00 H
ATOM 337 HA GLU A 22 96.800 90.886 44.158 1.00 0.00 H
ATOM 338 HB2 GLU A 22 97.308 92.748 42.852 1.00 0.00 H
ATOM 339 HB3 GLU A 22 96.973 91.882 41.342 1.00 0.00 H
ATOM 340 HG2 GLU A 22 94.719 91.721 41.753 1.00 0.00 H
ATOM 341 HG3 GLU A 22 94.827 91.954 43.465 1.00 0.00 H
ATOM 342 N GLN A 23 96.551 88.888 41.603 1.00 0.00 N
ATOM 343 CA GLN A 23 95.836 87.817 40.991 1.00 0.00 C
ATOM 344 C GLN A 23 95.931 86.511 41.865 1.00 0.00 C
ATOM 345 O GLN A 23 95.051 85.606 41.729 1.00 0.00 O
ATOM 346 CB GLN A 23 96.485 87.452 39.725 1.00 0.00 C
ATOM 347 CG GLN A 23 95.695 86.336 38.897 1.00 0.00 C
ATOM 348 CD GLN A 23 96.128 86.335 37.401 1.00 0.00 C
ATOM 349 NE2 GLN A 23 95.361 85.678 36.456 1.00 0.00 N
ATOM 350 OE1 GLN A 23 97.184 86.833 37.008 1.00 0.00 O
ATOM 351 H GLN A 23 97.405 89.131 41.123 1.00 0.00 H
ATOM 352 HA GLN A 23 94.791 88.051 40.789 1.00 0.00 H
ATOM 353 HB2 GLN A 23 96.660 88.314 39.082 1.00 0.00 H
ATOM 354 HB3 GLN A 23 97.455 87.032 39.992 1.00 0.00 H
ATOM 355 HG2 GLN A 23 95.933 85.329 39.240 1.00 0.00 H
ATOM 356 HG3 GLN A 23 94.616 86.484 38.883 1.00 0.00 H
ATOM 357 HE21 GLN A 23 95.609 85.806 35.485 1.00 0.00 H
ATOM 358 HE22 GLN A 23 94.442 85.345 36.710 1.00 0.00 H
ATOM 359 N VAL A 24 96.869 86.378 42.815 1.00 0.00 N
ATOM 360 CA VAL A 24 96.952 85.239 43.707 1.00 0.00 C
ATOM 361 C VAL A 24 95.726 85.131 44.636 1.00 0.00 C
ATOM 362 O VAL A 24 95.217 84.059 44.876 1.00 0.00 O
ATOM 363 CB VAL A 24 98.265 85.285 44.527 1.00 0.00 C
ATOM 364 CG1 VAL A 24 98.428 84.173 45.523 1.00 0.00 C
ATOM 365 CG2 VAL A 24 99.526 85.115 43.676 1.00 0.00 C
ATOM 366 H VAL A 24 97.374 87.253 42.822 1.00 0.00 H
ATOM 367 HA VAL A 24 97.015 84.308 43.143 1.00 0.00 H
ATOM 368 HB VAL A 24 98.311 86.213 45.098 1.00 0.00 H
ATOM 369 HG11 VAL A 24 98.389 83.164 45.115 1.00 0.00 H
ATOM 370 HG12 VAL A 24 99.395 84.215 46.025 1.00 0.00 H
ATOM 371 HG13 VAL A 24 97.665 84.199 46.301 1.00 0.00 H
ATOM 372 HG21 VAL A 24 99.562 84.126 43.218 1.00 0.00 H
ATOM 373 HG22 VAL A 24 99.586 85.956 42.985 1.00 0.00 H
ATOM 374 HG23 VAL A 24 100.393 85.309 44.308 1.00 0.00 H
ATOM 375 N MET A 25 95.099 86.272 44.957 1.00 0.00 N
ATOM 376 CA MET A 25 93.935 86.349 45.769 1.00 0.00 C
ATOM 377 C MET A 25 92.689 85.725 44.957 1.00 0.00 C
ATOM 378 O MET A 25 91.596 85.511 45.530 1.00 0.00 O
ATOM 379 CB MET A 25 93.545 87.775 46.185 1.00 0.00 C
ATOM 380 CG MET A 25 94.602 88.285 47.180 1.00 0.00 C
ATOM 381 SD MET A 25 94.690 87.344 48.755 1.00 0.00 S
ATOM 382 CE MET A 25 93.414 88.181 49.766 1.00 0.00 C
ATOM 383 H MET A 25 95.389 87.125 44.500 1.00 0.00 H
ATOM 384 HA MET A 25 93.995 85.758 46.683 1.00 0.00 H
ATOM 385 HB2 MET A 25 93.545 88.458 45.336 1.00 0.00 H
ATOM 386 HB3 MET A 25 92.600 87.765 46.728 1.00 0.00 H
ATOM 387 HG2 MET A 25 95.597 88.183 46.747 1.00 0.00 H
ATOM 388 HG3 MET A 25 94.311 89.302 47.443 1.00 0.00 H
ATOM 389 HE1 MET A 25 93.372 89.270 49.747 1.00 0.00 H
ATOM 390 HE2 MET A 25 92.367 87.921 49.607 1.00 0.00 H
ATOM 391 HE3 MET A 25 93.547 87.740 50.754 1.00 0.00 H
ATOM 392 N THR A 26 92.870 85.531 43.634 1.00 0.00 N
ATOM 393 CA THR A 26 91.851 84.698 42.916 1.00 0.00 C
ATOM 394 C THR A 26 92.054 83.227 43.102 1.00 0.00 C
ATOM 395 O THR A 26 91.053 82.536 43.009 1.00 0.00 O
ATOM 396 CB THR A 26 91.860 84.899 41.395 1.00 0.00 C
ATOM 397 CG2 THR A 26 91.712 86.283 40.971 1.00 0.00 C
ATOM 398 OG1 THR A 26 93.087 84.476 40.737 1.00 0.00 O
ATOM 399 H THR A 26 93.723 85.870 43.213 1.00 0.00 H
ATOM 400 HA THR A 26 90.840 84.920 43.258 1.00 0.00 H
ATOM 401 HB THR A 26 90.922 84.473 41.041 1.00 0.00 H
ATOM 402 HG1 THR A 26 93.774 85.111 40.948 1.00 0.00 H
ATOM 403 HG21 THR A 26 90.825 86.684 41.463 1.00 0.00 H
ATOM 404 HG22 THR A 26 92.520 86.982 41.182 1.00 0.00 H
ATOM 405 HG23 THR A 26 91.595 86.215 39.889 1.00 0.00 H
ATOM 406 N TYR A 27 93.236 82.691 43.348 1.00 0.00 N
ATOM 407 CA TYR A 27 93.397 81.260 43.575 1.00 0.00 C
ATOM 408 C TYR A 27 93.084 80.995 45.074 1.00 0.00 C
ATOM 409 O TYR A 27 92.510 79.919 45.299 1.00 0.00 O
ATOM 410 CB TYR A 27 94.922 80.810 43.244 1.00 0.00 C
ATOM 411 CG TYR A 27 95.268 79.377 43.750 1.00 0.00 C
ATOM 412 CD1 TYR A 27 94.889 78.291 43.044 1.00 0.00 C
ATOM 413 CD2 TYR A 27 95.938 79.301 45.008 1.00 0.00 C
ATOM 414 CE1 TYR A 27 95.237 77.029 43.524 1.00 0.00 C
ATOM 415 CE2 TYR A 27 96.282 77.980 45.522 1.00 0.00 C
ATOM 416 CZ TYR A 27 95.936 76.842 44.702 1.00 0.00 C
ATOM 417 OH TYR A 27 96.180 75.613 45.157 1.00 0.00 O
ATOM 418 H TYR A 27 94.002 83.329 43.512 1.00 0.00 H
ATOM 419 HA TYR A 27 92.652 80.645 43.071 1.00 0.00 H
ATOM 420 HB2 TYR A 27 95.073 80.764 42.166 1.00 0.00 H
ATOM 421 HB3 TYR A 27 95.646 81.585 43.494 1.00 0.00 H
ATOM 422 HD1 TYR A 27 94.293 78.526 42.174 1.00 0.00 H
ATOM 423 HD2 TYR A 27 96.254 80.174 45.560 1.00 0.00 H
ATOM 424 HE1 TYR A 27 94.949 76.117 43.023 1.00 0.00 H
ATOM 425 HE2 TYR A 27 96.977 77.802 46.329 1.00 0.00 H
ATOM 426 HH TYR A 27 96.667 75.709 45.978 1.00 0.00 H
ATOM 427 N ILE A 28 93.398 81.800 46.052 1.00 0.00 N
ATOM 428 CA ILE A 28 93.128 81.548 47.456 1.00 0.00 C
ATOM 429 C ILE A 28 91.594 81.618 47.700 1.00 0.00 C
ATOM 430 O ILE A 28 91.011 82.501 47.085 1.00 0.00 O
ATOM 431 CB ILE A 28 93.947 82.503 48.393 1.00 0.00 C
ATOM 432 CG1 ILE A 28 95.455 82.463 48.281 1.00 0.00 C
ATOM 433 CG2 ILE A 28 93.577 82.221 49.883 1.00 0.00 C
ATOM 434 CD1 ILE A 28 96.122 81.219 48.605 1.00 0.00 C
ATOM 435 H ILE A 28 93.924 82.631 45.825 1.00 0.00 H
ATOM 436 HA ILE A 28 93.450 80.542 47.725 1.00 0.00 H
ATOM 437 HB ILE A 28 93.538 83.493 48.188 1.00 0.00 H
ATOM 438 HG12 ILE A 28 95.792 82.927 47.354 1.00 0.00 H
ATOM 439 HG13 ILE A 28 95.943 83.174 48.947 1.00 0.00 H
ATOM 440 HG21 ILE A 28 93.543 81.144 50.047 1.00 0.00 H
ATOM 441 HG22 ILE A 28 94.361 82.643 50.511 1.00 0.00 H
ATOM 442 HG23 ILE A 28 92.621 82.591 50.256 1.00 0.00 H
ATOM 443 HD11 ILE A 28 96.058 81.016 49.674 1.00 0.00 H
ATOM 444 HD12 ILE A 28 95.623 80.426 48.049 1.00 0.00 H
ATOM 445 HD13 ILE A 28 97.158 81.335 48.285 1.00 0.00 H
ATOM 446 N THR A 29 90.986 80.978 48.705 1.00 0.00 N
ATOM 447 CA THR A 29 89.522 81.138 49.118 1.00 0.00 C
ATOM 448 C THR A 29 89.302 80.714 50.605 1.00 0.00 C
ATOM 449 O THR A 29 88.680 81.452 51.334 1.00 0.00 O
ATOM 450 CB THR A 29 88.591 80.451 48.167 1.00 0.00 C
ATOM 451 CG2 THR A 29 88.728 78.913 48.083 1.00 0.00 C
ATOM 452 OG1 THR A 29 87.259 80.886 48.409 1.00 0.00 O
ATOM 453 H THR A 29 91.529 80.326 49.253 1.00 0.00 H
ATOM 454 HA THR A 29 89.314 82.208 49.097 1.00 0.00 H
ATOM 455 HB THR A 29 88.928 80.806 47.193 1.00 0.00 H
ATOM 456 HG1 THR A 29 87.291 81.821 48.192 1.00 0.00 H
ATOM 457 HG21 THR A 29 89.719 78.778 47.650 1.00 0.00 H
ATOM 458 HG22 THR A 29 88.595 78.445 49.058 1.00 0.00 H
ATOM 459 HG23 THR A 29 88.111 78.516 47.277 1.00 0.00 H
ATOM 460 N ASP A 30 89.763 79.509 50.956 1.00 0.00 N
ATOM 461 CA ASP A 30 89.651 78.954 52.384 1.00 0.00 C
ATOM 462 C ASP A 30 90.224 79.946 53.451 1.00 0.00 C
ATOM 463 O ASP A 30 91.369 80.329 53.287 1.00 0.00 O
ATOM 464 CB ASP A 30 90.435 77.695 52.277 1.00 0.00 C
ATOM 465 CG ASP A 30 90.547 76.844 53.566 1.00 0.00 C
ATOM 466 OD1 ASP A 30 89.681 77.025 54.467 1.00 0.00 O
ATOM 467 OD2 ASP A 30 91.301 75.822 53.597 1.00 0.00 O1-
ATOM 468 H ASP A 30 90.244 78.955 50.262 1.00 0.00 H
ATOM 469 HA ASP A 30 88.597 78.724 52.545 1.00 0.00 H
ATOM 470 HB2 ASP A 30 90.046 76.950 51.582 1.00 0.00 H
ATOM 471 HB3 ASP A 30 91.420 77.918 51.868 1.00 0.00 H
ATOM 472 N PRO A 31 89.441 80.184 54.546 1.00 0.00 N
ATOM 473 CA PRO A 31 89.965 81.014 55.666 1.00 0.00 C
ATOM 474 C PRO A 31 91.400 80.733 56.131 1.00 0.00 C
ATOM 475 O PRO A 31 92.025 81.668 56.574 1.00 0.00 O
ATOM 476 CB PRO A 31 88.955 80.832 56.714 1.00 0.00 C
ATOM 477 CG PRO A 31 87.617 80.482 56.069 1.00 0.00 C
ATOM 478 CD PRO A 31 88.101 79.754 54.795 1.00 0.00 C
ATOM 479 HA PRO A 31 90.059 82.069 55.412 1.00 0.00 H
ATOM 480 HB2 PRO A 31 89.349 79.997 57.294 1.00 0.00 H
ATOM 481 HB3 PRO A 31 88.986 81.636 57.450 1.00 0.00 H
ATOM 482 HG2 PRO A 31 87.008 79.801 56.663 1.00 0.00 H
ATOM 483 HG3 PRO A 31 87.073 81.395 55.828 1.00 0.00 H
ATOM 484 HD2 PRO A 31 88.046 78.670 54.900 1.00 0.00 H
ATOM 485 HD3 PRO A 31 87.488 80.126 53.974 1.00 0.00 H
ATOM 486 N LYS A 32 91.838 79.485 56.191 1.00 0.00 N
ATOM 487 CA LYS A 32 93.174 79.153 56.722 1.00 0.00 C
ATOM 488 C LYS A 32 94.264 79.544 55.716 1.00 0.00 C
ATOM 489 O LYS A 32 95.396 79.848 56.080 1.00 0.00 O
ATOM 490 CB LYS A 32 93.332 77.734 57.239 1.00 0.00 C
ATOM 491 CG LYS A 32 93.520 76.672 56.149 1.00 0.00 C
ATOM 492 CD LYS A 32 93.780 75.244 56.547 1.00 0.00 C
ATOM 493 CE LYS A 32 93.570 74.272 55.403 1.00 0.00 C
ATOM 494 NZ LYS A 32 94.276 74.494 54.122 1.00 0.00 N1+
ATOM 495 H LYS A 32 91.332 78.649 55.935 1.00 0.00 H
ATOM 496 HA LYS A 32 93.492 79.747 57.578 1.00 0.00 H
ATOM 497 HB2 LYS A 32 94.229 77.627 57.849 1.00 0.00 H
ATOM 498 HB3 LYS A 32 92.489 77.468 57.877 1.00 0.00 H
ATOM 499 HG2 LYS A 32 92.613 76.730 55.547 1.00 0.00 H
ATOM 500 HG3 LYS A 32 94.296 76.977 55.448 1.00 0.00 H
ATOM 501 HD2 LYS A 32 94.840 75.224 56.803 1.00 0.00 H
ATOM 502 HD3 LYS A 32 93.190 74.935 57.410 1.00 0.00 H
ATOM 503 HE2 LYS A 32 93.763 73.255 55.745 1.00 0.00 H
ATOM 504 HE3 LYS A 32 92.505 74.240 55.173 1.00 0.00 H
ATOM 505 HZ1 LYS A 32 94.280 73.700 53.496 1.00 0.00 H
ATOM 506 HZ2 LYS A 32 93.941 75.265 53.562 1.00 0.00 H
ATOM 507 HZ3 LYS A 32 95.271 74.605 54.256 1.00 0.00 H
ATOM 508 N ASP A 33 93.916 79.642 54.466 1.00 0.00 N
ATOM 509 CA ASP A 33 94.799 80.104 53.388 1.00 0.00 C
ATOM 510 C ASP A 33 94.716 81.649 53.208 1.00 0.00 C
ATOM 511 O ASP A 33 95.769 82.251 52.866 1.00 0.00 O
ATOM 512 CB ASP A 33 94.488 79.425 52.071 1.00 0.00 C
ATOM 513 CG ASP A 33 94.407 77.945 52.105 1.00 0.00 C
ATOM 514 OD1 ASP A 33 94.655 77.296 53.156 1.00 0.00 O
ATOM 515 OD2 ASP A 33 94.035 77.421 51.044 1.00 0.00 O1-
ATOM 516 H ASP A 33 92.999 79.334 54.176 1.00 0.00 H
ATOM 517 HA ASP A 33 95.829 79.893 53.678 1.00 0.00 H
ATOM 518 HB2 ASP A 33 93.507 79.802 51.781 1.00 0.00 H
ATOM 519 HB3 ASP A 33 95.171 79.644 51.251 1.00 0.00 H
ATOM 520 N ARG A 34 93.649 82.275 53.603 1.00 0.00 N
ATOM 521 CA ARG A 34 93.439 83.726 53.671 1.00 0.00 C
ATOM 522 C ARG A 34 94.230 84.379 54.853 1.00 0.00 C
ATOM 523 O ARG A 34 95.025 85.253 54.686 1.00 0.00 O
ATOM 524 CB ARG A 34 91.928 84.060 53.809 1.00 0.00 C
ATOM 525 CG ARG A 34 91.301 83.849 52.402 1.00 0.00 C
ATOM 526 CD ARG A 34 89.900 84.375 52.432 1.00 0.00 C
ATOM 527 NE ARG A 34 89.401 84.462 51.045 1.00 0.00 N
ATOM 528 CZ ARG A 34 89.624 85.450 50.234 1.00 0.00 C
ATOM 529 NH1 ARG A 34 90.095 86.598 50.653 1.00 0.00 N1+
ATOM 530 NH2 ARG A 34 89.205 85.418 48.959 1.00 0.00 N
ATOM 531 H ARG A 34 92.899 81.672 53.909 1.00 0.00 H
ATOM 532 HA ARG A 34 93.857 84.085 52.730 1.00 0.00 H
ATOM 533 HB2 ARG A 34 91.414 83.492 54.585 1.00 0.00 H
ATOM 534 HB3 ARG A 34 91.736 85.083 54.131 1.00 0.00 H
ATOM 535 HG2 ARG A 34 91.796 84.537 51.717 1.00 0.00 H
ATOM 536 HG3 ARG A 34 91.306 82.808 52.081 1.00 0.00 H
ATOM 537 HD2 ARG A 34 89.242 83.737 53.022 1.00 0.00 H
ATOM 538 HD3 ARG A 34 89.867 85.389 52.829 1.00 0.00 H
ATOM 539 HE ARG A 34 88.796 83.770 50.627 1.00 0.00 H
ATOM 540 HH11 ARG A 34 90.246 86.777 51.635 1.00 0.00 H
ATOM 541 HH12 ARG A 34 90.134 87.329 49.956 1.00 0.00 H
ATOM 542 HH21 ARG A 34 88.787 84.581 48.578 1.00 0.00 H
ATOM 543 HH22 ARG A 34 89.298 86.234 48.373 1.00 0.00 H
ATOM 544 N ASP A 35 94.041 83.822 56.046 1.00 0.00 N
ATOM 545 CA ASP A 35 94.879 83.974 57.253 1.00 0.00 C
ATOM 546 C ASP A 35 96.358 83.816 56.876 1.00 0.00 C
ATOM 547 O ASP A 35 97.121 84.618 57.380 1.00 0.00 O
ATOM 548 CB ASP A 35 94.413 83.063 58.350 1.00 0.00 C
ATOM 549 CG ASP A 35 93.301 83.597 59.138 1.00 0.00 C
ATOM 550 OD1 ASP A 35 92.817 82.959 60.141 1.00 0.00 O
ATOM 551 OD2 ASP A 35 92.869 84.726 58.918 1.00 0.00 O1-
ATOM 552 H ASP A 35 93.256 83.186 56.016 1.00 0.00 H
ATOM 553 HA ASP A 35 94.749 84.951 57.719 1.00 0.00 H
ATOM 554 HB2 ASP A 35 94.239 82.035 58.032 1.00 0.00 H
ATOM 555 HB3 ASP A 35 95.278 83.112 59.012 1.00 0.00 H
ATOM 556 N SER A 36 96.831 82.843 56.141 1.00 0.00 N
ATOM 557 CA SER A 36 98.239 82.713 55.722 1.00 0.00 C
ATOM 558 C SER A 36 98.568 83.738 54.623 1.00 0.00 C
ATOM 559 O SER A 36 99.727 84.188 54.601 1.00 0.00 O
ATOM 560 CB SER A 36 98.437 81.257 55.110 1.00 0.00 C
ATOM 561 OG SER A 36 98.125 80.396 56.183 1.00 0.00 O
ATOM 562 H SER A 36 96.199 82.086 55.924 1.00 0.00 H
ATOM 563 HA SER A 36 98.730 82.756 56.694 1.00 0.00 H
ATOM 564 HB2 SER A 36 97.631 81.101 54.394 1.00 0.00 H
ATOM 565 HB3 SER A 36 99.485 81.178 54.819 1.00 0.00 H
ATOM 566 HG SER A 36 97.192 80.171 56.149 1.00 0.00 H
ATOM 567 N ALA A 37 97.625 84.201 53.794 1.00 0.00 N
ATOM 568 CA ALA A 37 98.061 85.214 52.785 1.00 0.00 C
ATOM 569 C ALA A 37 98.286 86.575 53.506 1.00 0.00 C
ATOM 570 O ALA A 37 99.155 87.314 53.162 1.00 0.00 O
ATOM 571 CB ALA A 37 97.069 85.355 51.617 1.00 0.00 C
ATOM 572 H ALA A 37 96.736 83.745 53.644 1.00 0.00 H
ATOM 573 HA ALA A 37 98.982 84.915 52.283 1.00 0.00 H
ATOM 574 HB1 ALA A 37 97.424 85.792 50.684 1.00 0.00 H
ATOM 575 HB2 ALA A 37 96.795 84.376 51.224 1.00 0.00 H
ATOM 576 HB3 ALA A 37 96.121 85.713 52.018 1.00 0.00 H
ATOM 577 N SER A 38 97.429 86.859 54.469 1.00 0.00 N
ATOM 578 CA SER A 38 97.368 88.101 55.209 1.00 0.00 C
ATOM 579 C SER A 38 98.563 88.151 56.205 1.00 0.00 C
ATOM 580 O SER A 38 98.939 89.266 56.608 1.00 0.00 O
ATOM 581 CB SER A 38 95.973 88.195 55.839 1.00 0.00 C
ATOM 582 OG SER A 38 95.819 87.273 56.807 1.00 0.00 O
ATOM 583 H SER A 38 96.711 86.194 54.719 1.00 0.00 H
ATOM 584 HA SER A 38 97.606 88.855 54.459 1.00 0.00 H
ATOM 585 HB2 SER A 38 95.830 89.175 56.295 1.00 0.00 H
ATOM 586 HB3 SER A 38 95.255 88.076 55.028 1.00 0.00 H
ATOM 587 HG SER A 38 95.387 86.534 56.371 1.00 0.00 H
ATOM 588 N LEU A 39 99.095 86.983 56.643 1.00 0.00 N
ATOM 589 CA LEU A 39 100.299 86.971 57.517 1.00 0.00 C
ATOM 590 C LEU A 39 101.623 87.343 56.792 1.00 0.00 C
ATOM 591 O LEU A 39 102.647 87.568 57.428 1.00 0.00 O
ATOM 592 CB LEU A 39 100.333 85.512 58.187 1.00 0.00 C
ATOM 593 CG LEU A 39 101.421 85.363 59.278 1.00 0.00 C
ATOM 594 CD1 LEU A 39 101.554 86.237 60.488 1.00 0.00 C
ATOM 595 CD2 LEU A 39 101.213 83.894 59.786 1.00 0.00 C
ATOM 596 H LEU A 39 98.626 86.133 56.364 1.00 0.00 H
ATOM 597 HA LEU A 39 100.161 87.607 58.392 1.00 0.00 H
ATOM 598 HB2 LEU A 39 99.351 85.380 58.643 1.00 0.00 H
ATOM 599 HB3 LEU A 39 100.395 84.771 57.390 1.00 0.00 H
ATOM 600 HG LEU A 39 102.420 85.379 58.841 1.00 0.00 H
ATOM 601 HD11 LEU A 39 102.481 86.075 61.038 1.00 0.00 H
ATOM 602 HD12 LEU A 39 101.497 87.307 60.292 1.00 0.00 H
ATOM 603 HD13 LEU A 39 100.777 85.966 61.203 1.00 0.00 H
ATOM 604 HD21 LEU A 39 102.139 83.727 60.337 1.00 0.00 H
ATOM 605 HD22 LEU A 39 100.436 83.782 60.541 1.00 0.00 H
ATOM 606 HD23 LEU A 39 101.231 83.212 58.935 1.00 0.00 H
ATOM 607 N VAL A 40 101.657 87.206 55.471 1.00 0.00 N
ATOM 608 CA VAL A 40 102.947 87.195 54.738 1.00 0.00 C
ATOM 609 C VAL A 40 103.014 88.308 53.672 1.00 0.00 C
ATOM 610 O VAL A 40 104.114 88.528 53.065 1.00 0.00 O
ATOM 611 CB VAL A 40 103.387 85.774 54.269 1.00 0.00 C
ATOM 612 CG1 VAL A 40 103.245 84.752 55.415 1.00 0.00 C
ATOM 613 CG2 VAL A 40 102.535 85.243 53.067 1.00 0.00 C
ATOM 614 H VAL A 40 100.830 86.995 54.930 1.00 0.00 H
ATOM 615 HA VAL A 40 103.777 87.582 55.329 1.00 0.00 H
ATOM 616 HB VAL A 40 104.443 85.849 54.011 1.00 0.00 H
ATOM 617 HG11 VAL A 40 103.460 83.822 54.889 1.00 0.00 H
ATOM 618 HG12 VAL A 40 103.993 85.124 56.116 1.00 0.00 H
ATOM 619 HG13 VAL A 40 102.293 84.675 55.939 1.00 0.00 H
ATOM 620 HG21 VAL A 40 102.397 85.998 52.294 1.00 0.00 H
ATOM 621 HG22 VAL A 40 102.941 84.324 52.645 1.00 0.00 H
ATOM 622 HG23 VAL A 40 101.587 84.890 53.474 1.00 0.00 H
ATOM 623 N CYS A 41 101.930 89.036 53.540 1.00 0.00 N
ATOM 624 CA CYS A 41 101.781 90.112 52.612 1.00 0.00 C
ATOM 625 C CYS A 41 100.791 91.244 53.108 1.00 0.00 C
ATOM 626 O CYS A 41 99.548 90.961 53.144 1.00 0.00 O
ATOM 627 CB CYS A 41 101.511 89.512 51.236 1.00 0.00 C
ATOM 628 SG CYS A 41 101.336 90.872 49.976 1.00 0.00 S
ATOM 629 H CYS A 41 101.086 88.767 54.026 1.00 0.00 H
ATOM 630 HA CYS A 41 102.720 90.664 52.573 1.00 0.00 H
ATOM 631 HB2 CYS A 41 102.327 88.849 50.949 1.00 0.00 H
ATOM 632 HB3 CYS A 41 100.540 89.044 51.402 1.00 0.00 H
ATOM 633 HG CYS A 41 101.369 90.050 48.923 1.00 0.00 H
ATOM 634 N ARG A 42 101.351 92.419 53.463 1.00 0.00 N
ATOM 635 CA ARG A 42 100.410 93.491 53.868 1.00 0.00 C
ATOM 636 C ARG A 42 99.474 93.926 52.763 1.00 0.00 C
ATOM 637 O ARG A 42 98.462 94.524 53.121 1.00 0.00 O
ATOM 638 CB ARG A 42 101.312 94.661 54.286 1.00 0.00 C
ATOM 639 CG ARG A 42 100.658 95.821 55.060 1.00 0.00 C
ATOM 640 CD ARG A 42 99.921 95.396 56.366 1.00 0.00 C
ATOM 641 NE ARG A 42 100.802 94.675 57.290 1.00 0.00 N
ATOM 642 CZ ARG A 42 101.858 95.207 57.912 1.00 0.00 C
ATOM 643 NH1 ARG A 42 102.006 96.477 57.956 1.00 0.00 N1+
ATOM 644 NH2 ARG A 42 102.590 94.373 58.618 1.00 0.00 N
ATOM 645 H ARG A 42 102.346 92.548 53.585 1.00 0.00 H
ATOM 646 HA ARG A 42 99.896 93.092 54.742 1.00 0.00 H
ATOM 647 HB2 ARG A 42 102.112 94.288 54.927 1.00 0.00 H
ATOM 648 HB3 ARG A 42 101.700 95.117 53.376 1.00 0.00 H
ATOM 649 HG2 ARG A 42 101.500 96.436 55.380 1.00 0.00 H
ATOM 650 HG3 ARG A 42 99.881 96.303 54.467 1.00 0.00 H
ATOM 651 HD2 ARG A 42 99.457 96.279 56.806 1.00 0.00 H
ATOM 652 HD3 ARG A 42 99.110 94.713 56.113 1.00 0.00 H
ATOM 653 HE ARG A 42 100.676 93.682 57.424 1.00 0.00 H
ATOM 654 HH11 ARG A 42 101.264 97.008 57.522 1.00 0.00 H
ATOM 655 HH12 ARG A 42 102.879 96.903 58.233 1.00 0.00 H
ATOM 656 HH21 ARG A 42 102.342 93.395 58.599 1.00 0.00 H
ATOM 657 HH22 ARG A 42 103.335 94.731 59.199 1.00 0.00 H
ATOM 658 N ARG A 43 99.775 93.687 51.504 1.00 0.00 N
ATOM 659 CA ARG A 43 98.813 93.943 50.515 1.00 0.00 C
ATOM 660 C ARG A 43 97.662 92.931 50.627 1.00 0.00 C
ATOM 661 O ARG A 43 96.482 93.312 50.591 1.00 0.00 O
ATOM 662 CB ARG A 43 99.481 94.004 49.123 1.00 0.00 C
ATOM 663 CG ARG A 43 98.607 95.054 48.257 1.00 0.00 C
ATOM 664 CD ARG A 43 98.970 94.838 46.800 1.00 0.00 C
ATOM 665 NE ARG A 43 97.950 95.265 45.837 1.00 0.00 N
ATOM 666 CZ ARG A 43 98.112 95.208 44.553 1.00 0.00 C
ATOM 667 NH1 ARG A 43 99.148 94.631 43.976 1.00 0.00 N1+
ATOM 668 NH2 ARG A 43 97.254 95.767 43.801 1.00 0.00 N
ATOM 669 H ARG A 43 100.703 93.405 51.225 1.00 0.00 H
ATOM 670 HA ARG A 43 98.336 94.904 50.708 1.00 0.00 H
ATOM 671 HB2 ARG A 43 100.501 94.357 49.273 1.00 0.00 H
ATOM 672 HB3 ARG A 43 99.539 93.076 48.554 1.00 0.00 H
ATOM 673 HG2 ARG A 43 97.539 94.837 48.235 1.00 0.00 H
ATOM 674 HG3 ARG A 43 98.878 96.062 48.571 1.00 0.00 H
ATOM 675 HD2 ARG A 43 99.941 95.304 46.638 1.00 0.00 H
ATOM 676 HD3 ARG A 43 99.203 93.783 46.658 1.00 0.00 H
ATOM 677 HE ARG A 43 97.075 95.661 46.147 1.00 0.00 H
ATOM 678 HH11 ARG A 43 99.802 94.082 44.515 1.00 0.00 H
ATOM 679 HH12 ARG A 43 99.205 94.642 42.968 1.00 0.00 H
ATOM 680 HH21 ARG A 43 96.590 96.361 44.276 1.00 0.00 H
ATOM 681 HH22 ARG A 43 97.376 95.624 42.808 1.00 0.00 H
ATOM 682 N TRP A 44 97.894 91.641 50.670 1.00 0.00 N
ATOM 683 CA TRP A 44 96.959 90.555 50.817 1.00 0.00 C
ATOM 684 C TRP A 44 96.156 90.621 52.153 1.00 0.00 C
ATOM 685 O TRP A 44 94.973 90.279 52.153 1.00 0.00 O
ATOM 686 CB TRP A 44 97.738 89.249 50.638 1.00 0.00 C
ATOM 687 CG TRP A 44 98.435 88.875 49.345 1.00 0.00 C
ATOM 688 CD1 TRP A 44 98.182 89.425 48.134 1.00 0.00 C
ATOM 689 CD2 TRP A 44 99.230 87.702 49.102 1.00 0.00 C
ATOM 690 CE2 TRP A 44 99.441 87.580 47.657 1.00 0.00 C
ATOM 691 CE3 TRP A 44 99.983 86.726 49.929 1.00 0.00 C
ATOM 692 NE1 TRP A 44 98.736 88.628 47.105 1.00 0.00 N
ATOM 693 CZ2 TRP A 44 100.202 86.499 47.148 1.00 0.00 C
ATOM 694 CZ3 TRP A 44 100.869 85.836 49.389 1.00 0.00 C
ATOM 695 CH2 TRP A 44 100.850 85.577 48.006 1.00 0.00 C
ATOM 696 H TRP A 44 98.842 91.464 50.969 1.00 0.00 H
ATOM 697 HA TRP A 44 96.178 90.552 50.056 1.00 0.00 H
ATOM 698 HB2 TRP A 44 98.623 89.357 51.266 1.00 0.00 H
ATOM 699 HB3 TRP A 44 97.239 88.307 50.866 1.00 0.00 H
ATOM 700 HD1 TRP A 44 97.430 90.194 48.037 1.00 0.00 H
ATOM 701 HE1 TRP A 44 98.620 88.906 46.141 1.00 0.00 H
ATOM 702 HE3 TRP A 44 99.820 86.897 50.983 1.00 0.00 H
ATOM 703 HZ2 TRP A 44 100.341 86.413 46.081 1.00 0.00 H
ATOM 704 HZ3 TRP A 44 101.554 85.264 49.997 1.00 0.00 H
ATOM 705 HH2 TRP A 44 101.408 84.786 47.528 1.00 0.00 H
ATOM 706 N PHE A 45 96.723 91.108 53.241 1.00 0.00 N
ATOM 707 CA PHE A 45 95.940 91.512 54.363 1.00 0.00 C
ATOM 708 C PHE A 45 94.896 92.553 53.996 1.00 0.00 C
ATOM 709 O PHE A 45 93.705 92.402 54.292 1.00 0.00 O
ATOM 710 CB PHE A 45 96.893 91.978 55.412 1.00 0.00 C
ATOM 711 CG PHE A 45 96.172 92.598 56.568 1.00 0.00 C
ATOM 712 CD1 PHE A 45 95.957 94.024 56.501 1.00 0.00 C
ATOM 713 CD2 PHE A 45 95.924 91.962 57.811 1.00 0.00 C
ATOM 714 CE1 PHE A 45 95.230 94.720 57.523 1.00 0.00 C
ATOM 715 CE2 PHE A 45 95.360 92.619 58.834 1.00 0.00 C
ATOM 716 CZ PHE A 45 94.980 93.986 58.719 1.00 0.00 C
ATOM 717 H PHE A 45 97.729 91.177 53.280 1.00 0.00 H
ATOM 718 HA PHE A 45 95.373 90.653 54.723 1.00 0.00 H
ATOM 719 HB2 PHE A 45 97.404 91.076 55.747 1.00 0.00 H
ATOM 720 HB3 PHE A 45 97.609 92.765 55.174 1.00 0.00 H
ATOM 721 HD1 PHE A 45 96.235 94.435 55.542 1.00 0.00 H
ATOM 722 HD2 PHE A 45 96.169 90.910 57.847 1.00 0.00 H
ATOM 723 HE1 PHE A 45 94.828 95.695 57.295 1.00 0.00 H
ATOM 724 HE2 PHE A 45 95.128 92.137 59.772 1.00 0.00 H
ATOM 725 HZ PHE A 45 94.368 94.453 59.476 1.00 0.00 H
ATOM 726 N LYS A 46 95.232 93.583 53.234 1.00 0.00 N
ATOM 727 CA LYS A 46 94.253 94.655 52.837 1.00 0.00 C
ATOM 728 C LYS A 46 93.152 94.095 51.846 1.00 0.00 C
ATOM 729 O LYS A 46 91.992 94.375 52.018 1.00 0.00 O
ATOM 730 CB LYS A 46 95.039 95.866 52.308 1.00 0.00 C
ATOM 731 CG LYS A 46 94.134 96.895 51.584 1.00 0.00 C
ATOM 732 CD LYS A 46 93.148 97.652 52.357 1.00 0.00 C
ATOM 733 CE LYS A 46 92.236 98.542 51.459 1.00 0.00 C
ATOM 734 NZ LYS A 46 91.136 99.258 52.155 1.00 0.00 N1+
ATOM 735 H LYS A 46 96.225 93.731 53.121 1.00 0.00 H
ATOM 736 HA LYS A 46 93.731 94.993 53.732 1.00 0.00 H
ATOM 737 HB2 LYS A 46 95.725 96.319 53.024 1.00 0.00 H
ATOM 738 HB3 LYS A 46 95.626 95.441 51.494 1.00 0.00 H
ATOM 739 HG2 LYS A 46 94.781 97.414 50.876 1.00 0.00 H
ATOM 740 HG3 LYS A 46 93.526 96.382 50.838 1.00 0.00 H
ATOM 741 HD2 LYS A 46 92.530 96.991 52.965 1.00 0.00 H
ATOM 742 HD3 LYS A 46 93.758 98.258 53.027 1.00 0.00 H
ATOM 743 HE2 LYS A 46 92.887 99.327 51.072 1.00 0.00 H
ATOM 744 HE3 LYS A 46 91.795 97.908 50.690 1.00 0.00 H
ATOM 745 HZ1 LYS A 46 91.522 99.648 53.003 1.00 0.00 H
ATOM 746 HZ2 LYS A 46 90.819 99.963 51.506 1.00 0.00 H
ATOM 747 HZ3 LYS A 46 90.390 98.628 52.415 1.00 0.00 H
ATOM 748 N ILE A 47 93.510 93.326 50.762 1.00 0.00 N
ATOM 749 CA ILE A 47 92.553 92.798 49.823 1.00 0.00 C
ATOM 750 C ILE A 47 91.656 91.762 50.595 1.00 0.00 C
ATOM 751 O ILE A 47 90.508 91.657 50.320 1.00 0.00 O
ATOM 752 CB ILE A 47 93.238 92.194 48.659 1.00 0.00 C
ATOM 753 CG1 ILE A 47 93.844 93.361 47.803 1.00 0.00 C
ATOM 754 CG2 ILE A 47 92.363 91.331 47.686 1.00 0.00 C
ATOM 755 CD1 ILE A 47 94.972 92.983 46.808 1.00 0.00 C
ATOM 756 H ILE A 47 94.492 93.112 50.667 1.00 0.00 H
ATOM 757 HA ILE A 47 91.969 93.646 49.466 1.00 0.00 H
ATOM 758 HB ILE A 47 94.071 91.568 48.979 1.00 0.00 H
ATOM 759 HG12 ILE A 47 93.040 93.863 47.265 1.00 0.00 H
ATOM 760 HG13 ILE A 47 94.232 94.161 48.433 1.00 0.00 H
ATOM 761 HG21 ILE A 47 91.433 91.827 47.408 1.00 0.00 H
ATOM 762 HG22 ILE A 47 92.866 91.150 46.736 1.00 0.00 H
ATOM 763 HG23 ILE A 47 92.160 90.343 48.100 1.00 0.00 H
ATOM 764 HD11 ILE A 47 95.048 93.665 45.961 1.00 0.00 H
ATOM 765 HD12 ILE A 47 95.920 92.948 47.344 1.00 0.00 H
ATOM 766 HD13 ILE A 47 94.806 91.973 46.433 1.00 0.00 H
ATOM 767 N ASP A 48 92.249 90.950 51.558 1.00 0.00 N
ATOM 768 CA ASP A 48 91.525 90.039 52.477 1.00 0.00 C
ATOM 769 C ASP A 48 90.454 90.725 53.307 1.00 0.00 C
ATOM 770 O ASP A 48 89.236 90.506 53.254 1.00 0.00 O
ATOM 771 CB ASP A 48 92.476 89.168 53.355 1.00 0.00 C
ATOM 772 CG ASP A 48 91.708 88.097 54.141 1.00 0.00 C
ATOM 773 OD1 ASP A 48 90.880 87.378 53.580 1.00 0.00 O
ATOM 774 OD2 ASP A 48 91.834 88.082 55.402 1.00 0.00 O1-
ATOM 775 H ASP A 48 93.240 91.067 51.717 1.00 0.00 H
ATOM 776 HA ASP A 48 90.932 89.340 51.886 1.00 0.00 H
ATOM 777 HB2 ASP A 48 93.116 88.610 52.671 1.00 0.00 H
ATOM 778 HB3 ASP A 48 92.936 89.900 54.018 1.00 0.00 H
ATOM 779 N SER A 49 90.880 91.778 54.080 1.00 0.00 N
ATOM 780 CA SER A 49 89.949 92.709 54.736 1.00 0.00 C
ATOM 781 C SER A 49 88.726 93.235 53.955 1.00 0.00 C
ATOM 782 O SER A 49 87.608 93.145 54.431 1.00 0.00 O
ATOM 783 CB SER A 49 90.862 93.950 55.189 1.00 0.00 C
ATOM 784 OG SER A 49 91.909 93.697 56.014 1.00 0.00 O
ATOM 785 H SER A 49 91.862 91.981 53.961 1.00 0.00 H
ATOM 786 HA SER A 49 89.488 92.229 55.600 1.00 0.00 H
ATOM 787 HB2 SER A 49 91.361 94.184 54.249 1.00 0.00 H
ATOM 788 HB3 SER A 49 90.254 94.785 55.539 1.00 0.00 H
ATOM 789 HG SER A 49 92.644 93.361 55.496 1.00 0.00 H
ATOM 790 N GLU A 50 88.943 93.514 52.685 1.00 0.00 N
ATOM 791 CA GLU A 50 87.828 93.760 51.698 1.00 0.00 C
ATOM 792 C GLU A 50 87.204 92.552 50.966 1.00 0.00 C
ATOM 793 O GLU A 50 86.323 92.748 50.080 1.00 0.00 O
ATOM 794 CB GLU A 50 88.441 94.577 50.579 1.00 0.00 C
ATOM 795 CG GLU A 50 89.164 95.879 50.932 1.00 0.00 C
ATOM 796 CD GLU A 50 88.267 96.855 51.704 1.00 0.00 C
ATOM 797 OE1 GLU A 50 88.848 97.501 52.651 1.00 0.00 O
ATOM 798 OE2 GLU A 50 86.998 96.833 51.494 1.00 0.00 O1-
ATOM 799 H GLU A 50 89.876 93.640 52.318 1.00 0.00 H
ATOM 800 HA GLU A 50 86.996 94.270 52.183 1.00 0.00 H
ATOM 801 HB2 GLU A 50 89.119 93.880 50.087 1.00 0.00 H
ATOM 802 HB3 GLU A 50 87.650 94.896 49.900 1.00 0.00 H
ATOM 803 HG2 GLU A 50 90.091 95.610 51.437 1.00 0.00 H
ATOM 804 HG3 GLU A 50 89.431 96.294 49.960 1.00 0.00 H
ATOM 805 N THR A 51 87.652 91.261 51.106 1.00 0.00 N
ATOM 806 CA THR A 51 87.109 90.110 50.369 1.00 0.00 C
ATOM 807 C THR A 51 86.750 88.896 51.209 1.00 0.00 C
ATOM 808 O THR A 51 86.012 88.059 50.704 1.00 0.00 O
ATOM 809 CB THR A 51 87.911 89.715 49.104 1.00 0.00 C
ATOM 810 CG2 THR A 51 88.132 90.670 47.983 1.00 0.00 C
ATOM 811 OG1 THR A 51 89.201 89.323 49.626 1.00 0.00 O
ATOM 812 H THR A 51 88.445 91.152 51.723 1.00 0.00 H
ATOM 813 HA THR A 51 86.131 90.282 49.921 1.00 0.00 H
ATOM 814 HB THR A 51 87.527 88.805 48.643 1.00 0.00 H
ATOM 815 HG1 THR A 51 89.635 90.178 49.663 1.00 0.00 H
ATOM 816 HG21 THR A 51 88.496 90.125 47.112 1.00 0.00 H
ATOM 817 HG22 THR A 51 87.135 90.907 47.612 1.00 0.00 H
ATOM 818 HG23 THR A 51 88.623 91.605 48.255 1.00 0.00 H
ATOM 819 N ARG A 52 87.128 88.822 52.467 1.00 0.00 N
ATOM 820 CA ARG A 52 86.721 87.663 53.336 1.00 0.00 C
ATOM 821 C ARG A 52 85.246 87.481 53.256 1.00 0.00 C
ATOM 822 O ARG A 52 84.518 88.361 53.700 1.00 0.00 O
ATOM 823 CB ARG A 52 87.236 87.928 54.794 1.00 0.00 C
ATOM 824 CG ARG A 52 87.121 86.716 55.774 1.00 0.00 C
ATOM 825 CD ARG A 52 88.127 85.584 55.389 1.00 0.00 C
ATOM 826 NE ARG A 52 89.503 85.872 55.755 1.00 0.00 N
ATOM 827 CZ ARG A 52 90.231 85.537 56.855 1.00 0.00 C
ATOM 828 NH1 ARG A 52 89.773 84.731 57.739 1.00 0.00 N1+
ATOM 829 NH2 ARG A 52 91.425 86.008 56.972 1.00 0.00 N
ATOM 830 H ARG A 52 87.834 89.494 52.731 1.00 0.00 H
ATOM 831 HA ARG A 52 87.248 86.810 52.908 1.00 0.00 H
ATOM 832 HB2 ARG A 52 88.225 88.359 54.642 1.00 0.00 H
ATOM 833 HB3 ARG A 52 86.611 88.739 55.169 1.00 0.00 H
ATOM 834 HG2 ARG A 52 87.263 87.016 56.812 1.00 0.00 H
ATOM 835 HG3 ARG A 52 86.121 86.295 55.669 1.00 0.00 H
ATOM 836 HD2 ARG A 52 87.821 84.628 55.813 1.00 0.00 H
ATOM 837 HD3 ARG A 52 87.980 85.496 54.313 1.00 0.00 H
ATOM 838 HE ARG A 52 90.027 86.454 55.117 1.00 0.00 H
ATOM 839 HH11 ARG A 52 88.845 84.333 57.706 1.00 0.00 H
ATOM 840 HH12 ARG A 52 90.260 84.381 58.552 1.00 0.00 H
ATOM 841 HH21 ARG A 52 91.781 86.762 56.402 1.00 0.00 H
ATOM 842 HH22 ARG A 52 92.065 85.589 57.631 1.00 0.00 H
ATOM 843 N GLU A 53 84.777 86.338 52.775 1.00 0.00 N
ATOM 844 CA GLU A 53 83.355 86.008 52.680 1.00 0.00 C
ATOM 845 C GLU A 53 82.664 85.635 54.016 1.00 0.00 C
ATOM 846 O GLU A 53 81.600 86.123 54.395 1.00 0.00 O
ATOM 847 CB GLU A 53 83.123 84.924 51.537 1.00 0.00 C
ATOM 848 CG GLU A 53 81.717 84.478 51.246 1.00 0.00 C
ATOM 849 CD GLU A 53 81.878 83.471 50.093 1.00 0.00 C
ATOM 850 OE1 GLU A 53 82.101 83.857 48.954 1.00 0.00 O
ATOM 851 OE2 GLU A 53 81.598 82.275 50.372 1.00 0.00 O1-
ATOM 852 H GLU A 53 85.511 85.864 52.267 1.00 0.00 H
ATOM 853 HA GLU A 53 82.859 86.946 52.429 1.00 0.00 H
ATOM 854 HB2 GLU A 53 83.475 85.404 50.624 1.00 0.00 H
ATOM 855 HB3 GLU A 53 83.802 84.098 51.746 1.00 0.00 H
ATOM 856 HG2 GLU A 53 81.369 84.036 52.179 1.00 0.00 H
ATOM 857 HG3 GLU A 53 81.125 85.359 50.997 1.00 0.00 H
ATOM 858 N HIE A 54 83.269 84.680 54.752 1.00 0.00 N
ATOM 859 CA HIE A 54 82.654 84.094 55.916 1.00 0.00 C
ATOM 860 C HIE A 54 83.676 83.902 56.996 1.00 0.00 C
ATOM 861 O HIE A 54 84.821 83.552 56.686 1.00 0.00 O
ATOM 862 CB HIE A 54 81.942 82.730 55.604 1.00 0.00 C
ATOM 863 CG HIE A 54 82.756 81.594 55.070 1.00 0.00 C
ATOM 864 CD2 HIE A 54 83.061 81.240 53.765 1.00 0.00 C
ATOM 865 ND1 HIE A 54 83.564 80.722 55.921 1.00 0.00 N
ATOM 866 CE1 HIE A 54 84.252 79.887 55.079 1.00 0.00 C
ATOM 867 NE2 HIE A 54 83.934 80.140 53.826 1.00 0.00 N
ATOM 868 H HIE A 54 84.222 84.487 54.481 1.00 0.00 H
ATOM 869 HA HIE A 54 81.862 84.696 56.362 1.00 0.00 H
ATOM 870 HB2 HIE A 54 81.542 82.315 56.529 1.00 0.00 H
ATOM 871 HB3 HIE A 54 81.062 82.775 54.963 1.00 0.00 H
ATOM 872 HD2 HIE A 54 82.879 81.779 52.847 1.00 0.00 H
ATOM 873 HE1 HIE A 54 84.949 79.100 55.326 1.00 0.00 H
ATOM 874 HE2 HIE A 54 84.153 79.549 53.037 1.00 0.00 H
ATOM 875 N VAL A 55 83.307 83.988 58.259 1.00 0.00 N
ATOM 876 CA VAL A 55 84.105 83.692 59.451 1.00 0.00 C
ATOM 877 C VAL A 55 83.193 83.009 60.487 1.00 0.00 C
ATOM 878 O VAL A 55 81.947 83.083 60.571 1.00 0.00 O
ATOM 879 CB VAL A 55 84.765 84.937 60.009 1.00 0.00 C
ATOM 880 CG1 VAL A 55 83.705 86.008 60.545 1.00 0.00 C
ATOM 881 CG2 VAL A 55 85.861 84.682 61.032 1.00 0.00 C
ATOM 882 H VAL A 55 82.314 84.014 58.437 1.00 0.00 H
ATOM 883 HA VAL A 55 84.815 82.945 59.096 1.00 0.00 H
ATOM 884 HB VAL A 55 85.319 85.322 59.152 1.00 0.00 H
ATOM 885 HG11 VAL A 55 82.944 85.975 59.766 1.00 0.00 H
ATOM 886 HG12 VAL A 55 83.284 85.676 61.494 1.00 0.00 H
ATOM 887 HG13 VAL A 55 84.229 86.964 60.562 1.00 0.00 H
ATOM 888 HG21 VAL A 55 85.369 84.411 61.966 1.00 0.00 H
ATOM 889 HG22 VAL A 55 86.420 83.750 60.944 1.00 0.00 H
ATOM 890 HG23 VAL A 55 86.584 85.496 61.096 1.00 0.00 H
ATOM 891 N THR A 56 83.862 82.092 61.223 1.00 0.00 N
ATOM 892 CA THR A 56 83.301 81.426 62.360 1.00 0.00 C
ATOM 893 C THR A 56 83.875 81.981 63.713 1.00 0.00 C
ATOM 894 O THR A 56 85.019 82.361 63.800 1.00 0.00 O
ATOM 895 CB THR A 56 83.581 79.930 62.222 1.00 0.00 C
ATOM 896 CG2 THR A 56 82.990 78.964 63.268 1.00 0.00 C
ATOM 897 OG1 THR A 56 82.898 79.536 61.041 1.00 0.00 O
ATOM 898 H THR A 56 84.859 82.026 61.072 1.00 0.00 H
ATOM 899 HA THR A 56 82.213 81.486 62.345 1.00 0.00 H
ATOM 900 HB THR A 56 84.657 79.881 62.058 1.00 0.00 H
ATOM 901 HG1 THR A 56 83.395 79.985 60.354 1.00 0.00 H
ATOM 902 HG21 THR A 56 82.027 79.425 63.490 1.00 0.00 H
ATOM 903 HG22 THR A 56 82.890 77.923 62.960 1.00 0.00 H
ATOM 904 HG23 THR A 56 83.484 79.090 64.231 1.00 0.00 H
ATOM 905 N MET A 57 83.107 82.109 64.780 1.00 0.00 N
ATOM 906 CA MET A 57 83.475 82.463 66.151 1.00 0.00 C
ATOM 907 C MET A 57 82.843 81.443 67.113 1.00 0.00 C
ATOM 908 O MET A 57 81.654 81.393 67.323 1.00 0.00 O
ATOM 909 CB MET A 57 82.966 83.794 66.578 1.00 0.00 C
ATOM 910 CG MET A 57 83.431 84.890 65.708 1.00 0.00 C
ATOM 911 SD MET A 57 83.049 86.533 66.339 1.00 0.00 S
ATOM 912 CE MET A 57 84.081 86.464 67.906 1.00 0.00 C
ATOM 913 H MET A 57 82.121 81.966 64.611 1.00 0.00 H
ATOM 914 HA MET A 57 84.548 82.433 66.345 1.00 0.00 H
ATOM 915 HB2 MET A 57 81.884 83.809 66.453 1.00 0.00 H
ATOM 916 HB3 MET A 57 83.187 84.107 67.598 1.00 0.00 H
ATOM 917 HG2 MET A 57 84.516 84.840 65.609 1.00 0.00 H
ATOM 918 HG3 MET A 57 83.004 84.842 64.706 1.00 0.00 H
ATOM 919 HE1 MET A 57 84.283 87.503 68.165 1.00 0.00 H
ATOM 920 HE2 MET A 57 83.466 85.975 68.662 1.00 0.00 H
ATOM 921 HE3 MET A 57 85.021 85.945 67.724 1.00 0.00 H
ATOM 922 N ALA A 58 83.728 80.680 67.750 1.00 0.00 N
ATOM 923 CA ALA A 58 83.351 79.560 68.623 1.00 0.00 C
ATOM 924 C ALA A 58 82.807 79.957 69.954 1.00 0.00 C
ATOM 925 O ALA A 58 82.074 79.226 70.692 1.00 0.00 O
ATOM 926 CB ALA A 58 84.562 78.665 68.893 1.00 0.00 C
ATOM 927 H ALA A 58 84.723 80.789 67.613 1.00 0.00 H
ATOM 928 HA ALA A 58 82.608 78.974 68.083 1.00 0.00 H
ATOM 929 HB1 ALA A 58 84.967 78.294 67.952 1.00 0.00 H
ATOM 930 HB2 ALA A 58 85.230 79.338 69.431 1.00 0.00 H
ATOM 931 HB3 ALA A 58 84.313 77.806 69.516 1.00 0.00 H
ATOM 932 N LEU A 59 83.243 81.148 70.401 1.00 0.00 N
ATOM 933 CA LEU A 59 82.721 81.703 71.555 1.00 0.00 C
ATOM 934 C LEU A 59 82.789 83.250 71.426 1.00 0.00 C
ATOM 935 O LEU A 59 83.789 83.895 71.192 1.00 0.00 O
ATOM 936 CB LEU A 59 83.635 81.106 72.742 1.00 0.00 C
ATOM 937 CG LEU A 59 83.538 81.934 74.098 1.00 0.00 C
ATOM 938 CD1 LEU A 59 82.168 82.081 74.626 1.00 0.00 C
ATOM 939 CD2 LEU A 59 84.510 81.231 75.108 1.00 0.00 C
ATOM 940 H LEU A 59 83.908 81.634 69.817 1.00 0.00 H
ATOM 941 HA LEU A 59 81.700 81.332 71.636 1.00 0.00 H
ATOM 942 HB2 LEU A 59 83.413 80.071 73.002 1.00 0.00 H
ATOM 943 HB3 LEU A 59 84.688 81.152 72.466 1.00 0.00 H
ATOM 944 HG LEU A 59 83.899 82.918 73.801 1.00 0.00 H
ATOM 945 HD11 LEU A 59 81.711 81.138 74.925 1.00 0.00 H
ATOM 946 HD12 LEU A 59 82.182 82.807 75.439 1.00 0.00 H
ATOM 947 HD13 LEU A 59 81.531 82.424 73.810 1.00 0.00 H
ATOM 948 HD21 LEU A 59 85.435 80.925 74.619 1.00 0.00 H
ATOM 949 HD22 LEU A 59 84.800 81.806 75.987 1.00 0.00 H
ATOM 950 HD23 LEU A 59 83.976 80.322 75.387 1.00 0.00 H
ATOM 951 N CYS A 60 81.638 83.942 71.572 1.00 0.00 N
ATOM 952 CA CYS A 60 81.509 85.360 71.350 1.00 0.00 C
ATOM 953 C CYS A 60 82.477 86.268 72.158 1.00 0.00 C
ATOM 954 O CYS A 60 82.746 87.397 71.660 1.00 0.00 O
ATOM 955 CB CYS A 60 80.009 85.648 71.635 1.00 0.00 C
ATOM 956 SG CYS A 60 79.456 85.075 73.282 1.00 0.00 S
ATOM 957 H CYS A 60 80.765 83.478 71.780 1.00 0.00 H
ATOM 958 HA CYS A 60 81.797 85.586 70.323 1.00 0.00 H
ATOM 959 HB2 CYS A 60 79.929 86.732 71.552 1.00 0.00 H
ATOM 960 HB3 CYS A 60 79.449 85.131 70.856 1.00 0.00 H
ATOM 961 HG CYS A 60 79.228 86.286 73.799 1.00 0.00 H
ATOM 962 N TYR A 61 83.047 85.854 73.309 1.00 0.00 N
ATOM 963 CA TYR A 61 84.004 86.651 74.159 1.00 0.00 C
ATOM 964 C TYR A 61 85.515 86.301 73.812 1.00 0.00 C
ATOM 965 O TYR A 61 86.436 86.636 74.563 1.00 0.00 O
ATOM 966 CB TYR A 61 83.575 86.361 75.652 1.00 0.00 C
ATOM 967 CG TYR A 61 82.173 86.980 75.941 1.00 0.00 C
ATOM 968 CD1 TYR A 61 81.762 88.352 75.748 1.00 0.00 C
ATOM 969 CD2 TYR A 61 81.192 86.102 76.525 1.00 0.00 C
ATOM 970 CE1 TYR A 61 80.525 88.851 76.170 1.00 0.00 C
ATOM 971 CE2 TYR A 61 79.856 86.578 76.688 1.00 0.00 C
ATOM 972 CZ TYR A 61 79.558 87.943 76.663 1.00 0.00 C
ATOM 973 OH TYR A 61 78.250 88.316 76.937 1.00 0.00 O
ATOM 974 H TYR A 61 82.753 84.967 73.692 1.00 0.00 H
ATOM 975 HA TYR A 61 83.885 87.703 73.899 1.00 0.00 H
ATOM 976 HB2 TYR A 61 83.592 85.301 75.907 1.00 0.00 H
ATOM 977 HB3 TYR A 61 84.251 86.830 76.366 1.00 0.00 H
ATOM 978 HD1 TYR A 61 82.530 89.043 75.431 1.00 0.00 H
ATOM 979 HD2 TYR A 61 81.526 85.105 76.772 1.00 0.00 H
ATOM 980 HE1 TYR A 61 80.308 89.908 76.223 1.00 0.00 H
ATOM 981 HE2 TYR A 61 79.116 85.846 76.974 1.00 0.00 H
ATOM 982 HH TYR A 61 78.300 89.119 77.462 1.00 0.00 H
ATOM 983 N THR A 62 85.757 85.456 72.701 1.00 0.00 N
ATOM 984 CA THR A 62 87.158 85.274 72.153 1.00 0.00 C
ATOM 985 C THR A 62 87.736 86.414 71.357 1.00 0.00 C
ATOM 986 O THR A 62 88.930 86.407 71.192 1.00 0.00 O
ATOM 987 CB THR A 62 87.247 84.031 71.152 1.00 0.00 C
ATOM 988 CG2 THR A 62 87.149 82.632 71.792 1.00 0.00 C
ATOM 989 OG1 THR A 62 86.278 84.066 70.115 1.00 0.00 O
ATOM 990 H THR A 62 84.910 85.212 72.207 1.00 0.00 H
ATOM 991 HA THR A 62 87.856 85.134 72.978 1.00 0.00 H
ATOM 992 HB THR A 62 88.218 84.054 70.656 1.00 0.00 H
ATOM 993 HG1 THR A 62 85.495 83.822 70.615 1.00 0.00 H
ATOM 994 HG21 THR A 62 87.158 81.863 71.020 1.00 0.00 H
ATOM 995 HG22 THR A 62 87.974 82.531 72.497 1.00 0.00 H
ATOM 996 HG23 THR A 62 86.259 82.618 72.421 1.00 0.00 H
ATOM 997 N ALA A 63 86.883 87.327 70.903 1.00 0.00 N
ATOM 998 CA ALA A 63 87.187 88.539 70.192 1.00 0.00 C
ATOM 999 C ALA A 63 85.997 89.513 70.281 1.00 0.00 C
ATOM 1000 O ALA A 63 84.900 89.017 70.237 1.00 0.00 O
ATOM 1001 CB ALA A 63 87.398 88.166 68.740 1.00 0.00 C
ATOM 1002 H ALA A 63 85.906 87.074 70.944 1.00 0.00 H
ATOM 1003 HA ALA A 63 88.040 89.001 70.689 1.00 0.00 H
ATOM 1004 HB1 ALA A 63 86.912 87.299 68.293 1.00 0.00 H
ATOM 1005 HB2 ALA A 63 87.200 89.014 68.084 1.00 0.00 H
ATOM 1006 HB3 ALA A 63 88.471 88.081 68.568 1.00 0.00 H
ATOM 1007 N THR A 64 86.194 90.867 70.267 1.00 0.00 N
ATOM 1008 CA THR A 64 85.080 91.781 70.203 1.00 0.00 C
ATOM 1009 C THR A 64 84.526 92.022 68.753 1.00 0.00 C
ATOM 1010 O THR A 64 85.207 91.769 67.764 1.00 0.00 O
ATOM 1011 CB THR A 64 85.491 93.185 70.784 1.00 0.00 C
ATOM 1012 CG2 THR A 64 86.008 92.903 72.202 1.00 0.00 C
ATOM 1013 OG1 THR A 64 86.474 93.819 69.911 1.00 0.00 O
ATOM 1014 H THR A 64 87.107 91.295 70.204 1.00 0.00 H
ATOM 1015 HA THR A 64 84.229 91.403 70.769 1.00 0.00 H
ATOM 1016 HB THR A 64 84.621 93.839 70.846 1.00 0.00 H
ATOM 1017 HG1 THR A 64 86.459 94.694 70.306 1.00 0.00 H
ATOM 1018 HG21 THR A 64 87.098 92.933 72.226 1.00 0.00 H
ATOM 1019 HG22 THR A 64 85.500 93.585 72.883 1.00 0.00 H
ATOM 1020 HG23 THR A 64 85.663 91.940 72.580 1.00 0.00 H
ATOM 1021 N PRO A 65 83.258 92.514 68.649 1.00 0.00 N
ATOM 1022 CA PRO A 65 82.576 93.026 67.512 1.00 0.00 C
ATOM 1023 C PRO A 65 83.441 93.975 66.639 1.00 0.00 C
ATOM 1024 O PRO A 65 83.591 93.797 65.448 1.00 0.00 O
ATOM 1025 CB PRO A 65 81.376 93.708 68.092 1.00 0.00 C
ATOM 1026 CG PRO A 65 80.906 92.884 69.267 1.00 0.00 C
ATOM 1027 CD PRO A 65 82.285 92.456 69.744 1.00 0.00 C
ATOM 1028 HA PRO A 65 82.230 92.132 66.994 1.00 0.00 H
ATOM 1029 HB2 PRO A 65 81.606 94.735 68.375 1.00 0.00 H
ATOM 1030 HB3 PRO A 65 80.521 93.851 67.432 1.00 0.00 H
ATOM 1031 HG2 PRO A 65 80.344 93.529 69.942 1.00 0.00 H
ATOM 1032 HG3 PRO A 65 80.380 91.959 69.034 1.00 0.00 H
ATOM 1033 HD2 PRO A 65 82.663 93.038 70.584 1.00 0.00 H
ATOM 1034 HD3 PRO A 65 82.194 91.436 70.117 1.00 0.00 H
ATOM 1035 N ASP A 66 84.061 94.992 67.303 1.00 0.00 N
ATOM 1036 CA ASP A 66 84.839 96.060 66.636 1.00 0.00 C
ATOM 1037 C ASP A 66 86.129 95.488 66.110 1.00 0.00 C
ATOM 1038 O ASP A 66 86.658 95.815 65.039 1.00 0.00 O
ATOM 1039 CB ASP A 66 85.093 97.266 67.507 1.00 0.00 C
ATOM 1040 CG ASP A 66 86.107 96.950 68.566 1.00 0.00 C
ATOM 1041 OD1 ASP A 66 87.278 97.134 68.259 1.00 0.00 O
ATOM 1042 OD2 ASP A 66 85.845 96.591 69.715 1.00 0.00 O1-
ATOM 1043 H ASP A 66 83.914 95.136 68.292 1.00 0.00 H
ATOM 1044 HA ASP A 66 84.399 96.516 65.748 1.00 0.00 H
ATOM 1045 HB2 ASP A 66 85.429 98.129 66.932 1.00 0.00 H
ATOM 1046 HB3 ASP A 66 84.149 97.586 67.947 1.00 0.00 H
ATOM 1047 N ARG A 67 86.667 94.505 66.807 1.00 0.00 N
ATOM 1048 CA ARG A 67 87.956 93.885 66.362 1.00 0.00 C
ATOM 1049 C ARG A 67 87.760 93.161 65.039 1.00 0.00 C
ATOM 1050 O ARG A 67 88.549 93.333 64.097 1.00 0.00 O
ATOM 1051 CB ARG A 67 88.440 92.997 67.485 1.00 0.00 C
ATOM 1052 CG ARG A 67 89.659 92.159 67.302 1.00 0.00 C
ATOM 1053 CD ARG A 67 90.856 93.082 67.225 1.00 0.00 C
ATOM 1054 NE ARG A 67 92.121 92.366 67.328 1.00 0.00 N
ATOM 1055 CZ ARG A 67 92.925 92.379 68.367 1.00 0.00 C
ATOM 1056 NH1 ARG A 67 92.516 92.734 69.572 1.00 0.00 N1+
ATOM 1057 NH2 ARG A 67 94.066 91.930 68.151 1.00 0.00 N
ATOM 1058 H ARG A 67 86.237 94.075 67.614 1.00 0.00 H
ATOM 1059 HA ARG A 67 88.637 94.692 66.092 1.00 0.00 H
ATOM 1060 HB2 ARG A 67 88.515 93.628 68.371 1.00 0.00 H
ATOM 1061 HB3 ARG A 67 87.580 92.403 67.794 1.00 0.00 H
ATOM 1062 HG2 ARG A 67 89.809 91.611 68.232 1.00 0.00 H
ATOM 1063 HG3 ARG A 67 89.605 91.553 66.398 1.00 0.00 H
ATOM 1064 HD2 ARG A 67 90.748 93.656 66.304 1.00 0.00 H
ATOM 1065 HD3 ARG A 67 90.819 93.827 68.020 1.00 0.00 H
ATOM 1066 HE ARG A 67 92.393 92.051 66.408 1.00 0.00 H
ATOM 1067 HH11 ARG A 67 91.616 93.187 69.650 1.00 0.00 H
ATOM 1068 HH12 ARG A 67 93.220 92.864 70.284 1.00 0.00 H
ATOM 1069 HH21 ARG A 67 94.284 91.510 67.259 1.00 0.00 H
ATOM 1070 HH22 ARG A 67 94.669 91.913 68.961 1.00 0.00 H
ATOM 1071 N LEU A 68 86.728 92.302 64.884 1.00 0.00 N
ATOM 1072 CA LEU A 68 86.333 91.678 63.622 1.00 0.00 C
ATOM 1073 C LEU A 68 86.032 92.753 62.482 1.00 0.00 C
ATOM 1074 O LEU A 68 86.496 92.626 61.377 1.00 0.00 O
ATOM 1075 CB LEU A 68 85.028 90.913 63.951 1.00 0.00 C
ATOM 1076 CG LEU A 68 84.400 90.000 62.851 1.00 0.00 C
ATOM 1077 CD1 LEU A 68 84.156 88.590 63.386 1.00 0.00 C
ATOM 1078 CD2 LEU A 68 83.106 90.551 62.416 1.00 0.00 C
ATOM 1079 H LEU A 68 86.045 92.207 65.623 1.00 0.00 H
ATOM 1080 HA LEU A 68 87.220 91.138 63.290 1.00 0.00 H
ATOM 1081 HB2 LEU A 68 85.381 90.264 64.752 1.00 0.00 H
ATOM 1082 HB3 LEU A 68 84.302 91.575 64.422 1.00 0.00 H
ATOM 1083 HG LEU A 68 84.982 89.969 61.930 1.00 0.00 H
ATOM 1084 HD11 LEU A 68 85.036 88.146 63.851 1.00 0.00 H
ATOM 1085 HD12 LEU A 68 83.400 88.602 64.170 1.00 0.00 H
ATOM 1086 HD13 LEU A 68 83.753 87.971 62.584 1.00 0.00 H
ATOM 1087 HD21 LEU A 68 82.637 90.010 61.594 1.00 0.00 H
ATOM 1088 HD22 LEU A 68 82.428 90.762 63.243 1.00 0.00 H
ATOM 1089 HD23 LEU A 68 83.182 91.541 61.967 1.00 0.00 H
ATOM 1090 N SER A 69 85.152 93.745 62.811 1.00 0.00 N
ATOM 1091 CA SER A 69 84.645 94.782 61.897 1.00 0.00 C
ATOM 1092 C SER A 69 85.726 95.785 61.423 1.00 0.00 C
ATOM 1093 O SER A 69 85.681 96.292 60.300 1.00 0.00 O
ATOM 1094 CB SER A 69 83.415 95.462 62.525 1.00 0.00 C
ATOM 1095 OG SER A 69 83.864 96.630 63.224 1.00 0.00 O
ATOM 1096 H SER A 69 84.744 93.708 63.734 1.00 0.00 H
ATOM 1097 HA SER A 69 84.303 94.264 61.001 1.00 0.00 H
ATOM 1098 HB2 SER A 69 82.782 95.814 61.710 1.00 0.00 H
ATOM 1099 HB3 SER A 69 82.866 94.748 63.139 1.00 0.00 H
ATOM 1100 HG SER A 69 83.101 96.792 63.783 1.00 0.00 H
ATOM 1101 N ARG A 70 86.753 96.148 62.234 1.00 0.00 N
ATOM 1102 CA ARG A 70 88.036 96.697 61.678 1.00 0.00 C
ATOM 1103 C ARG A 70 88.934 95.747 60.878 1.00 0.00 C
ATOM 1104 O ARG A 70 89.776 96.222 60.121 1.00 0.00 O
ATOM 1105 CB ARG A 70 88.822 97.176 62.910 1.00 0.00 C
ATOM 1106 CG ARG A 70 88.122 98.453 63.572 1.00 0.00 C
ATOM 1107 CD ARG A 70 88.923 99.085 64.653 1.00 0.00 C
ATOM 1108 NE ARG A 70 88.893 98.122 65.776 1.00 0.00 N
ATOM 1109 CZ ARG A 70 89.993 97.570 66.294 1.00 0.00 C
ATOM 1110 NH1 ARG A 70 91.236 97.843 65.901 1.00 0.00 N1+
ATOM 1111 NH2 ARG A 70 89.887 96.674 67.249 1.00 0.00 N
ATOM 1112 H ARG A 70 86.789 95.749 63.161 1.00 0.00 H
ATOM 1113 HA ARG A 70 87.948 97.518 60.965 1.00 0.00 H
ATOM 1114 HB2 ARG A 70 88.901 96.342 63.607 1.00 0.00 H
ATOM 1115 HB3 ARG A 70 89.821 97.436 62.562 1.00 0.00 H
ATOM 1116 HG2 ARG A 70 88.005 99.143 62.735 1.00 0.00 H
ATOM 1117 HG3 ARG A 70 87.178 98.160 64.030 1.00 0.00 H
ATOM 1118 HD2 ARG A 70 89.863 99.285 64.139 1.00 0.00 H
ATOM 1119 HD3 ARG A 70 88.420 100.025 64.883 1.00 0.00 H
ATOM 1120 HE ARG A 70 88.015 97.860 66.201 1.00 0.00 H
ATOM 1121 HH11 ARG A 70 91.348 98.313 65.013 1.00 0.00 H
ATOM 1122 HH12 ARG A 70 92.050 97.371 66.267 1.00 0.00 H
ATOM 1123 HH21 ARG A 70 88.973 96.491 67.639 1.00 0.00 H
ATOM 1124 HH22 ARG A 70 90.642 96.169 67.690 1.00 0.00 H
ATOM 1125 N ARG A 71 88.664 94.463 60.960 1.00 0.00 N
ATOM 1126 CA ARG A 71 89.475 93.456 60.198 1.00 0.00 C
ATOM 1127 C ARG A 71 88.795 92.872 58.992 1.00 0.00 C
ATOM 1128 O ARG A 71 89.510 92.472 58.103 1.00 0.00 O
ATOM 1129 CB ARG A 71 89.962 92.408 61.233 1.00 0.00 C
ATOM 1130 CG ARG A 71 90.773 91.230 60.651 1.00 0.00 C
ATOM 1131 CD ARG A 71 91.950 91.695 59.897 1.00 0.00 C
ATOM 1132 NE ARG A 71 92.621 90.522 59.283 1.00 0.00 N
ATOM 1133 CZ ARG A 71 92.511 90.141 58.047 1.00 0.00 C
ATOM 1134 NH1 ARG A 71 91.755 90.864 57.248 1.00 0.00 N1+
ATOM 1135 NH2 ARG A 71 93.100 89.068 57.645 1.00 0.00 N
ATOM 1136 H ARG A 71 87.920 94.196 61.589 1.00 0.00 H
ATOM 1137 HA ARG A 71 90.333 93.939 59.730 1.00 0.00 H
ATOM 1138 HB2 ARG A 71 90.605 92.953 61.925 1.00 0.00 H
ATOM 1139 HB3 ARG A 71 89.231 91.996 61.928 1.00 0.00 H
ATOM 1140 HG2 ARG A 71 91.201 90.753 61.533 1.00 0.00 H
ATOM 1141 HG3 ARG A 71 90.145 90.586 60.034 1.00 0.00 H
ATOM 1142 HD2 ARG A 71 91.742 92.553 59.258 1.00 0.00 H
ATOM 1143 HD3 ARG A 71 92.629 92.134 60.628 1.00 0.00 H
ATOM 1144 HE ARG A 71 93.214 89.923 59.839 1.00 0.00 H
ATOM 1145 HH11 ARG A 71 91.168 91.574 57.664 1.00 0.00 H
ATOM 1146 HH12 ARG A 71 91.492 90.504 56.342 1.00 0.00 H
ATOM 1147 HH21 ARG A 71 93.617 88.406 58.206 1.00 0.00 H
ATOM 1148 HH22 ARG A 71 92.723 88.769 56.757 1.00 0.00 H
ATOM 1149 N PHE A 72 87.471 92.848 58.978 1.00 0.00 N
ATOM 1150 CA PHE A 72 86.513 92.343 58.016 1.00 0.00 C
ATOM 1151 C PHE A 72 85.252 93.305 57.881 1.00 0.00 C
ATOM 1152 O PHE A 72 84.073 92.901 57.991 1.00 0.00 O
ATOM 1153 CB PHE A 72 86.169 90.938 58.343 1.00 0.00 C
ATOM 1154 CG PHE A 72 87.321 89.842 58.423 1.00 0.00 C
ATOM 1155 CD1 PHE A 72 88.294 89.692 57.324 1.00 0.00 C
ATOM 1156 CD2 PHE A 72 87.426 89.065 59.573 1.00 0.00 C
ATOM 1157 CE1 PHE A 72 89.354 88.769 57.562 1.00 0.00 C
ATOM 1158 CE2 PHE A 72 88.462 88.196 59.777 1.00 0.00 C
ATOM 1159 CZ PHE A 72 89.423 88.031 58.747 1.00 0.00 C
ATOM 1160 H PHE A 72 87.072 93.189 59.841 1.00 0.00 H
ATOM 1161 HA PHE A 72 86.943 92.359 57.015 1.00 0.00 H
ATOM 1162 HB2 PHE A 72 85.686 90.772 59.306 1.00 0.00 H
ATOM 1163 HB3 PHE A 72 85.430 90.653 57.594 1.00 0.00 H
ATOM 1164 HD1 PHE A 72 88.335 90.310 56.439 1.00 0.00 H
ATOM 1165 HD2 PHE A 72 86.778 89.336 60.393 1.00 0.00 H
ATOM 1166 HE1 PHE A 72 90.115 88.734 56.797 1.00 0.00 H
ATOM 1167 HE2 PHE A 72 88.482 87.643 60.704 1.00 0.00 H
ATOM 1168 HZ PHE A 72 90.304 87.441 58.953 1.00 0.00 H
ATOM 1169 N PRO A 73 85.489 94.579 57.437 1.00 0.00 N
ATOM 1170 CA PRO A 73 84.407 95.423 57.041 1.00 0.00 C
ATOM 1171 C PRO A 73 83.519 94.808 55.998 1.00 0.00 C
ATOM 1172 O PRO A 73 82.289 94.963 55.980 1.00 0.00 O
ATOM 1173 CB PRO A 73 85.089 96.631 56.593 1.00 0.00 C
ATOM 1174 CG PRO A 73 86.424 96.152 55.967 1.00 0.00 C
ATOM 1175 CD PRO A 73 86.778 95.149 56.983 1.00 0.00 C
ATOM 1176 HA PRO A 73 83.778 95.629 57.907 1.00 0.00 H
ATOM 1177 HB2 PRO A 73 84.420 97.162 55.916 1.00 0.00 H
ATOM 1178 HB3 PRO A 73 85.415 97.339 57.355 1.00 0.00 H
ATOM 1179 HG2 PRO A 73 86.068 95.716 55.033 1.00 0.00 H
ATOM 1180 HG3 PRO A 73 87.148 96.949 55.797 1.00 0.00 H
ATOM 1181 HD2 PRO A 73 87.413 94.414 56.488 1.00 0.00 H
ATOM 1182 HD3 PRO A 73 87.329 95.605 57.805 1.00 0.00 H
ATOM 1183 N ASN A 74 83.992 94.008 54.974 1.00 0.00 N
ATOM 1184 CA ASN A 74 83.095 93.644 53.854 1.00 0.00 C
ATOM 1185 C ASN A 74 82.313 92.365 54.055 1.00 0.00 C
ATOM 1186 O ASN A 74 81.895 91.734 53.087 1.00 0.00 O
ATOM 1187 CB ASN A 74 84.002 93.726 52.548 1.00 0.00 C
ATOM 1188 CG ASN A 74 83.077 93.665 51.350 1.00 0.00 C
ATOM 1189 ND2 ASN A 74 83.683 93.283 50.194 1.00 0.00 N
ATOM 1190 OD1 ASN A 74 81.885 93.905 51.401 1.00 0.00 O
ATOM 1191 H ASN A 74 84.845 93.501 55.161 1.00 0.00 H
ATOM 1192 HA ASN A 74 82.238 94.311 53.760 1.00 0.00 H
ATOM 1193 HB2 ASN A 74 84.614 94.628 52.554 1.00 0.00 H
ATOM 1194 HB3 ASN A 74 84.636 92.840 52.595 1.00 0.00 H
ATOM 1195 HD21 ASN A 74 83.136 93.327 49.346 1.00 0.00 H
ATOM 1196 HD22 ASN A 74 84.685 93.164 50.229 1.00 0.00 H
ATOM 1197 N LEU A 75 82.383 91.804 55.311 1.00 0.00 N
ATOM 1198 CA LEU A 75 81.954 90.402 55.656 1.00 0.00 C
ATOM 1199 C LEU A 75 80.531 90.061 55.202 1.00 0.00 C
ATOM 1200 O LEU A 75 79.579 90.804 55.490 1.00 0.00 O
ATOM 1201 CB LEU A 75 82.022 90.194 57.213 1.00 0.00 C
ATOM 1202 CG LEU A 75 81.870 88.711 57.640 1.00 0.00 C
ATOM 1203 CD1 LEU A 75 83.039 87.769 57.107 1.00 0.00 C
ATOM 1204 CD2 LEU A 75 81.741 88.646 59.226 1.00 0.00 C
ATOM 1205 H LEU A 75 82.844 92.376 56.004 1.00 0.00 H
ATOM 1206 HA LEU A 75 82.561 89.687 55.101 1.00 0.00 H
ATOM 1207 HB2 LEU A 75 82.958 90.654 57.529 1.00 0.00 H
ATOM 1208 HB3 LEU A 75 81.207 90.778 57.639 1.00 0.00 H
ATOM 1209 HG LEU A 75 80.993 88.256 57.180 1.00 0.00 H
ATOM 1210 HD11 LEU A 75 83.132 87.829 56.022 1.00 0.00 H
ATOM 1211 HD12 LEU A 75 84.003 88.124 57.472 1.00 0.00 H
ATOM 1212 HD13 LEU A 75 82.862 86.740 57.419 1.00 0.00 H
ATOM 1213 HD21 LEU A 75 81.458 87.607 59.397 1.00 0.00 H
ATOM 1214 HD22 LEU A 75 82.688 88.882 59.713 1.00 0.00 H
ATOM 1215 HD23 LEU A 75 81.040 89.395 59.592 1.00 0.00 H
ATOM 1216 N ARG A 76 80.275 88.890 54.665 1.00 0.00 N
ATOM 1217 CA ARG A 76 78.934 88.542 54.128 1.00 0.00 C
ATOM 1218 C ARG A 76 78.230 87.516 54.954 1.00 0.00 C
ATOM 1219 O ARG A 76 77.031 87.595 54.968 1.00 0.00 O
ATOM 1220 CB ARG A 76 79.178 87.961 52.653 1.00 0.00 C
ATOM 1221 CG ARG A 76 79.711 89.068 51.683 1.00 0.00 C
ATOM 1222 CD ARG A 76 78.853 90.323 51.588 1.00 0.00 C
ATOM 1223 NE ARG A 76 79.562 91.507 51.016 1.00 0.00 N
ATOM 1224 CZ ARG A 76 79.544 91.752 49.729 1.00 0.00 C
ATOM 1225 NH1 ARG A 76 78.901 91.108 48.803 1.00 0.00 N1+
ATOM 1226 NH2 ARG A 76 80.312 92.727 49.398 1.00 0.00 N
ATOM 1227 H ARG A 76 81.043 88.237 54.596 1.00 0.00 H
ATOM 1228 HA ARG A 76 78.232 89.370 54.028 1.00 0.00 H
ATOM 1229 HB2 ARG A 76 79.783 87.057 52.582 1.00 0.00 H
ATOM 1230 HB3 ARG A 76 78.221 87.746 52.176 1.00 0.00 H
ATOM 1231 HG2 ARG A 76 80.724 89.381 51.937 1.00 0.00 H
ATOM 1232 HG3 ARG A 76 79.971 88.632 50.719 1.00 0.00 H
ATOM 1233 HD2 ARG A 76 77.959 90.035 51.034 1.00 0.00 H
ATOM 1234 HD3 ARG A 76 78.544 90.600 52.596 1.00 0.00 H
ATOM 1235 HE ARG A 76 80.218 91.992 51.611 1.00 0.00 H
ATOM 1236 HH11 ARG A 76 78.312 90.304 48.963 1.00 0.00 H
ATOM 1237 HH12 ARG A 76 79.058 91.454 47.867 1.00 0.00 H
ATOM 1238 HH21 ARG A 76 80.891 93.172 50.096 1.00 0.00 H
ATOM 1239 HH22 ARG A 76 80.306 92.988 48.422 1.00 0.00 H
ATOM 1240 N SER A 77 78.897 86.552 55.597 1.00 0.00 N
ATOM 1241 CA SER A 77 78.131 85.542 56.409 1.00 0.00 C
ATOM 1242 C SER A 77 78.891 85.227 57.737 1.00 0.00 C
ATOM 1243 O SER A 77 80.129 85.005 57.726 1.00 0.00 O
ATOM 1244 CB SER A 77 78.157 84.220 55.716 1.00 0.00 C
ATOM 1245 OG SER A 77 77.465 83.273 56.556 1.00 0.00 O
ATOM 1246 H SER A 77 79.884 86.446 55.412 1.00 0.00 H
ATOM 1247 HA SER A 77 77.113 85.872 56.617 1.00 0.00 H
ATOM 1248 HB2 SER A 77 77.646 84.364 54.764 1.00 0.00 H
ATOM 1249 HB3 SER A 77 79.126 83.725 55.672 1.00 0.00 H
ATOM 1250 HG SER A 77 77.284 82.486 56.036 1.00 0.00 H
ATOM 1251 N LEU A 78 78.205 85.232 58.896 1.00 0.00 N
ATOM 1252 CA LEU A 78 78.863 85.235 60.221 1.00 0.00 C
ATOM 1253 C LEU A 78 78.312 84.047 60.997 1.00 0.00 C
ATOM 1254 O LEU A 78 77.244 84.138 61.569 1.00 0.00 O
ATOM 1255 CB LEU A 78 78.693 86.586 60.834 1.00 0.00 C
ATOM 1256 CG LEU A 78 79.041 86.702 62.343 1.00 0.00 C
ATOM 1257 CD1 LEU A 78 80.421 86.156 62.695 1.00 0.00 C
ATOM 1258 CD2 LEU A 78 78.873 88.183 62.743 1.00 0.00 C
ATOM 1259 H LEU A 78 77.233 85.501 58.934 1.00 0.00 H
ATOM 1260 HA LEU A 78 79.925 85.034 60.081 1.00 0.00 H
ATOM 1261 HB2 LEU A 78 79.323 87.267 60.261 1.00 0.00 H
ATOM 1262 HB3 LEU A 78 77.648 86.889 60.783 1.00 0.00 H
ATOM 1263 HG LEU A 78 78.270 86.091 62.811 1.00 0.00 H
ATOM 1264 HD11 LEU A 78 81.247 86.773 62.343 1.00 0.00 H
ATOM 1265 HD12 LEU A 78 80.604 86.180 63.769 1.00 0.00 H
ATOM 1266 HD13 LEU A 78 80.353 85.074 62.575 1.00 0.00 H
ATOM 1267 HD21 LEU A 78 78.087 88.749 62.243 1.00 0.00 H
ATOM 1268 HD22 LEU A 78 78.842 88.182 63.833 1.00 0.00 H
ATOM 1269 HD23 LEU A 78 79.728 88.773 62.413 1.00 0.00 H
ATOM 1270 N LYS A 79 79.057 82.917 61.105 1.00 0.00 N
ATOM 1271 CA LYS A 79 78.709 81.872 62.080 1.00 0.00 C
ATOM 1272 C LYS A 79 79.228 82.341 63.412 1.00 0.00 C
ATOM 1273 O LYS A 79 80.418 82.491 63.610 1.00 0.00 O
ATOM 1274 CB LYS A 79 79.276 80.558 61.612 1.00 0.00 C
ATOM 1275 CG LYS A 79 78.642 80.174 60.202 1.00 0.00 C
ATOM 1276 CD LYS A 79 78.647 78.659 59.982 1.00 0.00 C
ATOM 1277 CE LYS A 79 78.003 78.344 58.630 1.00 0.00 C
ATOM 1278 NZ LYS A 79 78.016 76.944 58.336 1.00 0.00 N1+
ATOM 1279 H LYS A 79 80.011 82.952 60.777 1.00 0.00 H
ATOM 1280 HA LYS A 79 77.624 81.785 62.037 1.00 0.00 H
ATOM 1281 HB2 LYS A 79 80.357 80.622 61.484 1.00 0.00 H
ATOM 1282 HB3 LYS A 79 78.950 79.814 62.339 1.00 0.00 H
ATOM 1283 HG2 LYS A 79 77.593 80.461 60.123 1.00 0.00 H
ATOM 1284 HG3 LYS A 79 79.350 80.580 59.480 1.00 0.00 H
ATOM 1285 HD2 LYS A 79 79.657 78.252 59.944 1.00 0.00 H
ATOM 1286 HD3 LYS A 79 78.068 78.142 60.747 1.00 0.00 H
ATOM 1287 HE2 LYS A 79 76.954 78.642 58.615 1.00 0.00 H
ATOM 1288 HE3 LYS A 79 78.592 78.823 57.848 1.00 0.00 H
ATOM 1289 HZ1 LYS A 79 78.973 76.678 58.153 1.00 0.00 H
ATOM 1290 HZ2 LYS A 79 77.769 76.302 59.076 1.00 0.00 H
ATOM 1291 HZ3 LYS A 79 77.524 76.811 57.465 1.00 0.00 H
ATOM 1292 N LEU A 80 78.236 82.542 64.344 1.00 0.00 N
ATOM 1293 CA LEU A 80 78.443 83.095 65.646 1.00 0.00 C
ATOM 1294 C LEU A 80 77.899 82.030 66.693 1.00 0.00 C
ATOM 1295 O LEU A 80 76.691 81.643 66.671 1.00 0.00 O
ATOM 1296 CB LEU A 80 77.736 84.527 65.717 1.00 0.00 C
ATOM 1297 CG LEU A 80 78.012 85.088 67.135 1.00 0.00 C
ATOM 1298 CD1 LEU A 80 79.390 85.493 67.529 1.00 0.00 C
ATOM 1299 CD2 LEU A 80 77.053 86.280 67.218 1.00 0.00 C
ATOM 1300 H LEU A 80 77.289 82.472 64.001 1.00 0.00 H
ATOM 1301 HA LEU A 80 79.511 83.304 65.697 1.00 0.00 H
ATOM 1302 HB2 LEU A 80 78.222 85.181 64.993 1.00 0.00 H
ATOM 1303 HB3 LEU A 80 76.656 84.392 65.647 1.00 0.00 H
ATOM 1304 HG LEU A 80 77.728 84.403 67.934 1.00 0.00 H
ATOM 1305 HD11 LEU A 80 79.728 86.095 66.685 1.00 0.00 H
ATOM 1306 HD12 LEU A 80 79.374 86.234 68.328 1.00 0.00 H
ATOM 1307 HD13 LEU A 80 80.040 84.646 67.747 1.00 0.00 H
ATOM 1308 HD21 LEU A 80 76.068 85.817 67.279 1.00 0.00 H
ATOM 1309 HD22 LEU A 80 77.145 86.745 68.200 1.00 0.00 H
ATOM 1310 HD23 LEU A 80 77.086 86.939 66.350 1.00 0.00 H
ATOM 1311 N LYS A 81 78.752 81.628 67.653 1.00 0.00 N
ATOM 1312 CA LYS A 81 78.400 80.748 68.772 1.00 0.00 C
ATOM 1313 C LYS A 81 78.619 81.312 70.177 1.00 0.00 C
ATOM 1314 O LYS A 81 79.585 82.049 70.473 1.00 0.00 O
ATOM 1315 CB LYS A 81 79.178 79.433 68.509 1.00 0.00 C
ATOM 1316 CG LYS A 81 78.840 78.365 69.501 1.00 0.00 C
ATOM 1317 CD LYS A 81 79.452 76.998 69.089 1.00 0.00 C
ATOM 1318 CE LYS A 81 80.853 77.051 68.743 1.00 0.00 C
ATOM 1319 NZ LYS A 81 81.258 75.738 68.310 1.00 0.00 N1+
ATOM 1320 H LYS A 81 79.739 81.828 67.571 1.00 0.00 H
ATOM 1321 HA LYS A 81 77.322 80.590 68.790 1.00 0.00 H
ATOM 1322 HB2 LYS A 81 78.957 79.120 67.488 1.00 0.00 H
ATOM 1323 HB3 LYS A 81 80.231 79.698 68.599 1.00 0.00 H
ATOM 1324 HG2 LYS A 81 79.117 78.656 70.514 1.00 0.00 H
ATOM 1325 HG3 LYS A 81 77.766 78.186 69.457 1.00 0.00 H
ATOM 1326 HD2 LYS A 81 79.256 76.275 69.881 1.00 0.00 H
ATOM 1327 HD3 LYS A 81 78.944 76.735 68.161 1.00 0.00 H
ATOM 1328 HE2 LYS A 81 81.086 77.734 67.926 1.00 0.00 H
ATOM 1329 HE3 LYS A 81 81.304 77.428 69.661 1.00 0.00 H
ATOM 1330 HZ1 LYS A 81 80.702 75.480 67.507 1.00 0.00 H
ATOM 1331 HZ2 LYS A 81 82.225 75.782 68.020 1.00 0.00 H
ATOM 1332 HZ3 LYS A 81 81.113 75.029 69.014 1.00 0.00 H
ATOM 1333 N GLY A 82 77.694 80.978 71.106 1.00 0.00 N
ATOM 1334 CA GLY A 82 77.515 81.607 72.411 1.00 0.00 C
ATOM 1335 C GLY A 82 77.969 80.781 73.581 1.00 0.00 C
ATOM 1336 O GLY A 82 79.122 80.306 73.597 1.00 0.00 O
ATOM 1337 H GLY A 82 76.951 80.337 70.864 1.00 0.00 H
ATOM 1338 HA2 GLY A 82 78.164 82.457 72.626 1.00 0.00 H
ATOM 1339 HA3 GLY A 82 76.494 81.903 72.652 1.00 0.00 H
ATOM 1340 N LYS A 83 77.136 80.351 74.428 1.00 0.00 N
ATOM 1341 CA LYS A 83 77.313 79.698 75.715 1.00 0.00 C
ATOM 1342 C LYS A 83 78.124 78.404 75.601 1.00 0.00 C
ATOM 1343 O LYS A 83 77.943 77.690 74.593 1.00 0.00 O
ATOM 1344 CB LYS A 83 75.930 79.395 76.391 1.00 0.00 C
ATOM 1345 CG LYS A 83 75.042 80.631 76.596 1.00 0.00 C
ATOM 1346 CD LYS A 83 73.634 80.113 77.017 1.00 0.00 C
ATOM 1347 CE LYS A 83 72.729 81.272 77.420 1.00 0.00 C
ATOM 1348 NZ LYS A 83 71.301 80.938 77.524 1.00 0.00 N1+
ATOM 1349 H LYS A 83 76.212 80.680 74.187 1.00 0.00 H
ATOM 1350 HA LYS A 83 77.763 80.426 76.390 1.00 0.00 H
ATOM 1351 HB2 LYS A 83 75.395 78.677 75.769 1.00 0.00 H
ATOM 1352 HB3 LYS A 83 76.184 79.048 77.392 1.00 0.00 H
ATOM 1353 HG2 LYS A 83 75.604 81.212 77.327 1.00 0.00 H
ATOM 1354 HG3 LYS A 83 74.872 81.271 75.730 1.00 0.00 H
ATOM 1355 HD2 LYS A 83 73.144 79.600 76.189 1.00 0.00 H
ATOM 1356 HD3 LYS A 83 73.627 79.373 77.817 1.00 0.00 H
ATOM 1357 HE2 LYS A 83 72.891 81.670 78.421 1.00 0.00 H
ATOM 1358 HE3 LYS A 83 72.792 82.165 76.799 1.00 0.00 H
ATOM 1359 HZ1 LYS A 83 71.198 80.150 78.147 1.00 0.00 H
ATOM 1360 HZ2 LYS A 83 70.841 81.690 78.018 1.00 0.00 H
ATOM 1361 HZ3 LYS A 83 70.743 80.859 76.686 1.00 0.00 H
ATOM 1362 N PRO A 84 78.755 77.950 76.721 1.00 0.00 N
ATOM 1363 CA PRO A 84 79.526 76.698 76.801 1.00 0.00 C
ATOM 1364 C PRO A 84 78.507 75.506 76.549 1.00 0.00 C
ATOM 1365 O PRO A 84 77.409 75.539 77.049 1.00 0.00 O
ATOM 1366 CB PRO A 84 80.022 76.662 78.264 1.00 0.00 C
ATOM 1367 CG PRO A 84 80.215 78.130 78.620 1.00 0.00 C
ATOM 1368 CD PRO A 84 78.981 78.764 77.976 1.00 0.00 C
ATOM 1369 HA PRO A 84 80.356 76.651 76.096 1.00 0.00 H
ATOM 1370 HB2 PRO A 84 79.213 76.264 78.878 1.00 0.00 H
ATOM 1371 HB3 PRO A 84 80.884 76.016 78.434 1.00 0.00 H
ATOM 1372 HG2 PRO A 84 80.250 78.074 79.708 1.00 0.00 H
ATOM 1373 HG3 PRO A 84 81.119 78.533 78.163 1.00 0.00 H
ATOM 1374 HD2 PRO A 84 78.129 78.612 78.638 1.00 0.00 H
ATOM 1375 HD3 PRO A 84 79.232 79.794 77.724 1.00 0.00 H
ATOM 1376 N ARG A 85 79.033 74.502 75.781 1.00 0.00 N
ATOM 1377 CA ARG A 85 78.272 73.266 75.243 1.00 0.00 C
ATOM 1378 C ARG A 85 77.369 72.605 76.344 1.00 0.00 C
ATOM 1379 O ARG A 85 76.270 72.129 75.998 1.00 0.00 O
ATOM 1380 CB ARG A 85 79.340 72.324 74.678 1.00 0.00 C
ATOM 1381 CG ARG A 85 78.823 71.273 73.659 1.00 0.00 C
ATOM 1382 CD ARG A 85 79.821 70.306 73.150 1.00 0.00 C
ATOM 1383 NE ARG A 85 80.271 69.422 74.231 1.00 0.00 N
ATOM 1384 CZ ARG A 85 79.951 68.132 74.463 1.00 0.00 C
ATOM 1385 NH1 ARG A 85 79.200 67.241 73.750 1.00 0.00 N1+
ATOM 1386 NH2 ARG A 85 80.446 67.587 75.512 1.00 0.00 N
ATOM 1387 H ARG A 85 79.977 74.680 75.469 1.00 0.00 H
ATOM 1388 HA ARG A 85 77.539 73.563 74.492 1.00 0.00 H
ATOM 1389 HB2 ARG A 85 80.120 72.878 74.156 1.00 0.00 H
ATOM 1390 HB3 ARG A 85 79.929 71.804 75.433 1.00 0.00 H
ATOM 1391 HG2 ARG A 85 78.064 70.769 74.257 1.00 0.00 H
ATOM 1392 HG3 ARG A 85 78.317 71.828 72.869 1.00 0.00 H
ATOM 1393 HD2 ARG A 85 79.363 69.715 72.357 1.00 0.00 H
ATOM 1394 HD3 ARG A 85 80.644 70.883 72.728 1.00 0.00 H
ATOM 1395 HE ARG A 85 80.970 69.790 74.860 1.00 0.00 H
ATOM 1396 HH11 ARG A 85 78.716 67.634 72.955 1.00 0.00 H
ATOM 1397 HH12 ARG A 85 79.311 66.255 73.937 1.00 0.00 H
ATOM 1398 HH21 ARG A 85 81.235 68.000 75.987 1.00 0.00 H
ATOM 1399 HH22 ARG A 85 80.239 66.605 75.623 1.00 0.00 H
ATOM 1400 N ALA A 86 77.764 72.676 77.617 1.00 0.00 N
ATOM 1401 CA ALA A 86 76.937 72.383 78.777 1.00 0.00 C
ATOM 1402 C ALA A 86 75.554 73.045 78.757 1.00 0.00 C
ATOM 1403 O ALA A 86 74.725 72.395 79.356 1.00 0.00 O
ATOM 1404 CB ALA A 86 77.768 72.654 80.042 1.00 0.00 C
ATOM 1405 H ALA A 86 78.720 72.991 77.700 1.00 0.00 H
ATOM 1406 HA ALA A 86 76.811 71.317 78.592 1.00 0.00 H
ATOM 1407 HB1 ALA A 86 77.533 73.622 80.484 1.00 0.00 H
ATOM 1408 HB2 ALA A 86 77.442 71.914 80.773 1.00 0.00 H
ATOM 1409 HB3 ALA A 86 78.842 72.716 79.871 1.00 0.00 H
ATOM 1410 N ALA A 87 75.312 74.158 78.096 1.00 0.00 N
ATOM 1411 CA ALA A 87 73.999 74.826 78.110 1.00 0.00 C
ATOM 1412 C ALA A 87 72.867 74.027 77.335 1.00 0.00 C
ATOM 1413 O ALA A 87 71.661 74.294 77.557 1.00 0.00 O
ATOM 1414 CB ALA A 87 74.171 76.095 77.369 1.00 0.00 C
ATOM 1415 H ALA A 87 76.105 74.647 77.708 1.00 0.00 H
ATOM 1416 HA ALA A 87 73.743 75.007 79.154 1.00 0.00 H
ATOM 1417 HB1 ALA A 87 74.938 76.735 77.805 1.00 0.00 H
ATOM 1418 HB2 ALA A 87 74.356 75.958 76.304 1.00 0.00 H
ATOM 1419 HB3 ALA A 87 73.252 76.677 77.439 1.00 0.00 H
ATOM 1420 N MET A 88 73.162 72.943 76.582 1.00 0.00 N
ATOM 1421 CA MET A 88 72.210 72.030 75.962 1.00 0.00 C
ATOM 1422 C MET A 88 71.555 71.031 76.941 1.00 0.00 C
ATOM 1423 O MET A 88 70.617 70.345 76.711 1.00 0.00 O
ATOM 1424 CB MET A 88 73.138 71.087 75.068 1.00 0.00 C
ATOM 1425 CG MET A 88 73.726 71.833 73.917 1.00 0.00 C
ATOM 1426 SD MET A 88 74.916 71.160 72.760 1.00 0.00 S
ATOM 1427 CE MET A 88 74.088 69.724 72.083 1.00 0.00 C
ATOM 1428 H MET A 88 74.147 72.767 76.446 1.00 0.00 H
ATOM 1429 HA MET A 88 71.522 72.536 75.284 1.00 0.00 H
ATOM 1430 HB2 MET A 88 74.006 70.735 75.627 1.00 0.00 H
ATOM 1431 HB3 MET A 88 72.566 70.237 74.695 1.00 0.00 H
ATOM 1432 HG2 MET A 88 72.918 72.195 73.282 1.00 0.00 H
ATOM 1433 HG3 MET A 88 74.044 72.760 74.394 1.00 0.00 H
ATOM 1434 HE1 MET A 88 73.363 70.014 71.323 1.00 0.00 H
ATOM 1435 HE2 MET A 88 74.907 69.249 71.543 1.00 0.00 H
ATOM 1436 HE3 MET A 88 73.713 68.989 72.796 1.00 0.00 H
ATOM 1437 N PHE A 89 72.108 70.931 78.162 1.00 0.00 N
ATOM 1438 CA PHE A 89 71.791 70.003 79.211 1.00 0.00 C
ATOM 1439 C PHE A 89 71.220 70.697 80.463 1.00 0.00 C
ATOM 1440 O PHE A 89 71.272 70.223 81.604 1.00 0.00 O
ATOM 1441 CB PHE A 89 72.975 69.076 79.499 1.00 0.00 C
ATOM 1442 CG PHE A 89 73.502 68.412 78.265 1.00 0.00 C
ATOM 1443 CD1 PHE A 89 72.989 67.129 77.967 1.00 0.00 C
ATOM 1444 CD2 PHE A 89 74.520 69.011 77.447 1.00 0.00 C
ATOM 1445 CE1 PHE A 89 73.507 66.496 76.805 1.00 0.00 C
ATOM 1446 CE2 PHE A 89 75.042 68.290 76.364 1.00 0.00 C
ATOM 1447 CZ PHE A 89 74.453 67.123 75.979 1.00 0.00 C
ATOM 1448 H PHE A 89 72.896 71.541 78.330 1.00 0.00 H
ATOM 1449 HA PHE A 89 71.020 69.350 78.801 1.00 0.00 H
ATOM 1450 HB2 PHE A 89 73.710 69.759 79.925 1.00 0.00 H
ATOM 1451 HB3 PHE A 89 72.826 68.319 80.269 1.00 0.00 H
ATOM 1452 HD1 PHE A 89 72.319 66.602 78.630 1.00 0.00 H
ATOM 1453 HD2 PHE A 89 74.933 69.982 77.681 1.00 0.00 H
ATOM 1454 HE1 PHE A 89 73.077 65.530 76.582 1.00 0.00 H
ATOM 1455 HE2 PHE A 89 75.813 68.801 75.807 1.00 0.00 H
ATOM 1456 HZ PHE A 89 74.820 66.644 75.083 1.00 0.00 H
ATOM 1457 N ASN A 90 70.596 71.920 80.262 1.00 0.00 N
ATOM 1458 CA ASN A 90 70.113 72.751 81.236 1.00 0.00 C
ATOM 1459 C ASN A 90 71.104 73.141 82.399 1.00 0.00 C
ATOM 1460 O ASN A 90 70.681 73.277 83.499 1.00 0.00 O
ATOM 1461 CB ASN A 90 68.750 72.305 81.667 1.00 0.00 C
ATOM 1462 CG ASN A 90 67.777 71.894 80.538 1.00 0.00 C
ATOM 1463 ND2 ASN A 90 67.138 72.796 79.865 1.00 0.00 N
ATOM 1464 OD1 ASN A 90 67.441 70.750 80.442 1.00 0.00 O
ATOM 1465 H ASN A 90 70.510 72.249 79.311 1.00 0.00 H
ATOM 1466 HA ASN A 90 69.973 73.656 80.646 1.00 0.00 H
ATOM 1467 HB2 ASN A 90 68.864 71.444 82.326 1.00 0.00 H
ATOM 1468 HB3 ASN A 90 68.210 73.077 82.215 1.00 0.00 H
ATOM 1469 HD21 ASN A 90 66.284 72.510 79.408 1.00 0.00 H
ATOM 1470 HD22 ASN A 90 67.256 73.753 80.166 1.00 0.00 H
ATOM 1471 N LEU A 91 72.409 73.229 82.192 1.00 0.00 N
ATOM 1472 CA LEU A 91 73.468 73.369 83.222 1.00 0.00 C
ATOM 1473 C LEU A 91 74.038 74.811 83.409 1.00 0.00 C
ATOM 1474 O LEU A 91 74.299 75.223 84.539 1.00 0.00 O
ATOM 1475 CB LEU A 91 74.686 72.456 82.917 1.00 0.00 C
ATOM 1476 CG LEU A 91 74.279 70.947 82.775 1.00 0.00 C
ATOM 1477 CD1 LEU A 91 75.589 70.240 82.610 1.00 0.00 C
ATOM 1478 CD2 LEU A 91 73.610 70.530 84.074 1.00 0.00 C
ATOM 1479 H LEU A 91 72.673 73.132 81.222 1.00 0.00 H
ATOM 1480 HA LEU A 91 73.023 73.043 84.162 1.00 0.00 H
ATOM 1481 HB2 LEU A 91 75.231 72.818 82.046 1.00 0.00 H
ATOM 1482 HB3 LEU A 91 75.310 72.645 83.790 1.00 0.00 H
ATOM 1483 HG LEU A 91 73.627 70.859 81.906 1.00 0.00 H
ATOM 1484 HD11 LEU A 91 75.436 69.162 82.558 1.00 0.00 H
ATOM 1485 HD12 LEU A 91 76.177 70.468 81.721 1.00 0.00 H
ATOM 1486 HD13 LEU A 91 76.191 70.408 83.503 1.00 0.00 H
ATOM 1487 HD21 LEU A 91 73.691 69.449 84.189 1.00 0.00 H
ATOM 1488 HD22 LEU A 91 74.059 70.870 85.007 1.00 0.00 H
ATOM 1489 HD23 LEU A 91 72.580 70.874 83.978 1.00 0.00 H
ATOM 1490 N ILE A 92 74.096 75.626 82.341 1.00 0.00 N
ATOM 1491 CA ILE A 92 74.602 77.005 82.374 1.00 0.00 C
ATOM 1492 C ILE A 92 73.508 77.983 82.867 1.00 0.00 C
ATOM 1493 O ILE A 92 72.367 77.910 82.400 1.00 0.00 O
ATOM 1494 CB ILE A 92 75.209 77.305 80.943 1.00 0.00 C
ATOM 1495 CG1 ILE A 92 76.536 76.582 80.750 1.00 0.00 C
ATOM 1496 CG2 ILE A 92 75.458 78.743 80.699 1.00 0.00 C
ATOM 1497 CD1 ILE A 92 77.780 77.060 81.563 1.00 0.00 C
ATOM 1498 H ILE A 92 73.827 75.199 81.466 1.00 0.00 H
ATOM 1499 HA ILE A 92 75.469 77.057 83.033 1.00 0.00 H
ATOM 1500 HB ILE A 92 74.512 76.834 80.250 1.00 0.00 H
ATOM 1501 HG12 ILE A 92 76.455 75.515 80.956 1.00 0.00 H
ATOM 1502 HG13 ILE A 92 76.689 76.607 79.671 1.00 0.00 H
ATOM 1503 HG21 ILE A 92 74.455 79.162 80.620 1.00 0.00 H
ATOM 1504 HG22 ILE A 92 76.002 79.101 81.573 1.00 0.00 H
ATOM 1505 HG23 ILE A 92 76.076 78.932 79.821 1.00 0.00 H
ATOM 1506 HD11 ILE A 92 77.921 78.134 81.440 1.00 0.00 H
ATOM 1507 HD12 ILE A 92 77.650 76.879 82.630 1.00 0.00 H
ATOM 1508 HD13 ILE A 92 78.700 76.537 81.303 1.00 0.00 H
ATOM 1509 N PRO A 93 73.913 78.868 83.812 1.00 0.00 N
ATOM 1510 CA PRO A 93 72.999 79.953 84.230 1.00 0.00 C
ATOM 1511 C PRO A 93 72.727 80.965 83.116 1.00 0.00 C
ATOM 1512 O PRO A 93 73.561 81.267 82.304 1.00 0.00 O
ATOM 1513 CB PRO A 93 73.757 80.740 85.336 1.00 0.00 C
ATOM 1514 CG PRO A 93 75.196 80.222 85.227 1.00 0.00 C
ATOM 1515 CD PRO A 93 75.189 78.917 84.496 1.00 0.00 C
ATOM 1516 HA PRO A 93 72.087 79.530 84.652 1.00 0.00 H
ATOM 1517 HB2 PRO A 93 73.832 81.800 85.090 1.00 0.00 H
ATOM 1518 HB3 PRO A 93 73.312 80.571 86.317 1.00 0.00 H
ATOM 1519 HG2 PRO A 93 75.812 80.899 84.634 1.00 0.00 H
ATOM 1520 HG3 PRO A 93 75.556 79.987 86.228 1.00 0.00 H
ATOM 1521 HD2 PRO A 93 76.069 78.919 83.852 1.00 0.00 H
ATOM 1522 HD3 PRO A 93 75.202 78.142 85.262 1.00 0.00 H
ATOM 1523 N GLU A 94 71.498 81.620 83.114 1.00 0.00 N
ATOM 1524 CA GLU A 94 70.963 82.536 82.018 1.00 0.00 C
ATOM 1525 C GLU A 94 71.889 83.752 82.086 1.00 0.00 C
ATOM 1526 O GLU A 94 72.403 84.307 81.104 1.00 0.00 O
ATOM 1527 CB GLU A 94 69.465 82.885 82.323 1.00 0.00 C
ATOM 1528 CG GLU A 94 68.444 81.738 82.473 1.00 0.00 C
ATOM 1529 CD GLU A 94 68.568 80.907 83.778 1.00 0.00 C
ATOM 1530 OE1 GLU A 94 68.240 79.708 83.788 1.00 0.00 O
ATOM 1531 OE2 GLU A 94 69.042 81.436 84.805 1.00 0.00 O1-
ATOM 1532 H GLU A 94 70.877 81.392 83.878 1.00 0.00 H
ATOM 1533 HA GLU A 94 71.104 82.015 81.071 1.00 0.00 H
ATOM 1534 HB2 GLU A 94 69.356 83.380 83.288 1.00 0.00 H
ATOM 1535 HB3 GLU A 94 69.143 83.647 81.613 1.00 0.00 H
ATOM 1536 HG2 GLU A 94 67.425 82.111 82.368 1.00 0.00 H
ATOM 1537 HG3 GLU A 94 68.548 81.005 81.673 1.00 0.00 H
ATOM 1538 N ASN A 95 72.214 84.168 83.329 1.00 0.00 N
ATOM 1539 CA ASN A 95 73.125 85.275 83.784 1.00 0.00 C
ATOM 1540 C ASN A 95 74.575 85.138 83.352 1.00 0.00 C
ATOM 1541 O ASN A 95 75.424 86.069 83.504 1.00 0.00 O
ATOM 1542 CB ASN A 95 72.888 85.486 85.298 1.00 0.00 C
ATOM 1543 CG ASN A 95 72.973 84.250 86.206 1.00 0.00 C
ATOM 1544 ND2 ASN A 95 71.855 83.589 86.351 1.00 0.00 N
ATOM 1545 OD1 ASN A 95 74.045 83.985 86.686 1.00 0.00 O
ATOM 1546 H ASN A 95 71.942 83.521 84.055 1.00 0.00 H
ATOM 1547 HA ASN A 95 72.766 86.238 83.423 1.00 0.00 H
ATOM 1548 HB2 ASN A 95 73.551 86.208 85.774 1.00 0.00 H
ATOM 1549 HB3 ASN A 95 71.868 85.813 85.502 1.00 0.00 H
ATOM 1550 HD21 ASN A 95 71.933 82.747 86.905 1.00 0.00 H
ATOM 1551 HD22 ASN A 95 70.975 84.064 86.210 1.00 0.00 H
ATOM 1552 N TRP A 96 75.008 84.017 82.752 1.00 0.00 N
ATOM 1553 CA TRP A 96 76.365 83.921 82.097 1.00 0.00 C
ATOM 1554 C TRP A 96 76.529 84.922 80.931 1.00 0.00 C
ATOM 1555 O TRP A 96 77.576 85.519 80.791 1.00 0.00 O
ATOM 1556 CB TRP A 96 76.635 82.455 81.729 1.00 0.00 C
ATOM 1557 CG TRP A 96 77.956 82.195 81.095 1.00 0.00 C
ATOM 1558 CD1 TRP A 96 79.122 81.994 81.734 1.00 0.00 C
ATOM 1559 CD2 TRP A 96 78.289 82.353 79.661 1.00 0.00 C
ATOM 1560 CE2 TRP A 96 79.692 82.129 79.461 1.00 0.00 C
ATOM 1561 CE3 TRP A 96 77.479 82.733 78.568 1.00 0.00 C
ATOM 1562 NE1 TRP A 96 80.141 81.978 80.736 1.00 0.00 N
ATOM 1563 CZ2 TRP A 96 80.356 82.298 78.237 1.00 0.00 C
ATOM 1564 CZ3 TRP A 96 78.163 82.871 77.270 1.00 0.00 C
ATOM 1565 CH2 TRP A 96 79.551 82.680 77.096 1.00 0.00 C
ATOM 1566 H TRP A 96 74.417 83.199 82.693 1.00 0.00 H
ATOM 1567 HA TRP A 96 77.080 84.197 82.873 1.00 0.00 H
ATOM 1568 HB2 TRP A 96 76.591 81.861 82.641 1.00 0.00 H
ATOM 1569 HB3 TRP A 96 75.919 82.072 81.002 1.00 0.00 H
ATOM 1570 HD1 TRP A 96 79.298 82.118 82.792 1.00 0.00 H
ATOM 1571 HE1 TRP A 96 81.089 82.236 80.971 1.00 0.00 H
ATOM 1572 HE3 TRP A 96 76.412 82.901 78.581 1.00 0.00 H
ATOM 1573 HZ2 TRP A 96 81.421 82.118 78.223 1.00 0.00 H
ATOM 1574 HZ3 TRP A 96 77.541 82.953 76.392 1.00 0.00 H
ATOM 1575 HH2 TRP A 96 79.990 82.697 76.110 1.00 0.00 H
ATOM 1576 N GLY A 97 75.431 85.143 80.180 1.00 0.00 N
ATOM 1577 CA GLY A 97 75.403 85.975 78.990 1.00 0.00 C
ATOM 1578 C GLY A 97 75.430 85.207 77.683 1.00 0.00 C
ATOM 1579 O GLY A 97 74.812 84.159 77.532 1.00 0.00 O
ATOM 1580 H GLY A 97 74.570 84.661 80.396 1.00 0.00 H
ATOM 1581 HA2 GLY A 97 74.439 86.483 78.960 1.00 0.00 H
ATOM 1582 HA3 GLY A 97 76.208 86.710 78.981 1.00 0.00 H
ATOM 1583 N GLY A 98 76.138 85.717 76.730 1.00 0.00 N
ATOM 1584 CA GLY A 98 76.050 85.305 75.322 1.00 0.00 C
ATOM 1585 C GLY A 98 74.932 85.983 74.523 1.00 0.00 C
ATOM 1586 O GLY A 98 74.214 85.243 73.834 1.00 0.00 O
ATOM 1587 H GLY A 98 76.681 86.549 76.915 1.00 0.00 H
ATOM 1588 HA2 GLY A 98 77.032 85.526 74.904 1.00 0.00 H
ATOM 1589 HA3 GLY A 98 75.950 84.221 75.259 1.00 0.00 H
ATOM 1590 N TYR A 99 74.700 87.259 74.681 1.00 0.00 N
ATOM 1591 CA TYR A 99 73.769 88.131 73.997 1.00 0.00 C
ATOM 1592 C TYR A 99 74.223 88.497 72.625 1.00 0.00 C
ATOM 1593 O TYR A 99 75.381 88.751 72.314 1.00 0.00 O
ATOM 1594 CB TYR A 99 73.489 89.413 74.802 1.00 0.00 C
ATOM 1595 CG TYR A 99 73.564 89.376 76.296 1.00 0.00 C
ATOM 1596 CD1 TYR A 99 74.795 89.428 76.996 1.00 0.00 C
ATOM 1597 CD2 TYR A 99 72.331 89.228 77.004 1.00 0.00 C
ATOM 1598 CE1 TYR A 99 74.816 89.267 78.383 1.00 0.00 C
ATOM 1599 CE2 TYR A 99 72.372 89.147 78.447 1.00 0.00 C
ATOM 1600 CZ TYR A 99 73.577 89.103 79.061 1.00 0.00 C
ATOM 1601 OH TYR A 99 73.640 88.818 80.336 1.00 0.00 O
ATOM 1602 H TYR A 99 75.372 87.636 75.334 1.00 0.00 H
ATOM 1603 HA TYR A 99 72.815 87.629 73.834 1.00 0.00 H
ATOM 1604 HB2 TYR A 99 74.304 90.086 74.537 1.00 0.00 H
ATOM 1605 HB3 TYR A 99 72.522 89.810 74.492 1.00 0.00 H
ATOM 1606 HD1 TYR A 99 75.727 89.559 76.466 1.00 0.00 H
ATOM 1607 HD2 TYR A 99 71.385 89.250 76.484 1.00 0.00 H
ATOM 1608 HE1 TYR A 99 75.742 89.312 78.936 1.00 0.00 H
ATOM 1609 HE2 TYR A 99 71.477 88.967 79.025 1.00 0.00 H
ATOM 1610 HH TYR A 99 74.498 88.495 80.623 1.00 0.00 H
ATOM 1611 N VAL A 100 73.210 88.602 71.723 1.00 0.00 N
ATOM 1612 CA VAL A 100 73.373 89.065 70.302 1.00 0.00 C
ATOM 1613 C VAL A 100 73.341 90.551 70.177 1.00 0.00 C
ATOM 1614 O VAL A 100 73.869 90.995 69.194 1.00 0.00 O
ATOM 1615 CB VAL A 100 72.357 88.450 69.386 1.00 0.00 C
ATOM 1616 CG1 VAL A 100 72.265 86.903 69.439 1.00 0.00 C
ATOM 1617 CG2 VAL A 100 70.949 88.908 69.709 1.00 0.00 C
ATOM 1618 H VAL A 100 72.432 88.022 72.001 1.00 0.00 H
ATOM 1619 HA VAL A 100 74.339 88.836 69.852 1.00 0.00 H
ATOM 1620 HB VAL A 100 72.608 88.788 68.381 1.00 0.00 H
ATOM 1621 HG11 VAL A 100 73.262 86.465 69.488 1.00 0.00 H
ATOM 1622 HG12 VAL A 100 71.732 86.707 70.369 1.00 0.00 H
ATOM 1623 HG13 VAL A 100 71.750 86.598 68.528 1.00 0.00 H
ATOM 1624 HG21 VAL A 100 70.167 88.588 69.020 1.00 0.00 H
ATOM 1625 HG22 VAL A 100 70.692 88.569 70.713 1.00 0.00 H
ATOM 1626 HG23 VAL A 100 70.881 89.995 69.678 1.00 0.00 H
ATOM 1627 N THR A 101 72.898 91.289 71.235 1.00 0.00 N
ATOM 1628 CA THR A 101 72.534 92.688 71.113 1.00 0.00 C
ATOM 1629 C THR A 101 73.812 93.509 70.677 1.00 0.00 C
ATOM 1630 O THR A 101 73.692 94.382 69.835 1.00 0.00 O
ATOM 1631 CB THR A 101 72.089 92.986 72.512 1.00 0.00 C
ATOM 1632 CG2 THR A 101 71.651 94.456 72.541 1.00 0.00 C
ATOM 1633 OG1 THR A 101 70.984 92.196 72.943 1.00 0.00 O
ATOM 1634 H THR A 101 72.697 90.880 72.136 1.00 0.00 H
ATOM 1635 HA THR A 101 71.732 92.995 70.441 1.00 0.00 H
ATOM 1636 HB THR A 101 72.867 92.905 73.271 1.00 0.00 H
ATOM 1637 HG1 THR A 101 70.335 92.158 72.237 1.00 0.00 H
ATOM 1638 HG21 THR A 101 72.523 95.107 72.485 1.00 0.00 H
ATOM 1639 HG22 THR A 101 71.009 94.739 71.707 1.00 0.00 H
ATOM 1640 HG23 THR A 101 71.202 94.597 73.525 1.00 0.00 H
ATOM 1641 N PRO A 102 75.019 93.280 71.191 1.00 0.00 N
ATOM 1642 CA PRO A 102 76.247 93.954 70.705 1.00 0.00 C
ATOM 1643 C PRO A 102 76.795 93.507 69.357 1.00 0.00 C
ATOM 1644 O PRO A 102 77.620 94.176 68.714 1.00 0.00 O
ATOM 1645 CB PRO A 102 77.364 93.917 71.764 1.00 0.00 C
ATOM 1646 CG PRO A 102 76.945 92.660 72.502 1.00 0.00 C
ATOM 1647 CD PRO A 102 75.437 92.547 72.385 1.00 0.00 C
ATOM 1648 HA PRO A 102 75.924 94.994 70.646 1.00 0.00 H
ATOM 1649 HB2 PRO A 102 78.314 93.845 71.234 1.00 0.00 H
ATOM 1650 HB3 PRO A 102 77.332 94.801 72.400 1.00 0.00 H
ATOM 1651 HG2 PRO A 102 77.384 91.785 72.022 1.00 0.00 H
ATOM 1652 HG3 PRO A 102 77.302 92.686 73.531 1.00 0.00 H
ATOM 1653 HD2 PRO A 102 75.053 91.532 72.489 1.00 0.00 H
ATOM 1654 HD3 PRO A 102 74.985 93.032 73.250 1.00 0.00 H
ATOM 1655 N TRP A 103 76.275 92.452 68.797 1.00 0.00 N
ATOM 1656 CA TRP A 103 76.499 92.075 67.415 1.00 0.00 C
ATOM 1657 C TRP A 103 75.517 92.685 66.421 1.00 0.00 C
ATOM 1658 O TRP A 103 75.921 93.111 65.334 1.00 0.00 O
ATOM 1659 CB TRP A 103 76.593 90.539 67.336 1.00 0.00 C
ATOM 1660 CG TRP A 103 77.696 89.949 68.103 1.00 0.00 C
ATOM 1661 CD1 TRP A 103 77.697 89.555 69.415 1.00 0.00 C
ATOM 1662 CD2 TRP A 103 79.058 89.733 67.656 1.00 0.00 C
ATOM 1663 CE2 TRP A 103 79.846 89.346 68.782 1.00 0.00 C
ATOM 1664 CE3 TRP A 103 79.733 90.046 66.468 1.00 0.00 C
ATOM 1665 NE1 TRP A 103 78.968 89.152 69.829 1.00 0.00 N
ATOM 1666 CZ2 TRP A 103 81.198 89.248 68.734 1.00 0.00 C
ATOM 1667 CZ3 TRP A 103 81.150 90.050 66.439 1.00 0.00 C
ATOM 1668 CH2 TRP A 103 81.873 89.651 67.583 1.00 0.00 C
ATOM 1669 H TRP A 103 75.658 91.909 69.384 1.00 0.00 H
ATOM 1670 HA TRP A 103 77.448 92.516 67.108 1.00 0.00 H
ATOM 1671 HB2 TRP A 103 75.654 90.070 67.630 1.00 0.00 H
ATOM 1672 HB3 TRP A 103 76.660 90.193 66.305 1.00 0.00 H
ATOM 1673 HD1 TRP A 103 76.804 89.585 70.022 1.00 0.00 H
ATOM 1674 HE1 TRP A 103 79.207 88.950 70.790 1.00 0.00 H
ATOM 1675 HE3 TRP A 103 79.170 90.354 65.600 1.00 0.00 H
ATOM 1676 HZ2 TRP A 103 81.776 88.882 69.569 1.00 0.00 H
ATOM 1677 HZ3 TRP A 103 81.709 90.388 65.580 1.00 0.00 H
ATOM 1678 HH2 TRP A 103 82.945 89.552 67.499 1.00 0.00 H
ATOM 1679 N VAL A 104 74.263 92.865 66.812 1.00 0.00 N
ATOM 1680 CA VAL A 104 73.241 93.663 66.057 1.00 0.00 C
ATOM 1681 C VAL A 104 73.693 95.175 65.978 1.00 0.00 C
ATOM 1682 O VAL A 104 73.597 95.723 64.859 1.00 0.00 O
ATOM 1683 CB VAL A 104 71.873 93.405 66.666 1.00 0.00 C
ATOM 1684 CG1 VAL A 104 70.900 94.432 66.070 1.00 0.00 C
ATOM 1685 CG2 VAL A 104 71.419 92.051 66.271 1.00 0.00 C
ATOM 1686 H VAL A 104 73.969 92.299 67.594 1.00 0.00 H
ATOM 1687 HA VAL A 104 73.265 93.381 65.005 1.00 0.00 H
ATOM 1688 HB VAL A 104 71.897 93.659 67.726 1.00 0.00 H
ATOM 1689 HG11 VAL A 104 70.969 95.451 66.451 1.00 0.00 H
ATOM 1690 HG12 VAL A 104 71.088 94.591 65.009 1.00 0.00 H
ATOM 1691 HG13 VAL A 104 69.889 94.025 66.108 1.00 0.00 H
ATOM 1692 HG21 VAL A 104 72.092 91.293 66.671 1.00 0.00 H
ATOM 1693 HG22 VAL A 104 70.367 91.884 66.502 1.00 0.00 H
ATOM 1694 HG23 VAL A 104 71.547 91.906 65.198 1.00 0.00 H
ATOM 1695 N THR A 105 74.296 95.737 67.024 1.00 0.00 N
ATOM 1696 CA THR A 105 74.872 97.112 66.928 1.00 0.00 C
ATOM 1697 C THR A 105 75.973 97.148 65.829 1.00 0.00 C
ATOM 1698 O THR A 105 75.999 98.058 64.979 1.00 0.00 O
ATOM 1699 CB THR A 105 75.473 97.645 68.220 1.00 0.00 C
ATOM 1700 CG2 THR A 105 75.974 99.090 68.258 1.00 0.00 C
ATOM 1701 OG1 THR A 105 74.458 97.743 69.133 1.00 0.00 O
ATOM 1702 H THR A 105 74.320 95.173 67.861 1.00 0.00 H
ATOM 1703 HA THR A 105 74.087 97.795 66.603 1.00 0.00 H
ATOM 1704 HB THR A 105 76.281 97.054 68.651 1.00 0.00 H
ATOM 1705 HG1 THR A 105 74.949 97.582 69.942 1.00 0.00 H
ATOM 1706 HG21 THR A 105 75.394 99.750 67.613 1.00 0.00 H
ATOM 1707 HG22 THR A 105 75.916 99.589 69.226 1.00 0.00 H
ATOM 1708 HG23 THR A 105 76.950 99.046 67.774 1.00 0.00 H
ATOM 1709 N GLU A 106 76.848 96.119 65.813 1.00 0.00 N
ATOM 1710 CA GLU A 106 78.006 96.051 64.919 1.00 0.00 C
ATOM 1711 C GLU A 106 77.508 95.914 63.491 1.00 0.00 C
ATOM 1712 O GLU A 106 77.975 96.584 62.593 1.00 0.00 O
ATOM 1713 CB GLU A 106 78.960 94.965 65.289 1.00 0.00 C
ATOM 1714 CG GLU A 106 80.368 95.102 64.861 1.00 0.00 C
ATOM 1715 CD GLU A 106 81.160 96.215 65.578 1.00 0.00 C
ATOM 1716 OE1 GLU A 106 81.943 96.929 64.920 1.00 0.00 O
ATOM 1717 OE2 GLU A 106 80.941 96.505 66.759 1.00 0.00 O1-
ATOM 1718 H GLU A 106 76.693 95.433 66.538 1.00 0.00 H
ATOM 1719 HA GLU A 106 78.497 97.024 64.923 1.00 0.00 H
ATOM 1720 HB2 GLU A 106 78.878 94.998 66.375 1.00 0.00 H
ATOM 1721 HB3 GLU A 106 78.583 93.999 64.954 1.00 0.00 H
ATOM 1722 HG2 GLU A 106 80.800 94.116 65.029 1.00 0.00 H
ATOM 1723 HG3 GLU A 106 80.348 95.376 63.806 1.00 0.00 H
ATOM 1724 N ILE A 107 76.435 95.044 63.296 1.00 0.00 N
ATOM 1725 CA ILE A 107 75.751 94.989 61.972 1.00 0.00 C
ATOM 1726 C ILE A 107 75.289 96.374 61.580 1.00 0.00 C
ATOM 1727 O ILE A 107 75.466 96.798 60.484 1.00 0.00 O
ATOM 1728 CB ILE A 107 74.532 93.957 62.076 1.00 0.00 C
ATOM 1729 CG1 ILE A 107 75.112 92.587 62.129 1.00 0.00 C
ATOM 1730 CG2 ILE A 107 73.701 94.217 60.874 1.00 0.00 C
ATOM 1731 CD1 ILE A 107 74.126 91.460 62.219 1.00 0.00 C
ATOM 1732 H ILE A 107 76.059 94.527 64.079 1.00 0.00 H
ATOM 1733 HA ILE A 107 76.535 94.680 61.280 1.00 0.00 H
ATOM 1734 HB ILE A 107 73.920 94.167 62.953 1.00 0.00 H
ATOM 1735 HG12 ILE A 107 75.816 92.457 61.307 1.00 0.00 H
ATOM 1736 HG13 ILE A 107 75.742 92.398 62.998 1.00 0.00 H
ATOM 1737 HG21 ILE A 107 73.078 95.063 61.165 1.00 0.00 H
ATOM 1738 HG22 ILE A 107 74.283 94.161 59.954 1.00 0.00 H
ATOM 1739 HG23 ILE A 107 72.950 93.428 60.832 1.00 0.00 H
ATOM 1740 HD11 ILE A 107 73.513 91.431 61.319 1.00 0.00 H
ATOM 1741 HD12 ILE A 107 74.664 90.513 62.254 1.00 0.00 H
ATOM 1742 HD13 ILE A 107 73.509 91.525 63.115 1.00 0.00 H
ATOM 1743 N SER A 108 74.645 97.090 62.515 1.00 0.00 N
ATOM 1744 CA SER A 108 73.891 98.307 62.347 1.00 0.00 C
ATOM 1745 C SER A 108 74.839 99.569 61.979 1.00 0.00 C
ATOM 1746 O SER A 108 74.376 100.560 61.532 1.00 0.00 O
ATOM 1747 CB SER A 108 72.989 98.690 63.506 1.00 0.00 C
ATOM 1748 OG SER A 108 72.065 97.602 63.815 1.00 0.00 O
ATOM 1749 H SER A 108 74.631 96.768 63.472 1.00 0.00 H
ATOM 1750 HA SER A 108 73.273 98.147 61.464 1.00 0.00 H
ATOM 1751 HB2 SER A 108 73.659 98.944 64.328 1.00 0.00 H
ATOM 1752 HB3 SER A 108 72.384 99.561 63.252 1.00 0.00 H
ATOM 1753 HG SER A 108 72.523 96.881 64.254 1.00 0.00 H
ATOM 1754 N ASN A 109 76.151 99.444 62.265 1.00 0.00 N
ATOM 1755 CA ASN A 109 77.119 100.500 62.077 1.00 0.00 C
ATOM 1756 C ASN A 109 78.227 100.127 61.108 1.00 0.00 C
ATOM 1757 O ASN A 109 78.580 100.943 60.281 1.00 0.00 O
ATOM 1758 CB ASN A 109 77.683 100.916 63.435 1.00 0.00 C
ATOM 1759 CG ASN A 109 76.614 101.680 64.076 1.00 0.00 C
ATOM 1760 ND2 ASN A 109 75.836 101.190 64.983 1.00 0.00 N
ATOM 1761 OD1 ASN A 109 76.285 102.795 63.639 1.00 0.00 O
ATOM 1762 H ASN A 109 76.453 98.571 62.673 1.00 0.00 H
ATOM 1763 HA ASN A 109 76.657 101.375 61.620 1.00 0.00 H
ATOM 1764 HB2 ASN A 109 77.815 100.068 64.108 1.00 0.00 H
ATOM 1765 HB3 ASN A 109 78.518 101.616 63.470 1.00 0.00 H
ATOM 1766 HD21 ASN A 109 74.979 101.660 65.239 1.00 0.00 H
ATOM 1767 HD22 ASN A 109 75.853 100.192 65.137 1.00 0.00 H
ATOM 1768 N ASN A 110 78.778 98.914 61.167 1.00 0.00 N
ATOM 1769 CA ASN A 110 79.985 98.484 60.465 1.00 0.00 C
ATOM 1770 C ASN A 110 79.713 97.385 59.464 1.00 0.00 C
ATOM 1771 O ASN A 110 80.217 97.395 58.335 1.00 0.00 O
ATOM 1772 CB ASN A 110 80.953 98.096 61.568 1.00 0.00 C
ATOM 1773 CG ASN A 110 81.304 99.387 62.355 1.00 0.00 C
ATOM 1774 ND2 ASN A 110 81.314 99.380 63.650 1.00 0.00 N
ATOM 1775 OD1 ASN A 110 81.485 100.426 61.771 1.00 0.00 O
ATOM 1776 H ASN A 110 78.311 98.346 61.860 1.00 0.00 H
ATOM 1777 HA ASN A 110 80.269 99.332 59.842 1.00 0.00 H
ATOM 1778 HB2 ASN A 110 80.522 97.377 62.265 1.00 0.00 H
ATOM 1779 HB3 ASN A 110 81.897 97.712 61.181 1.00 0.00 H
ATOM 1780 HD21 ASN A 110 81.569 100.278 64.037 1.00 0.00 H
ATOM 1781 HD22 ASN A 110 81.514 98.532 64.161 1.00 0.00 H
ATOM 1782 N LEU A 111 78.995 96.316 59.862 1.00 0.00 N
ATOM 1783 CA LEU A 111 78.826 95.095 59.054 1.00 0.00 C
ATOM 1784 C LEU A 111 77.460 95.145 58.275 1.00 0.00 C
ATOM 1785 O LEU A 111 76.646 94.199 58.077 1.00 0.00 O
ATOM 1786 CB LEU A 111 79.030 93.849 59.940 1.00 0.00 C
ATOM 1787 CG LEU A 111 80.352 93.691 60.714 1.00 0.00 C
ATOM 1788 CD1 LEU A 111 80.190 92.649 61.869 1.00 0.00 C
ATOM 1789 CD2 LEU A 111 81.499 93.292 59.802 1.00 0.00 C
ATOM 1790 H LEU A 111 78.627 96.346 60.801 1.00 0.00 H
ATOM 1791 HA LEU A 111 79.576 94.999 58.269 1.00 0.00 H
ATOM 1792 HB2 LEU A 111 78.175 93.779 60.612 1.00 0.00 H
ATOM 1793 HB3 LEU A 111 78.993 92.932 59.353 1.00 0.00 H
ATOM 1794 HG LEU A 111 80.736 94.602 61.172 1.00 0.00 H
ATOM 1795 HD11 LEU A 111 80.001 91.619 61.566 1.00 0.00 H
ATOM 1796 HD12 LEU A 111 81.048 92.698 62.539 1.00 0.00 H
ATOM 1797 HD13 LEU A 111 79.305 92.945 62.432 1.00 0.00 H
ATOM 1798 HD21 LEU A 111 82.404 93.178 60.398 1.00 0.00 H
ATOM 1799 HD22 LEU A 111 81.119 92.576 59.073 1.00 0.00 H
ATOM 1800 HD23 LEU A 111 81.672 94.171 59.180 1.00 0.00 H
ATOM 1801 N ARG A 112 77.192 96.293 57.748 1.00 0.00 N
ATOM 1802 CA ARG A 112 75.928 96.653 57.019 1.00 0.00 C
ATOM 1803 C ARG A 112 75.799 95.868 55.688 1.00 0.00 C
ATOM 1804 O ARG A 112 74.653 95.828 55.192 1.00 0.00 O
ATOM 1805 CB ARG A 112 75.907 98.192 56.803 1.00 0.00 C
ATOM 1806 CG ARG A 112 76.104 99.135 57.987 1.00 0.00 C
ATOM 1807 CD ARG A 112 76.136 100.590 57.460 1.00 0.00 C
ATOM 1808 NE ARG A 112 77.352 100.763 56.631 1.00 0.00 N
ATOM 1809 CZ ARG A 112 77.894 101.902 56.320 1.00 0.00 C
ATOM 1810 NH1 ARG A 112 77.568 103.059 56.755 1.00 0.00 N1+
ATOM 1811 NH2 ARG A 112 78.879 101.946 55.543 1.00 0.00 N
ATOM 1812 H ARG A 112 77.981 96.923 57.751 1.00 0.00 H
ATOM 1813 HA ARG A 112 75.171 96.331 57.735 1.00 0.00 H
ATOM 1814 HB2 ARG A 112 76.620 98.441 56.017 1.00 0.00 H
ATOM 1815 HB3 ARG A 112 74.948 98.342 56.307 1.00 0.00 H
ATOM 1816 HG2 ARG A 112 75.261 98.958 58.655 1.00 0.00 H
ATOM 1817 HG3 ARG A 112 77.014 98.845 58.513 1.00 0.00 H
ATOM 1818 HD2 ARG A 112 75.336 100.690 56.727 1.00 0.00 H
ATOM 1819 HD3 ARG A 112 76.094 101.308 58.279 1.00 0.00 H
ATOM 1820 HE ARG A 112 77.801 99.928 56.283 1.00 0.00 H
ATOM 1821 HH11 ARG A 112 76.879 103.170 57.485 1.00 0.00 H
ATOM 1822 HH12 ARG A 112 77.976 103.859 56.292 1.00 0.00 H
ATOM 1823 HH21 ARG A 112 79.009 101.260 54.813 1.00 0.00 H
ATOM 1824 HH22 ARG A 112 79.306 102.859 55.469 1.00 0.00 H
ATOM 1825 N GLN A 113 76.840 95.300 55.093 1.00 0.00 N
ATOM 1826 CA GLN A 113 76.678 94.244 54.010 1.00 0.00 C
ATOM 1827 C GLN A 113 76.417 92.818 54.533 1.00 0.00 C
ATOM 1828 O GLN A 113 76.354 91.884 53.700 1.00 0.00 O
ATOM 1829 CB GLN A 113 77.918 94.148 53.019 1.00 0.00 C
ATOM 1830 CG GLN A 113 78.218 95.442 52.254 1.00 0.00 C
ATOM 1831 CD GLN A 113 77.436 95.409 50.955 1.00 0.00 C
ATOM 1832 NE2 GLN A 113 78.138 95.469 49.825 1.00 0.00 N
ATOM 1833 OE1 GLN A 113 76.236 95.241 50.894 1.00 0.00 O
ATOM 1834 H GLN A 113 77.739 95.362 55.549 1.00 0.00 H
ATOM 1835 HA GLN A 113 75.838 94.630 53.432 1.00 0.00 H
ATOM 1836 HB2 GLN A 113 78.732 93.968 53.721 1.00 0.00 H
ATOM 1837 HB3 GLN A 113 77.738 93.307 52.350 1.00 0.00 H
ATOM 1838 HG2 GLN A 113 77.877 96.349 52.753 1.00 0.00 H
ATOM 1839 HG3 GLN A 113 79.277 95.486 51.999 1.00 0.00 H
ATOM 1840 HE21 GLN A 113 77.597 95.327 48.984 1.00 0.00 H
ATOM 1841 HE22 GLN A 113 79.147 95.471 49.767 1.00 0.00 H
ATOM 1842 N LEU A 114 76.293 92.473 55.820 1.00 0.00 N
ATOM 1843 CA LEU A 114 76.135 91.110 56.315 1.00 0.00 C
ATOM 1844 C LEU A 114 74.880 90.374 55.687 1.00 0.00 C
ATOM 1845 O LEU A 114 73.779 90.622 56.084 1.00 0.00 O
ATOM 1846 CB LEU A 114 76.118 90.930 57.858 1.00 0.00 C
ATOM 1847 CG LEU A 114 76.571 89.516 58.307 1.00 0.00 C
ATOM 1848 CD1 LEU A 114 78.094 89.424 58.328 1.00 0.00 C
ATOM 1849 CD2 LEU A 114 75.882 89.113 59.673 1.00 0.00 C
ATOM 1850 H LEU A 114 76.316 93.164 56.556 1.00 0.00 H
ATOM 1851 HA LEU A 114 77.033 90.593 55.976 1.00 0.00 H
ATOM 1852 HB2 LEU A 114 76.785 91.688 58.270 1.00 0.00 H
ATOM 1853 HB3 LEU A 114 75.133 91.152 58.269 1.00 0.00 H
ATOM 1854 HG LEU A 114 76.245 88.783 57.569 1.00 0.00 H
ATOM 1855 HD11 LEU A 114 78.256 88.393 58.641 1.00 0.00 H
ATOM 1856 HD12 LEU A 114 78.509 89.627 57.341 1.00 0.00 H
ATOM 1857 HD13 LEU A 114 78.380 90.171 59.069 1.00 0.00 H
ATOM 1858 HD21 LEU A 114 76.292 89.605 60.555 1.00 0.00 H
ATOM 1859 HD22 LEU A 114 74.830 89.285 59.443 1.00 0.00 H
ATOM 1860 HD23 LEU A 114 76.014 88.033 59.740 1.00 0.00 H
ATOM 1861 N LYS A 115 75.032 89.433 54.706 1.00 0.00 N
ATOM 1862 CA LYS A 115 73.882 88.845 53.908 1.00 0.00 C
ATOM 1863 C LYS A 115 73.278 87.662 54.643 1.00 0.00 C
ATOM 1864 O LYS A 115 72.084 87.465 54.502 1.00 0.00 O
ATOM 1865 CB LYS A 115 74.375 88.361 52.513 1.00 0.00 C
ATOM 1866 CG LYS A 115 75.305 89.286 51.688 1.00 0.00 C
ATOM 1867 CD LYS A 115 74.498 90.443 51.097 1.00 0.00 C
ATOM 1868 CE LYS A 115 75.128 91.204 49.965 1.00 0.00 C
ATOM 1869 NZ LYS A 115 74.098 91.512 48.917 1.00 0.00 N1+
ATOM 1870 H LYS A 115 75.990 89.216 54.473 1.00 0.00 H
ATOM 1871 HA LYS A 115 73.112 89.592 53.717 1.00 0.00 H
ATOM 1872 HB2 LYS A 115 74.817 87.387 52.721 1.00 0.00 H
ATOM 1873 HB3 LYS A 115 73.616 88.079 51.783 1.00 0.00 H
ATOM 1874 HG2 LYS A 115 76.192 89.582 52.248 1.00 0.00 H
ATOM 1875 HG3 LYS A 115 75.632 88.672 50.849 1.00 0.00 H
ATOM 1876 HD2 LYS A 115 73.492 90.098 50.855 1.00 0.00 H
ATOM 1877 HD3 LYS A 115 74.348 91.128 51.931 1.00 0.00 H
ATOM 1878 HE2 LYS A 115 75.597 92.116 50.334 1.00 0.00 H
ATOM 1879 HE3 LYS A 115 75.991 90.698 49.532 1.00 0.00 H
ATOM 1880 HZ1 LYS A 115 73.390 92.043 49.404 1.00 0.00 H
ATOM 1881 HZ2 LYS A 115 74.495 92.151 48.244 1.00 0.00 H
ATOM 1882 HZ3 LYS A 115 73.692 90.709 48.457 1.00 0.00 H
ATOM 1883 N SER A 116 74.070 86.892 55.426 1.00 0.00 N
ATOM 1884 CA SER A 116 73.774 85.613 56.090 1.00 0.00 C
ATOM 1885 C SER A 116 74.257 85.718 57.581 1.00 0.00 C
ATOM 1886 O SER A 116 75.316 86.300 57.820 1.00 0.00 O
ATOM 1887 CB SER A 116 74.457 84.482 55.295 1.00 0.00 C
ATOM 1888 OG SER A 116 74.452 83.172 55.778 1.00 0.00 O
ATOM 1889 H SER A 116 74.992 87.304 55.420 1.00 0.00 H
ATOM 1890 HA SER A 116 72.727 85.321 56.175 1.00 0.00 H
ATOM 1891 HB2 SER A 116 73.978 84.454 54.316 1.00 0.00 H
ATOM 1892 HB3 SER A 116 75.489 84.750 55.067 1.00 0.00 H
ATOM 1893 HG SER A 116 74.201 82.626 55.029 1.00 0.00 H
ATOM 1894 N VAL A 117 73.500 85.229 58.550 1.00 0.00 N
ATOM 1895 CA VAL A 117 73.830 85.223 60.045 1.00 0.00 C
ATOM 1896 C VAL A 117 73.219 84.070 60.826 1.00 0.00 C
ATOM 1897 O VAL A 117 72.060 83.766 60.786 1.00 0.00 O
ATOM 1898 CB VAL A 117 73.616 86.637 60.635 1.00 0.00 C
ATOM 1899 CG1 VAL A 117 72.127 87.030 60.890 1.00 0.00 C
ATOM 1900 CG2 VAL A 117 74.190 86.844 61.995 1.00 0.00 C
ATOM 1901 H VAL A 117 72.636 84.811 58.236 1.00 0.00 H
ATOM 1902 HA VAL A 117 74.913 85.099 60.049 1.00 0.00 H
ATOM 1903 HB VAL A 117 74.018 87.326 59.892 1.00 0.00 H
ATOM 1904 HG11 VAL A 117 71.716 86.590 61.799 1.00 0.00 H
ATOM 1905 HG12 VAL A 117 71.887 88.090 60.971 1.00 0.00 H
ATOM 1906 HG13 VAL A 117 71.535 86.744 60.020 1.00 0.00 H
ATOM 1907 HG21 VAL A 117 73.522 86.324 62.682 1.00 0.00 H
ATOM 1908 HG22 VAL A 117 75.219 86.525 62.155 1.00 0.00 H
ATOM 1909 HG23 VAL A 117 74.154 87.905 62.242 1.00 0.00 H
ATOM 1910 N HIE A 118 74.146 83.376 61.453 1.00 0.00 N
ATOM 1911 CA HIE A 118 73.904 82.033 62.104 1.00 0.00 C
ATOM 1912 C HIE A 118 74.378 81.984 63.483 1.00 0.00 C
ATOM 1913 O HIE A 118 75.575 81.689 63.739 1.00 0.00 O
ATOM 1914 CB HIE A 118 74.542 80.878 61.270 1.00 0.00 C
ATOM 1915 CG HIE A 118 74.298 79.446 61.775 1.00 0.00 C
ATOM 1916 CD2 HIE A 118 73.590 79.049 62.863 1.00 0.00 C
ATOM 1917 ND1 HIE A 118 74.953 78.302 61.250 1.00 0.00 N
ATOM 1918 CE1 HIE A 118 74.640 77.246 62.013 1.00 0.00 C
ATOM 1919 NE2 HIE A 118 73.651 77.640 62.894 1.00 0.00 N
ATOM 1920 H HIE A 118 75.117 83.636 61.359 1.00 0.00 H
ATOM 1921 HA HIE A 118 72.853 81.768 62.220 1.00 0.00 H
ATOM 1922 HB2 HIE A 118 74.160 81.018 60.259 1.00 0.00 H
ATOM 1923 HB3 HIE A 118 75.588 81.060 61.021 1.00 0.00 H
ATOM 1924 HD2 HIE A 118 73.058 79.624 63.607 1.00 0.00 H
ATOM 1925 HE1 HIE A 118 74.990 76.304 61.617 1.00 0.00 H
ATOM 1926 HE2 HIE A 118 73.308 76.999 63.594 1.00 0.00 H
ATOM 1927 N PHE A 119 73.452 82.214 64.410 1.00 0.00 N
ATOM 1928 CA PHE A 119 73.582 82.182 65.811 1.00 0.00 C
ATOM 1929 C PHE A 119 73.365 80.774 66.395 1.00 0.00 C
ATOM 1930 O PHE A 119 72.566 79.956 65.883 1.00 0.00 O
ATOM 1931 CB PHE A 119 72.348 83.005 66.312 1.00 0.00 C
ATOM 1932 CG PHE A 119 72.366 84.462 65.936 1.00 0.00 C
ATOM 1933 CD1 PHE A 119 73.271 85.334 66.553 1.00 0.00 C
ATOM 1934 CD2 PHE A 119 71.361 85.016 65.058 1.00 0.00 C
ATOM 1935 CE1 PHE A 119 73.242 86.722 66.249 1.00 0.00 C
ATOM 1936 CE2 PHE A 119 71.355 86.422 64.756 1.00 0.00 C
ATOM 1937 CZ PHE A 119 72.331 87.189 65.344 1.00 0.00 C
ATOM 1938 H PHE A 119 72.550 82.560 64.118 1.00 0.00 H
ATOM 1939 HA PHE A 119 74.518 82.599 66.182 1.00 0.00 H
ATOM 1940 HB2 PHE A 119 71.410 82.562 65.978 1.00 0.00 H
ATOM 1941 HB3 PHE A 119 72.381 83.007 67.401 1.00 0.00 H
ATOM 1942 HD1 PHE A 119 73.949 84.921 67.286 1.00 0.00 H
ATOM 1943 HD2 PHE A 119 70.624 84.397 64.567 1.00 0.00 H
ATOM 1944 HE1 PHE A 119 73.776 87.440 66.854 1.00 0.00 H
ATOM 1945 HE2 PHE A 119 70.647 86.802 64.034 1.00 0.00 H
ATOM 1946 HZ PHE A 119 72.174 88.254 65.250 1.00 0.00 H
ATOM 1947 N ARG A 120 74.165 80.414 67.410 1.00 0.00 N
ATOM 1948 CA ARG A 120 74.190 79.009 67.917 1.00 0.00 C
ATOM 1949 C ARG A 120 74.430 79.199 69.502 1.00 0.00 C
ATOM 1950 O ARG A 120 75.524 79.664 69.837 1.00 0.00 O
ATOM 1951 CB ARG A 120 75.316 78.224 67.233 1.00 0.00 C
ATOM 1952 CG ARG A 120 75.527 76.840 67.982 1.00 0.00 C
ATOM 1953 CD ARG A 120 76.392 75.948 67.031 1.00 0.00 C
ATOM 1954 NE ARG A 120 75.731 75.402 65.807 1.00 0.00 N
ATOM 1955 CZ ARG A 120 76.307 74.707 64.906 1.00 0.00 C
ATOM 1956 NH1 ARG A 120 77.485 74.139 64.979 1.00 0.00 N1+
ATOM 1957 NH2 ARG A 120 75.669 74.556 63.778 1.00 0.00 N
ATOM 1958 H ARG A 120 74.817 81.124 67.711 1.00 0.00 H
ATOM 1959 HA ARG A 120 73.303 78.440 67.641 1.00 0.00 H
ATOM 1960 HB2 ARG A 120 74.936 77.978 66.241 1.00 0.00 H
ATOM 1961 HB3 ARG A 120 76.268 78.753 67.279 1.00 0.00 H
ATOM 1962 HG2 ARG A 120 75.993 76.834 68.967 1.00 0.00 H
ATOM 1963 HG3 ARG A 120 74.551 76.355 68.017 1.00 0.00 H
ATOM 1964 HD2 ARG A 120 77.304 76.493 66.789 1.00 0.00 H
ATOM 1965 HD3 ARG A 120 76.772 75.129 67.643 1.00 0.00 H
ATOM 1966 HE ARG A 120 74.828 75.790 65.574 1.00 0.00 H
ATOM 1967 HH11 ARG A 120 78.007 74.199 65.841 1.00 0.00 H
ATOM 1968 HH12 ARG A 120 77.777 73.527 64.229 1.00 0.00 H
ATOM 1969 HH21 ARG A 120 74.661 74.492 63.807 1.00 0.00 H
ATOM 1970 HH22 ARG A 120 76.071 74.013 63.027 1.00 0.00 H
ATOM 1971 N ARG A 121 73.504 78.775 70.391 1.00 0.00 N
ATOM 1972 CA ARG A 121 73.611 78.852 71.868 1.00 0.00 C
ATOM 1973 C ARG A 121 73.623 80.215 72.563 1.00 0.00 C
ATOM 1974 O ARG A 121 74.411 80.514 73.452 1.00 0.00 O
ATOM 1975 CB ARG A 121 74.684 77.919 72.458 1.00 0.00 C
ATOM 1976 CG ARG A 121 74.474 76.420 72.029 1.00 0.00 C
ATOM 1977 CD ARG A 121 75.264 75.390 72.906 1.00 0.00 C
ATOM 1978 NE ARG A 121 76.732 75.650 72.946 1.00 0.00 N
ATOM 1979 CZ ARG A 121 77.669 75.075 72.246 1.00 0.00 C
ATOM 1980 NH1 ARG A 121 77.514 74.119 71.358 1.00 0.00 N1+
ATOM 1981 NH2 ARG A 121 78.869 75.420 72.435 1.00 0.00 N
ATOM 1982 H ARG A 121 72.695 78.246 70.095 1.00 0.00 H
ATOM 1983 HA ARG A 121 72.662 78.500 72.273 1.00 0.00 H
ATOM 1984 HB2 ARG A 121 75.652 78.299 72.133 1.00 0.00 H
ATOM 1985 HB3 ARG A 121 74.509 77.964 73.533 1.00 0.00 H
ATOM 1986 HG2 ARG A 121 73.421 76.191 72.192 1.00 0.00 H
ATOM 1987 HG3 ARG A 121 74.708 76.187 70.991 1.00 0.00 H
ATOM 1988 HD2 ARG A 121 74.871 75.498 73.917 1.00 0.00 H
ATOM 1989 HD3 ARG A 121 75.087 74.375 72.552 1.00 0.00 H
ATOM 1990 HE ARG A 121 77.041 76.215 73.724 1.00 0.00 H
ATOM 1991 HH11 ARG A 121 76.656 74.028 70.833 1.00 0.00 H
ATOM 1992 HH12 ARG A 121 78.350 73.715 70.960 1.00 0.00 H
ATOM 1993 HH21 ARG A 121 79.260 76.041 73.129 1.00 0.00 H
ATOM 1994 HH22 ARG A 121 79.581 75.020 71.841 1.00 0.00 H
ATOM 1995 N MET A 122 72.817 81.178 72.019 1.00 0.00 N
ATOM 1996 CA MET A 122 72.814 82.584 72.384 1.00 0.00 C
ATOM 1997 C MET A 122 71.518 83.006 73.102 1.00 0.00 C
ATOM 1998 O MET A 122 70.596 82.240 73.052 1.00 0.00 O
ATOM 1999 CB MET A 122 73.133 83.362 71.131 1.00 0.00 C
ATOM 2000 CG MET A 122 74.319 82.773 70.298 1.00 0.00 C
ATOM 2001 SD MET A 122 75.454 83.903 69.391 1.00 0.00 S
ATOM 2002 CE MET A 122 76.144 84.812 70.853 1.00 0.00 C
ATOM 2003 H MET A 122 72.149 80.844 71.339 1.00 0.00 H
ATOM 2004 HA MET A 122 73.525 82.804 73.181 1.00 0.00 H
ATOM 2005 HB2 MET A 122 72.234 83.407 70.516 1.00 0.00 H
ATOM 2006 HB3 MET A 122 73.277 84.401 71.428 1.00 0.00 H
ATOM 2007 HG2 MET A 122 74.961 82.124 70.894 1.00 0.00 H
ATOM 2008 HG3 MET A 122 73.779 82.231 69.522 1.00 0.00 H
ATOM 2009 HE1 MET A 122 76.613 85.763 70.600 1.00 0.00 H
ATOM 2010 HE2 MET A 122 75.267 84.984 71.478 1.00 0.00 H
ATOM 2011 HE3 MET A 122 76.921 84.275 71.396 1.00 0.00 H
ATOM 2012 N ILE A 123 71.523 84.190 73.593 1.00 0.00 N
ATOM 2013 CA ILE A 123 70.406 84.986 74.091 1.00 0.00 C
ATOM 2014 C ILE A 123 69.927 85.987 73.017 1.00 0.00 C
ATOM 2015 O ILE A 123 70.811 86.701 72.507 1.00 0.00 O
ATOM 2016 CB ILE A 123 70.722 85.622 75.472 1.00 0.00 C
ATOM 2017 CG1 ILE A 123 71.040 84.631 76.598 1.00 0.00 C
ATOM 2018 CG2 ILE A 123 69.381 86.248 75.915 1.00 0.00 C
ATOM 2019 CD1 ILE A 123 71.358 85.287 77.973 1.00 0.00 C
ATOM 2020 H ILE A 123 72.412 84.666 73.633 1.00 0.00 H
ATOM 2021 HA ILE A 123 69.605 84.259 74.222 1.00 0.00 H
ATOM 2022 HB ILE A 123 71.561 86.313 75.390 1.00 0.00 H
ATOM 2023 HG12 ILE A 123 70.329 83.806 76.565 1.00 0.00 H
ATOM 2024 HG13 ILE A 123 72.073 84.354 76.389 1.00 0.00 H
ATOM 2025 HG21 ILE A 123 68.611 85.492 76.069 1.00 0.00 H
ATOM 2026 HG22 ILE A 123 69.615 86.818 76.814 1.00 0.00 H
ATOM 2027 HG23 ILE A 123 69.091 87.008 75.189 1.00 0.00 H
ATOM 2028 HD11 ILE A 123 71.753 84.584 78.707 1.00 0.00 H
ATOM 2029 HD12 ILE A 123 72.062 86.107 77.829 1.00 0.00 H
ATOM 2030 HD13 ILE A 123 70.469 85.534 78.553 1.00 0.00 H
ATOM 2031 N VAL A 124 68.645 86.133 72.633 1.00 0.00 N
ATOM 2032 CA VAL A 124 68.095 87.019 71.603 1.00 0.00 C
ATOM 2033 C VAL A 124 66.845 87.648 72.222 1.00 0.00 C
ATOM 2034 O VAL A 124 66.165 86.908 72.941 1.00 0.00 O
ATOM 2035 CB VAL A 124 67.645 86.230 70.319 1.00 0.00 C
ATOM 2036 CG1 VAL A 124 67.234 87.036 69.127 1.00 0.00 C
ATOM 2037 CG2 VAL A 124 68.860 85.408 69.805 1.00 0.00 C
ATOM 2038 H VAL A 124 67.916 85.703 73.185 1.00 0.00 H
ATOM 2039 HA VAL A 124 68.744 87.870 71.397 1.00 0.00 H
ATOM 2040 HB VAL A 124 66.861 85.505 70.540 1.00 0.00 H
ATOM 2041 HG11 VAL A 124 68.039 87.625 68.689 1.00 0.00 H
ATOM 2042 HG12 VAL A 124 66.723 86.363 68.439 1.00 0.00 H
ATOM 2043 HG13 VAL A 124 66.413 87.701 69.397 1.00 0.00 H
ATOM 2044 HG21 VAL A 124 69.589 86.080 69.353 1.00 0.00 H
ATOM 2045 HG22 VAL A 124 69.315 84.652 70.444 1.00 0.00 H
ATOM 2046 HG23 VAL A 124 68.531 84.823 68.945 1.00 0.00 H
ATOM 2047 N SER A 125 66.533 88.913 71.894 1.00 0.00 N
ATOM 2048 CA SER A 125 65.163 89.400 72.185 1.00 0.00 C
ATOM 2049 C SER A 125 64.407 89.731 70.851 1.00 0.00 C
ATOM 2050 O SER A 125 64.933 89.580 69.739 1.00 0.00 O
ATOM 2051 CB SER A 125 65.343 90.589 73.172 1.00 0.00 C
ATOM 2052 OG SER A 125 65.740 91.721 72.461 1.00 0.00 O
ATOM 2053 H SER A 125 67.160 89.508 71.372 1.00 0.00 H
ATOM 2054 HA SER A 125 64.599 88.630 72.712 1.00 0.00 H
ATOM 2055 HB2 SER A 125 64.343 90.765 73.568 1.00 0.00 H
ATOM 2056 HB3 SER A 125 66.029 90.336 73.981 1.00 0.00 H
ATOM 2057 HG SER A 125 66.635 91.509 72.183 1.00 0.00 H
ATOM 2058 N ASP A 126 63.161 90.206 70.985 1.00 0.00 N
ATOM 2059 CA ASP A 126 62.379 90.689 69.800 1.00 0.00 C
ATOM 2060 C ASP A 126 62.898 91.944 69.212 1.00 0.00 C
ATOM 2061 O ASP A 126 62.715 92.095 68.049 1.00 0.00 O
ATOM 2062 CB ASP A 126 60.943 90.844 70.142 1.00 0.00 C
ATOM 2063 CG ASP A 126 60.600 91.818 71.210 1.00 0.00 C
ATOM 2064 OD1 ASP A 126 60.186 92.941 70.828 1.00 0.00 O
ATOM 2065 OD2 ASP A 126 60.758 91.572 72.405 1.00 0.00 O1-
ATOM 2066 H ASP A 126 62.598 90.148 71.821 1.00 0.00 H
ATOM 2067 HA ASP A 126 62.487 89.883 69.074 1.00 0.00 H
ATOM 2068 HB2 ASP A 126 60.479 91.270 69.253 1.00 0.00 H
ATOM 2069 HB3 ASP A 126 60.524 89.849 70.297 1.00 0.00 H
ATOM 2070 N LEU A 127 63.648 92.752 69.940 1.00 0.00 N
ATOM 2071 CA LEU A 127 64.199 94.027 69.411 1.00 0.00 C
ATOM 2072 C LEU A 127 65.489 93.725 68.620 1.00 0.00 C
ATOM 2073 O LEU A 127 65.690 94.443 67.633 1.00 0.00 O
ATOM 2074 CB LEU A 127 64.534 94.943 70.578 1.00 0.00 C
ATOM 2075 CG LEU A 127 65.245 96.258 70.233 1.00 0.00 C
ATOM 2076 CD1 LEU A 127 64.462 97.174 69.312 1.00 0.00 C
ATOM 2077 CD2 LEU A 127 65.685 96.972 71.480 1.00 0.00 C
ATOM 2078 H LEU A 127 63.632 92.648 70.945 1.00 0.00 H
ATOM 2079 HA LEU A 127 63.495 94.569 68.781 1.00 0.00 H
ATOM 2080 HB2 LEU A 127 63.574 95.143 71.055 1.00 0.00 H
ATOM 2081 HB3 LEU A 127 65.057 94.332 71.314 1.00 0.00 H
ATOM 2082 HG LEU A 127 66.201 95.977 69.790 1.00 0.00 H
ATOM 2083 HD11 LEU A 127 63.492 97.479 69.706 1.00 0.00 H
ATOM 2084 HD12 LEU A 127 65.090 98.059 69.216 1.00 0.00 H
ATOM 2085 HD13 LEU A 127 64.278 96.731 68.333 1.00 0.00 H
ATOM 2086 HD21 LEU A 127 66.392 96.323 71.996 1.00 0.00 H
ATOM 2087 HD22 LEU A 127 66.226 97.871 71.186 1.00 0.00 H
ATOM 2088 HD23 LEU A 127 64.758 97.126 72.033 1.00 0.00 H
ATOM 2089 N ASP A 128 66.331 92.794 68.910 1.00 0.00 N
ATOM 2090 CA ASP A 128 67.548 92.397 68.196 1.00 0.00 C
ATOM 2091 C ASP A 128 67.205 92.080 66.734 1.00 0.00 C
ATOM 2092 O ASP A 128 67.871 92.541 65.746 1.00 0.00 O
ATOM 2093 CB ASP A 128 68.246 91.262 68.955 1.00 0.00 C
ATOM 2094 CG ASP A 128 68.636 91.613 70.390 1.00 0.00 C
ATOM 2095 OD1 ASP A 128 69.548 92.381 70.669 1.00 0.00 O
ATOM 2096 OD2 ASP A 128 67.963 91.081 71.292 1.00 0.00 O1-
ATOM 2097 H ASP A 128 66.213 92.285 69.774 1.00 0.00 H
ATOM 2098 HA ASP A 128 68.230 93.231 68.031 1.00 0.00 H
ATOM 2099 HB2 ASP A 128 67.641 90.357 68.991 1.00 0.00 H
ATOM 2100 HB3 ASP A 128 69.119 90.941 68.388 1.00 0.00 H
ATOM 2101 N LEU A 129 66.174 91.276 66.580 1.00 0.00 N
ATOM 2102 CA LEU A 129 65.672 90.788 65.218 1.00 0.00 C
ATOM 2103 C LEU A 129 65.040 91.945 64.482 1.00 0.00 C
ATOM 2104 O LEU A 129 65.212 92.064 63.263 1.00 0.00 O
ATOM 2105 CB LEU A 129 64.524 89.694 65.361 1.00 0.00 C
ATOM 2106 CG LEU A 129 65.015 88.541 66.276 1.00 0.00 C
ATOM 2107 CD1 LEU A 129 63.799 87.733 66.647 1.00 0.00 C
ATOM 2108 CD2 LEU A 129 66.087 87.661 65.566 1.00 0.00 C
ATOM 2109 H LEU A 129 65.674 90.946 67.394 1.00 0.00 H
ATOM 2110 HA LEU A 129 66.551 90.340 64.755 1.00 0.00 H
ATOM 2111 HB2 LEU A 129 63.688 90.142 65.898 1.00 0.00 H
ATOM 2112 HB3 LEU A 129 64.246 89.240 64.410 1.00 0.00 H
ATOM 2113 HG LEU A 129 65.494 88.919 67.179 1.00 0.00 H
ATOM 2114 HD11 LEU A 129 63.154 88.262 67.347 1.00 0.00 H
ATOM 2115 HD12 LEU A 129 63.198 87.473 65.776 1.00 0.00 H
ATOM 2116 HD13 LEU A 129 64.173 86.829 67.129 1.00 0.00 H
ATOM 2117 HD21 LEU A 129 67.026 88.211 65.612 1.00 0.00 H
ATOM 2118 HD22 LEU A 129 66.202 86.709 66.085 1.00 0.00 H
ATOM 2119 HD23 LEU A 129 65.840 87.432 64.529 1.00 0.00 H
ATOM 2120 N ASP A 130 64.279 92.774 65.164 1.00 0.00 N
ATOM 2121 CA ASP A 130 63.707 93.977 64.649 1.00 0.00 C
ATOM 2122 C ASP A 130 64.744 95.082 64.171 1.00 0.00 C
ATOM 2123 O ASP A 130 64.662 95.468 62.979 1.00 0.00 O
ATOM 2124 CB ASP A 130 62.729 94.488 65.663 1.00 0.00 C
ATOM 2125 CG ASP A 130 62.020 95.694 65.130 1.00 0.00 C
ATOM 2126 OD1 ASP A 130 62.357 96.876 65.410 1.00 0.00 O
ATOM 2127 OD2 ASP A 130 61.162 95.524 64.218 1.00 0.00 O1-
ATOM 2128 H ASP A 130 64.282 92.586 66.157 1.00 0.00 H
ATOM 2129 HA ASP A 130 63.154 93.771 63.733 1.00 0.00 H
ATOM 2130 HB2 ASP A 130 61.973 93.730 65.864 1.00 0.00 H
ATOM 2131 HB3 ASP A 130 63.293 94.821 66.535 1.00 0.00 H
ATOM 2132 N ARG A 131 65.668 95.422 65.081 1.00 0.00 N
ATOM 2133 CA ARG A 131 66.848 96.223 64.727 1.00 0.00 C
ATOM 2134 C ARG A 131 67.601 95.736 63.534 1.00 0.00 C
ATOM 2135 O ARG A 131 67.896 96.604 62.667 1.00 0.00 O
ATOM 2136 CB ARG A 131 67.821 96.255 65.935 1.00 0.00 C
ATOM 2137 CG ARG A 131 67.357 97.298 66.978 1.00 0.00 C
ATOM 2138 CD ARG A 131 68.275 97.342 68.222 1.00 0.00 C
ATOM 2139 NE ARG A 131 69.690 97.559 67.775 1.00 0.00 N
ATOM 2140 CZ ARG A 131 70.711 97.405 68.619 1.00 0.00 C
ATOM 2141 NH1 ARG A 131 70.701 96.611 69.646 1.00 0.00 N1+
ATOM 2142 NH2 ARG A 131 71.753 98.129 68.498 1.00 0.00 N
ATOM 2143 H ARG A 131 65.563 95.094 66.031 1.00 0.00 H
ATOM 2144 HA ARG A 131 66.390 97.191 64.523 1.00 0.00 H
ATOM 2145 HB2 ARG A 131 67.904 95.289 66.433 1.00 0.00 H
ATOM 2146 HB3 ARG A 131 68.824 96.565 65.641 1.00 0.00 H
ATOM 2147 HG2 ARG A 131 67.359 98.239 66.427 1.00 0.00 H
ATOM 2148 HG3 ARG A 131 66.352 97.033 67.305 1.00 0.00 H
ATOM 2149 HD2 ARG A 131 68.096 98.226 68.835 1.00 0.00 H
ATOM 2150 HD3 ARG A 131 68.217 96.515 68.930 1.00 0.00 H
ATOM 2151 HE ARG A 131 69.775 98.256 67.050 1.00 0.00 H
ATOM 2152 HH11 ARG A 131 69.865 96.085 69.857 1.00 0.00 H
ATOM 2153 HH12 ARG A 131 71.354 96.770 70.400 1.00 0.00 H
ATOM 2154 HH21 ARG A 131 71.883 98.643 67.639 1.00 0.00 H
ATOM 2155 HH22 ARG A 131 72.546 97.814 69.039 1.00 0.00 H
ATOM 2156 N LEU A 132 67.849 94.403 63.482 1.00 0.00 N
ATOM 2157 CA LEU A 132 68.300 93.744 62.267 1.00 0.00 C
ATOM 2158 C LEU A 132 67.394 93.940 61.026 1.00 0.00 C
ATOM 2159 O LEU A 132 67.857 94.321 59.975 1.00 0.00 O
ATOM 2160 CB LEU A 132 68.488 92.332 62.785 1.00 0.00 C
ATOM 2161 CG LEU A 132 68.937 91.338 61.718 1.00 0.00 C
ATOM 2162 CD1 LEU A 132 70.059 91.897 60.778 1.00 0.00 C
ATOM 2163 CD2 LEU A 132 69.443 90.015 62.294 1.00 0.00 C
ATOM 2164 H LEU A 132 67.392 93.837 64.183 1.00 0.00 H
ATOM 2165 HA LEU A 132 69.251 94.124 61.894 1.00 0.00 H
ATOM 2166 HB2 LEU A 132 69.203 92.309 63.607 1.00 0.00 H
ATOM 2167 HB3 LEU A 132 67.652 91.857 63.298 1.00 0.00 H
ATOM 2168 HG LEU A 132 68.099 91.085 61.069 1.00 0.00 H
ATOM 2169 HD11 LEU A 132 70.447 91.094 60.151 1.00 0.00 H
ATOM 2170 HD12 LEU A 132 69.712 92.770 60.225 1.00 0.00 H
ATOM 2171 HD13 LEU A 132 70.896 92.187 61.412 1.00 0.00 H
ATOM 2172 HD21 LEU A 132 70.023 89.534 61.506 1.00 0.00 H
ATOM 2173 HD22 LEU A 132 70.081 90.288 63.135 1.00 0.00 H
ATOM 2174 HD23 LEU A 132 68.606 89.427 62.672 1.00 0.00 H
ATOM 2175 N ALA A 133 66.090 93.728 61.176 1.00 0.00 N
ATOM 2176 CA ALA A 133 65.206 93.668 60.018 1.00 0.00 C
ATOM 2177 C ALA A 133 65.034 95.017 59.331 1.00 0.00 C
ATOM 2178 O ALA A 133 64.959 95.028 58.064 1.00 0.00 O
ATOM 2179 CB ALA A 133 63.886 93.064 60.559 1.00 0.00 C
ATOM 2180 H ALA A 133 65.710 93.522 62.089 1.00 0.00 H
ATOM 2181 HA ALA A 133 65.654 93.003 59.279 1.00 0.00 H
ATOM 2182 HB1 ALA A 133 64.065 92.059 60.941 1.00 0.00 H
ATOM 2183 HB2 ALA A 133 63.450 93.725 61.308 1.00 0.00 H
ATOM 2184 HB3 ALA A 133 63.127 93.032 59.776 1.00 0.00 H
ATOM 2185 N LYS A 134 65.053 96.133 60.028 1.00 0.00 N
ATOM 2186 CA LYS A 134 64.986 97.471 59.403 1.00 0.00 C
ATOM 2187 C LYS A 134 66.396 97.689 58.754 1.00 0.00 C
ATOM 2188 O LYS A 134 66.348 98.238 57.659 1.00 0.00 O
ATOM 2189 CB LYS A 134 64.801 98.441 60.610 1.00 0.00 C
ATOM 2190 CG LYS A 134 63.361 98.785 61.061 1.00 0.00 C
ATOM 2191 CD LYS A 134 62.487 97.586 61.506 1.00 0.00 C
ATOM 2192 CE LYS A 134 61.097 98.102 62.020 1.00 0.00 C
ATOM 2193 NZ LYS A 134 61.143 98.381 63.500 1.00 0.00 N1+
ATOM 2194 H LYS A 134 64.998 96.075 61.034 1.00 0.00 H
ATOM 2195 HA LYS A 134 64.208 97.517 58.641 1.00 0.00 H
ATOM 2196 HB2 LYS A 134 65.333 98.107 61.500 1.00 0.00 H
ATOM 2197 HB3 LYS A 134 65.244 99.406 60.365 1.00 0.00 H
ATOM 2198 HG2 LYS A 134 63.430 99.454 61.918 1.00 0.00 H
ATOM 2199 HG3 LYS A 134 62.979 99.296 60.176 1.00 0.00 H
ATOM 2200 HD2 LYS A 134 62.473 96.871 60.683 1.00 0.00 H
ATOM 2201 HD3 LYS A 134 62.959 97.141 62.382 1.00 0.00 H
ATOM 2202 HE2 LYS A 134 60.704 98.961 61.477 1.00 0.00 H
ATOM 2203 HE3 LYS A 134 60.289 97.383 61.881 1.00 0.00 H
ATOM 2204 HZ1 LYS A 134 60.210 98.646 63.784 1.00 0.00 H
ATOM 2205 HZ2 LYS A 134 61.385 97.579 64.065 1.00 0.00 H
ATOM 2206 HZ3 LYS A 134 61.713 99.187 63.712 1.00 0.00 H
ATOM 2207 N ALA A 135 67.504 97.536 59.435 1.00 0.00 N
ATOM 2208 CA ALA A 135 68.845 97.939 59.065 1.00 0.00 C
ATOM 2209 C ALA A 135 69.268 97.334 57.666 1.00 0.00 C
ATOM 2210 O ALA A 135 69.885 98.004 56.874 1.00 0.00 O
ATOM 2211 CB ALA A 135 69.803 97.504 60.198 1.00 0.00 C
ATOM 2212 H ALA A 135 67.417 97.015 60.296 1.00 0.00 H
ATOM 2213 HA ALA A 135 68.878 99.023 58.958 1.00 0.00 H
ATOM 2214 HB1 ALA A 135 69.659 98.120 61.086 1.00 0.00 H
ATOM 2215 HB2 ALA A 135 69.856 96.423 60.324 1.00 0.00 H
ATOM 2216 HB3 ALA A 135 70.811 97.672 59.819 1.00 0.00 H
ATOM 2217 N ARG A 136 68.957 96.033 57.536 1.00 0.00 N
ATOM 2218 CA ARG A 136 69.382 95.081 56.504 1.00 0.00 C
ATOM 2219 C ARG A 136 68.258 94.803 55.500 1.00 0.00 C
ATOM 2220 O ARG A 136 68.601 94.639 54.272 1.00 0.00 O
ATOM 2221 CB ARG A 136 69.848 93.766 57.144 1.00 0.00 C
ATOM 2222 CG ARG A 136 71.128 93.786 57.944 1.00 0.00 C
ATOM 2223 CD ARG A 136 72.419 94.199 57.156 1.00 0.00 C
ATOM 2224 NE ARG A 136 72.712 93.337 56.006 1.00 0.00 N
ATOM 2225 CZ ARG A 136 72.737 93.599 54.693 1.00 0.00 C
ATOM 2226 NH1 ARG A 136 72.428 94.720 54.112 1.00 0.00 N1+
ATOM 2227 NH2 ARG A 136 72.902 92.605 53.891 1.00 0.00 N
ATOM 2228 H ARG A 136 68.549 95.562 58.331 1.00 0.00 H
ATOM 2229 HA ARG A 136 70.202 95.533 55.945 1.00 0.00 H
ATOM 2230 HB2 ARG A 136 69.058 93.410 57.805 1.00 0.00 H
ATOM 2231 HB3 ARG A 136 69.984 93.015 56.366 1.00 0.00 H
ATOM 2232 HG2 ARG A 136 70.920 94.485 58.755 1.00 0.00 H
ATOM 2233 HG3 ARG A 136 71.140 92.817 58.443 1.00 0.00 H
ATOM 2234 HD2 ARG A 136 72.294 95.247 56.883 1.00 0.00 H
ATOM 2235 HD3 ARG A 136 73.320 94.165 57.768 1.00 0.00 H
ATOM 2236 HE ARG A 136 72.921 92.378 56.246 1.00 0.00 H
ATOM 2237 HH11 ARG A 136 72.482 95.543 54.695 1.00 0.00 H
ATOM 2238 HH12 ARG A 136 72.633 94.865 53.134 1.00 0.00 H
ATOM 2239 HH21 ARG A 136 73.271 91.786 54.353 1.00 0.00 H
ATOM 2240 HH22 ARG A 136 72.880 92.790 52.898 1.00 0.00 H
ATOM 2241 N ALA A 137 67.009 94.769 55.985 1.00 0.00 N
ATOM 2242 CA ALA A 137 65.813 94.733 55.086 1.00 0.00 C
ATOM 2243 C ALA A 137 65.945 93.494 54.119 1.00 0.00 C
ATOM 2244 O ALA A 137 66.242 92.396 54.595 1.00 0.00 O
ATOM 2245 CB ALA A 137 65.469 96.084 54.550 1.00 0.00 C
ATOM 2246 H ALA A 137 66.939 94.722 56.991 1.00 0.00 H
ATOM 2247 HA ALA A 137 64.977 94.386 55.693 1.00 0.00 H
ATOM 2248 HB1 ALA A 137 66.145 96.316 53.727 1.00 0.00 H
ATOM 2249 HB2 ALA A 137 64.467 96.175 54.132 1.00 0.00 H
ATOM 2250 HB3 ALA A 137 65.664 96.746 55.394 1.00 0.00 H
ATOM 2251 N ASP A 138 65.499 93.646 52.900 1.00 0.00 N
ATOM 2252 CA ASP A 138 65.443 92.561 51.866 1.00 0.00 C
ATOM 2253 C ASP A 138 66.734 92.087 51.251 1.00 0.00 C
ATOM 2254 O ASP A 138 66.783 91.439 50.194 1.00 0.00 O
ATOM 2255 CB ASP A 138 64.331 92.910 50.868 1.00 0.00 C
ATOM 2256 CG ASP A 138 64.588 94.029 49.893 1.00 0.00 C
ATOM 2257 OD1 ASP A 138 65.471 94.950 50.239 1.00 0.00 O
ATOM 2258 OD2 ASP A 138 63.970 94.063 48.833 1.00 0.00 O1-
ATOM 2259 H ASP A 138 65.328 94.553 52.490 1.00 0.00 H
ATOM 2260 HA ASP A 138 65.079 91.659 52.357 1.00 0.00 H
ATOM 2261 HB2 ASP A 138 64.216 92.018 50.252 1.00 0.00 H
ATOM 2262 HB3 ASP A 138 63.416 93.108 51.427 1.00 0.00 H
ATOM 2263 N ASP A 139 67.852 92.506 51.843 1.00 0.00 N
ATOM 2264 CA ASP A 139 69.201 92.070 51.526 1.00 0.00 C
ATOM 2265 C ASP A 139 69.787 91.052 52.543 1.00 0.00 C
ATOM 2266 O ASP A 139 70.858 90.446 52.196 1.00 0.00 O
ATOM 2267 CB ASP A 139 70.251 93.253 51.350 1.00 0.00 C
ATOM 2268 CG ASP A 139 71.536 92.776 50.627 1.00 0.00 C
ATOM 2269 OD1 ASP A 139 71.429 92.349 49.449 1.00 0.00 O
ATOM 2270 OD2 ASP A 139 72.690 93.085 51.113 1.00 0.00 O1-
ATOM 2271 H ASP A 139 67.784 93.032 52.703 1.00 0.00 H
ATOM 2272 HA ASP A 139 69.126 91.472 50.618 1.00 0.00 H
ATOM 2273 HB2 ASP A 139 69.696 94.014 50.801 1.00 0.00 H
ATOM 2274 HB3 ASP A 139 70.545 93.590 52.344 1.00 0.00 H
ATOM 2275 N LEU A 140 69.152 90.808 53.735 1.00 0.00 N
ATOM 2276 CA LEU A 140 69.263 89.605 54.553 1.00 0.00 C
ATOM 2277 C LEU A 140 68.653 88.350 53.877 1.00 0.00 C
ATOM 2278 O LEU A 140 67.438 88.043 53.768 1.00 0.00 O
ATOM 2279 CB LEU A 140 68.713 89.813 55.998 1.00 0.00 C
ATOM 2280 CG LEU A 140 69.355 88.943 57.112 1.00 0.00 C
ATOM 2281 CD1 LEU A 140 70.810 89.272 57.366 1.00 0.00 C
ATOM 2282 CD2 LEU A 140 68.684 89.204 58.496 1.00 0.00 C
ATOM 2283 H LEU A 140 68.432 91.420 54.091 1.00 0.00 H
ATOM 2284 HA LEU A 140 70.332 89.394 54.585 1.00 0.00 H
ATOM 2285 HB2 LEU A 140 68.881 90.816 56.390 1.00 0.00 H
ATOM 2286 HB3 LEU A 140 67.627 89.744 56.067 1.00 0.00 H
ATOM 2287 HG LEU A 140 69.348 87.875 56.894 1.00 0.00 H
ATOM 2288 HD11 LEU A 140 70.831 90.330 57.628 1.00 0.00 H
ATOM 2289 HD12 LEU A 140 71.116 88.691 58.236 1.00 0.00 H
ATOM 2290 HD13 LEU A 140 71.524 88.977 56.597 1.00 0.00 H
ATOM 2291 HD21 LEU A 140 68.540 90.241 58.799 1.00 0.00 H
ATOM 2292 HD22 LEU A 140 67.732 88.677 58.429 1.00 0.00 H
ATOM 2293 HD23 LEU A 140 69.288 88.711 59.259 1.00 0.00 H
ATOM 2294 N GLU A 141 69.473 87.422 53.435 1.00 0.00 N
ATOM 2295 CA GLU A 141 69.178 86.147 52.631 1.00 0.00 C
ATOM 2296 C GLU A 141 68.920 84.938 53.582 1.00 0.00 C
ATOM 2297 O GLU A 141 68.231 84.014 53.269 1.00 0.00 O
ATOM 2298 CB GLU A 141 70.140 85.839 51.519 1.00 0.00 C
ATOM 2299 CG GLU A 141 71.573 85.467 51.941 1.00 0.00 C
ATOM 2300 CD GLU A 141 72.031 84.100 51.297 1.00 0.00 C
ATOM 2301 OE1 GLU A 141 72.064 83.070 52.066 1.00 0.00 O
ATOM 2302 OE2 GLU A 141 72.146 84.043 50.035 1.00 0.00 O1-
ATOM 2303 H GLU A 141 70.427 87.476 53.760 1.00 0.00 H
ATOM 2304 HA GLU A 141 68.165 86.227 52.237 1.00 0.00 H
ATOM 2305 HB2 GLU A 141 69.695 85.170 50.783 1.00 0.00 H
ATOM 2306 HB3 GLU A 141 70.277 86.729 50.904 1.00 0.00 H
ATOM 2307 HG2 GLU A 141 72.211 86.237 51.507 1.00 0.00 H
ATOM 2308 HG3 GLU A 141 71.744 85.436 53.017 1.00 0.00 H
ATOM 2309 N THR A 142 69.550 84.988 54.734 1.00 0.00 N
ATOM 2310 CA THR A 142 69.741 83.843 55.628 1.00 0.00 C
ATOM 2311 C THR A 142 69.871 84.305 57.142 1.00 0.00 C
ATOM 2312 O THR A 142 70.876 84.913 57.541 1.00 0.00 O
ATOM 2313 CB THR A 142 70.947 82.993 55.190 1.00 0.00 C
ATOM 2314 CG2 THR A 142 71.170 81.995 56.332 1.00 0.00 C
ATOM 2315 OG1 THR A 142 70.642 82.287 54.079 1.00 0.00 O
ATOM 2316 H THR A 142 70.151 85.774 54.939 1.00 0.00 H
ATOM 2317 HA THR A 142 68.886 83.166 55.610 1.00 0.00 H
ATOM 2318 HB THR A 142 71.843 83.581 54.993 1.00 0.00 H
ATOM 2319 HG1 THR A 142 71.161 82.709 53.391 1.00 0.00 H
ATOM 2320 HG21 THR A 142 71.678 81.114 55.938 1.00 0.00 H
ATOM 2321 HG22 THR A 142 71.702 82.517 57.128 1.00 0.00 H
ATOM 2322 HG23 THR A 142 70.250 81.599 56.763 1.00 0.00 H
ATOM 2323 N LEU A 143 68.825 83.892 57.979 1.00 0.00 N
ATOM 2324 CA LEU A 143 68.908 83.960 59.419 1.00 0.00 C
ATOM 2325 C LEU A 143 68.881 82.512 59.907 1.00 0.00 C
ATOM 2326 O LEU A 143 68.004 81.730 59.564 1.00 0.00 O
ATOM 2327 CB LEU A 143 67.723 84.827 59.853 1.00 0.00 C
ATOM 2328 CG LEU A 143 67.530 84.952 61.409 1.00 0.00 C
ATOM 2329 CD1 LEU A 143 68.466 85.925 61.987 1.00 0.00 C
ATOM 2330 CD2 LEU A 143 66.103 85.402 61.673 1.00 0.00 C
ATOM 2331 H LEU A 143 68.087 83.248 57.732 1.00 0.00 H
ATOM 2332 HA LEU A 143 69.846 84.378 59.784 1.00 0.00 H
ATOM 2333 HB2 LEU A 143 67.812 85.804 59.378 1.00 0.00 H
ATOM 2334 HB3 LEU A 143 66.805 84.406 59.443 1.00 0.00 H
ATOM 2335 HG LEU A 143 67.593 83.958 61.853 1.00 0.00 H
ATOM 2336 HD11 LEU A 143 69.477 85.552 61.823 1.00 0.00 H
ATOM 2337 HD12 LEU A 143 68.374 86.839 61.402 1.00 0.00 H
ATOM 2338 HD13 LEU A 143 68.178 86.029 63.033 1.00 0.00 H
ATOM 2339 HD21 LEU A 143 65.948 85.800 62.676 1.00 0.00 H
ATOM 2340 HD22 LEU A 143 65.818 86.133 60.916 1.00 0.00 H
ATOM 2341 HD23 LEU A 143 65.472 84.519 61.581 1.00 0.00 H
ATOM 2342 N LYS A 144 69.701 82.138 60.844 1.00 0.00 N
ATOM 2343 CA LYS A 144 69.650 80.874 61.578 1.00 0.00 C
ATOM 2344 C LYS A 144 69.957 81.069 63.061 1.00 0.00 C
ATOM 2345 O LYS A 144 70.791 81.803 63.520 1.00 0.00 O
ATOM 2346 CB LYS A 144 70.559 79.821 60.884 1.00 0.00 C
ATOM 2347 CG LYS A 144 70.461 79.796 59.377 1.00 0.00 C
ATOM 2348 CD LYS A 144 71.379 78.625 58.845 1.00 0.00 C
ATOM 2349 CE LYS A 144 71.374 78.579 57.363 1.00 0.00 C
ATOM 2350 NZ LYS A 144 72.745 78.490 56.828 1.00 0.00 N1+
ATOM 2351 H LYS A 144 70.483 82.741 61.055 1.00 0.00 H
ATOM 2352 HA LYS A 144 68.634 80.492 61.487 1.00 0.00 H
ATOM 2353 HB2 LYS A 144 71.577 80.120 61.135 1.00 0.00 H
ATOM 2354 HB3 LYS A 144 70.399 78.844 61.338 1.00 0.00 H
ATOM 2355 HG2 LYS A 144 69.447 79.516 59.090 1.00 0.00 H
ATOM 2356 HG3 LYS A 144 70.802 80.762 59.006 1.00 0.00 H
ATOM 2357 HD2 LYS A 144 72.426 78.812 59.085 1.00 0.00 H
ATOM 2358 HD3 LYS A 144 71.203 77.619 59.228 1.00 0.00 H
ATOM 2359 HE2 LYS A 144 70.752 77.843 56.853 1.00 0.00 H
ATOM 2360 HE3 LYS A 144 70.923 79.518 57.046 1.00 0.00 H
ATOM 2361 HZ1 LYS A 144 72.777 78.562 55.821 1.00 0.00 H
ATOM 2362 HZ2 LYS A 144 73.351 79.228 57.156 1.00 0.00 H
ATOM 2363 HZ3 LYS A 144 73.182 77.639 57.153 1.00 0.00 H
ATOM 2364 N LEU A 145 69.190 80.314 63.878 1.00 0.00 N
ATOM 2365 CA LEU A 145 69.206 80.197 65.347 1.00 0.00 C
ATOM 2366 C LEU A 145 69.252 78.686 65.807 1.00 0.00 C
ATOM 2367 O LEU A 145 68.185 78.207 66.186 1.00 0.00 O
ATOM 2368 CB LEU A 145 67.973 80.793 65.954 1.00 0.00 C
ATOM 2369 CG LEU A 145 67.950 82.319 65.978 1.00 0.00 C
ATOM 2370 CD1 LEU A 145 67.597 82.968 64.573 1.00 0.00 C
ATOM 2371 CD2 LEU A 145 66.834 82.647 66.900 1.00 0.00 C
ATOM 2372 H LEU A 145 68.375 79.953 63.403 1.00 0.00 H
ATOM 2373 HA LEU A 145 70.108 80.690 65.710 1.00 0.00 H
ATOM 2374 HB2 LEU A 145 67.068 80.477 65.435 1.00 0.00 H
ATOM 2375 HB3 LEU A 145 68.019 80.558 67.018 1.00 0.00 H
ATOM 2376 HG LEU A 145 68.848 82.708 66.459 1.00 0.00 H
ATOM 2377 HD11 LEU A 145 68.478 82.944 63.931 1.00 0.00 H
ATOM 2378 HD12 LEU A 145 66.693 82.486 64.200 1.00 0.00 H
ATOM 2379 HD13 LEU A 145 67.340 84.006 64.783 1.00 0.00 H
ATOM 2380 HD21 LEU A 145 65.884 82.331 66.470 1.00 0.00 H
ATOM 2381 HD22 LEU A 145 66.961 82.069 67.815 1.00 0.00 H
ATOM 2382 HD23 LEU A 145 66.837 83.721 67.087 1.00 0.00 H
ATOM 2383 N ASP A 146 70.464 78.016 65.906 1.00 0.00 N
ATOM 2384 CA ASP A 146 70.589 76.862 66.782 1.00 0.00 C
ATOM 2385 C ASP A 146 70.470 77.330 68.239 1.00 0.00 C
ATOM 2386 O ASP A 146 71.194 78.212 68.751 1.00 0.00 O
ATOM 2387 CB ASP A 146 71.946 76.177 66.454 1.00 0.00 C
ATOM 2388 CG ASP A 146 71.972 75.326 65.229 1.00 0.00 C
ATOM 2389 OD1 ASP A 146 71.102 74.480 65.046 1.00 0.00 O
ATOM 2390 OD2 ASP A 146 72.970 75.334 64.466 1.00 0.00 O1-
ATOM 2391 H ASP A 146 71.314 78.504 65.661 1.00 0.00 H
ATOM 2392 HA ASP A 146 69.909 76.030 66.599 1.00 0.00 H
ATOM 2393 HB2 ASP A 146 72.764 76.897 66.475 1.00 0.00 H
ATOM 2394 HB3 ASP A 146 72.164 75.526 67.301 1.00 0.00 H
ATOM 2395 N LYS A 147 69.682 76.582 69.023 1.00 0.00 N
ATOM 2396 CA LYS A 147 69.723 76.512 70.493 1.00 0.00 C
ATOM 2397 C LYS A 147 69.699 77.921 71.231 1.00 0.00 C
ATOM 2398 O LYS A 147 70.401 78.027 72.219 1.00 0.00 O
ATOM 2399 CB LYS A 147 70.953 75.659 70.943 1.00 0.00 C
ATOM 2400 CG LYS A 147 70.861 74.320 70.166 1.00 0.00 C
ATOM 2401 CD LYS A 147 71.427 73.136 71.037 1.00 0.00 C
ATOM 2402 CE LYS A 147 71.977 71.961 70.065 1.00 0.00 C
ATOM 2403 NZ LYS A 147 71.157 71.711 68.832 1.00 0.00 N1+
ATOM 2404 H LYS A 147 69.176 75.871 68.514 1.00 0.00 H
ATOM 2405 HA LYS A 147 68.797 76.048 70.832 1.00 0.00 H
ATOM 2406 HB2 LYS A 147 71.837 76.245 70.693 1.00 0.00 H
ATOM 2407 HB3 LYS A 147 70.836 75.575 72.024 1.00 0.00 H
ATOM 2408 HG2 LYS A 147 69.906 74.050 69.714 1.00 0.00 H
ATOM 2409 HG3 LYS A 147 71.584 74.422 69.356 1.00 0.00 H
ATOM 2410 HD2 LYS A 147 72.297 73.565 71.534 1.00 0.00 H
ATOM 2411 HD3 LYS A 147 70.600 72.652 71.555 1.00 0.00 H
ATOM 2412 HE2 LYS A 147 72.970 72.290 69.760 1.00 0.00 H
ATOM 2413 HE3 LYS A 147 72.112 71.058 70.661 1.00 0.00 H
ATOM 2414 HZ1 LYS A 147 70.762 72.484 68.316 1.00 0.00 H
ATOM 2415 HZ2 LYS A 147 71.668 71.211 68.119 1.00 0.00 H
ATOM 2416 HZ3 LYS A 147 70.418 71.037 68.975 1.00 0.00 H
ATOM 2417 N CYS A 148 68.995 78.884 70.708 1.00 0.00 N
ATOM 2418 CA CYS A 148 69.012 80.223 71.294 1.00 0.00 C
ATOM 2419 C CYS A 148 67.826 80.413 72.312 1.00 0.00 C
ATOM 2420 O CYS A 148 67.038 79.498 72.501 1.00 0.00 O
ATOM 2421 CB CYS A 148 69.017 81.232 70.172 1.00 0.00 C
ATOM 2422 SG CYS A 148 70.681 81.222 69.286 1.00 0.00 S
ATOM 2423 H CYS A 148 68.271 78.693 70.031 1.00 0.00 H
ATOM 2424 HA CYS A 148 69.962 80.396 71.800 1.00 0.00 H
ATOM 2425 HB2 CYS A 148 68.102 81.052 69.608 1.00 0.00 H
ATOM 2426 HB3 CYS A 148 68.956 82.258 70.536 1.00 0.00 H
ATOM 2427 HG CYS A 148 70.873 79.931 69.001 1.00 0.00 H
ATOM 2428 N SER A 149 67.763 81.580 73.036 1.00 0.00 N
ATOM 2429 CA SER A 149 66.867 81.787 74.173 1.00 0.00 C
ATOM 2430 C SER A 149 66.308 83.222 74.139 1.00 0.00 C
ATOM 2431 O SER A 149 66.971 84.177 73.732 1.00 0.00 O
ATOM 2432 CB SER A 149 67.457 81.329 75.518 1.00 0.00 C
ATOM 2433 OG SER A 149 68.782 81.798 75.632 1.00 0.00 O
ATOM 2434 H SER A 149 68.395 82.333 72.805 1.00 0.00 H
ATOM 2435 HA SER A 149 66.030 81.093 74.098 1.00 0.00 H
ATOM 2436 HB2 SER A 149 66.905 81.826 76.316 1.00 0.00 H
ATOM 2437 HB3 SER A 149 67.508 80.242 75.582 1.00 0.00 H
ATOM 2438 HG SER A 149 69.151 81.568 74.776 1.00 0.00 H
ATOM 2439 N GLY A 150 65.130 83.407 74.727 1.00 0.00 N
ATOM 2440 CA GLY A 150 64.679 84.706 75.134 1.00 0.00 C
ATOM 2441 C GLY A 150 63.898 85.694 74.248 1.00 0.00 C
ATOM 2442 O GLY A 150 63.437 86.762 74.698 1.00 0.00 O
ATOM 2443 H GLY A 150 64.607 82.610 75.062 1.00 0.00 H
ATOM 2444 HA2 GLY A 150 64.030 84.419 75.961 1.00 0.00 H
ATOM 2445 HA3 GLY A 150 65.448 85.224 75.706 1.00 0.00 H
ATOM 2446 N PHE A 151 63.743 85.392 72.938 1.00 0.00 N
ATOM 2447 CA PHE A 151 62.954 86.164 71.926 1.00 0.00 C
ATOM 2448 C PHE A 151 61.495 85.844 71.963 1.00 0.00 C
ATOM 2449 O PHE A 151 60.998 84.970 72.656 1.00 0.00 O
ATOM 2450 CB PHE A 151 63.542 85.904 70.551 1.00 0.00 C
ATOM 2451 CG PHE A 151 63.450 84.506 69.993 1.00 0.00 C
ATOM 2452 CD1 PHE A 151 64.502 83.601 70.192 1.00 0.00 C
ATOM 2453 CD2 PHE A 151 62.396 84.122 69.176 1.00 0.00 C
ATOM 2454 CE1 PHE A 151 64.426 82.305 69.627 1.00 0.00 C
ATOM 2455 CE2 PHE A 151 62.371 82.927 68.462 1.00 0.00 C
ATOM 2456 CZ PHE A 151 63.334 81.985 68.835 1.00 0.00 C
ATOM 2457 H PHE A 151 64.198 84.548 72.618 1.00 0.00 H
ATOM 2458 HA PHE A 151 63.088 87.201 72.235 1.00 0.00 H
ATOM 2459 HB2 PHE A 151 62.986 86.576 69.898 1.00 0.00 H
ATOM 2460 HB3 PHE A 151 64.588 86.212 70.573 1.00 0.00 H
ATOM 2461 HD1 PHE A 151 65.318 83.902 70.832 1.00 0.00 H
ATOM 2462 HD2 PHE A 151 61.484 84.693 69.077 1.00 0.00 H
ATOM 2463 HE1 PHE A 151 65.149 81.595 70.000 1.00 0.00 H
ATOM 2464 HE2 PHE A 151 61.515 82.649 67.865 1.00 0.00 H
ATOM 2465 HZ PHE A 151 63.274 80.993 68.412 1.00 0.00 H
ATOM 2466 N THR A 152 60.674 86.607 71.295 1.00 0.00 N
ATOM 2467 CA THR A 152 59.174 86.394 71.136 1.00 0.00 C
ATOM 2468 C THR A 152 58.833 86.578 69.665 1.00 0.00 C
ATOM 2469 O THR A 152 59.630 87.266 68.972 1.00 0.00 O
ATOM 2470 CB THR A 152 58.320 87.258 72.105 1.00 0.00 C
ATOM 2471 CG2 THR A 152 58.465 88.835 71.888 1.00 0.00 C
ATOM 2472 OG1 THR A 152 56.916 87.065 72.043 1.00 0.00 O
ATOM 2473 H THR A 152 61.084 87.423 70.863 1.00 0.00 H
ATOM 2474 HA THR A 152 58.815 85.383 71.328 1.00 0.00 H
ATOM 2475 HB THR A 152 58.585 87.099 73.150 1.00 0.00 H
ATOM 2476 HG1 THR A 152 56.788 86.170 72.365 1.00 0.00 H
ATOM 2477 HG21 THR A 152 59.470 89.255 71.865 1.00 0.00 H
ATOM 2478 HG22 THR A 152 58.047 88.969 70.890 1.00 0.00 H
ATOM 2479 HG23 THR A 152 57.764 89.406 72.496 1.00 0.00 H
ATOM 2480 N THR A 153 57.664 86.033 69.218 1.00 0.00 N
ATOM 2481 CA THR A 153 57.118 86.086 67.834 1.00 0.00 C
ATOM 2482 C THR A 153 57.033 87.451 67.090 1.00 0.00 C
ATOM 2483 O THR A 153 57.199 87.574 65.875 1.00 0.00 O
ATOM 2484 CB THR A 153 55.895 85.233 67.796 1.00 0.00 C
ATOM 2485 CG2 THR A 153 56.178 83.749 68.122 1.00 0.00 C
ATOM 2486 OG1 THR A 153 54.948 85.722 68.694 1.00 0.00 O
ATOM 2487 H THR A 153 57.005 85.609 69.855 1.00 0.00 H
ATOM 2488 HA THR A 153 57.827 85.495 67.254 1.00 0.00 H
ATOM 2489 HB THR A 153 55.445 85.287 66.805 1.00 0.00 H
ATOM 2490 HG1 THR A 153 54.530 86.562 68.490 1.00 0.00 H
ATOM 2491 HG21 THR A 153 56.488 83.191 67.239 1.00 0.00 H
ATOM 2492 HG22 THR A 153 56.968 83.642 68.866 1.00 0.00 H
ATOM 2493 HG23 THR A 153 55.179 83.333 68.248 1.00 0.00 H
ATOM 2494 N ASP A 154 56.950 88.526 67.877 1.00 0.00 N
ATOM 2495 CA ASP A 154 56.857 89.925 67.392 1.00 0.00 C
ATOM 2496 C ASP A 154 58.101 90.325 66.606 1.00 0.00 C
ATOM 2497 O ASP A 154 58.042 91.131 65.655 1.00 0.00 O
ATOM 2498 CB ASP A 154 56.431 90.934 68.492 1.00 0.00 C
ATOM 2499 CG ASP A 154 55.141 90.703 69.284 1.00 0.00 C
ATOM 2500 OD1 ASP A 154 54.577 89.580 69.239 1.00 0.00 O
ATOM 2501 OD2 ASP A 154 54.697 91.600 70.029 1.00 0.00 O1-
ATOM 2502 H ASP A 154 56.684 88.424 68.846 1.00 0.00 H
ATOM 2503 HA ASP A 154 56.024 89.937 66.689 1.00 0.00 H
ATOM 2504 HB2 ASP A 154 57.206 91.039 69.252 1.00 0.00 H
ATOM 2505 HB3 ASP A 154 56.450 91.876 67.944 1.00 0.00 H
ATOM 2506 N GLY A 155 59.305 89.849 66.967 1.00 0.00 N
ATOM 2507 CA GLY A 155 60.584 90.017 66.233 1.00 0.00 C
ATOM 2508 C GLY A 155 60.890 89.035 65.074 1.00 0.00 C
ATOM 2509 O GLY A 155 61.634 89.249 64.121 1.00 0.00 O
ATOM 2510 H GLY A 155 59.275 89.323 67.829 1.00 0.00 H
ATOM 2511 HA2 GLY A 155 60.440 91.047 65.908 1.00 0.00 H
ATOM 2512 HA3 GLY A 155 61.473 90.004 66.864 1.00 0.00 H
ATOM 2513 N LEU A 156 60.261 87.895 65.088 1.00 0.00 N
ATOM 2514 CA LEU A 156 60.087 87.037 63.898 1.00 0.00 C
ATOM 2515 C LEU A 156 59.121 87.631 62.826 1.00 0.00 C
ATOM 2516 O LEU A 156 59.446 87.719 61.648 1.00 0.00 O
ATOM 2517 CB LEU A 156 59.648 85.589 64.229 1.00 0.00 C
ATOM 2518 CG LEU A 156 60.480 84.694 65.204 1.00 0.00 C
ATOM 2519 CD1 LEU A 156 59.990 83.260 65.132 1.00 0.00 C
ATOM 2520 CD2 LEU A 156 61.941 84.677 64.886 1.00 0.00 C
ATOM 2521 H LEU A 156 59.857 87.594 65.964 1.00 0.00 H
ATOM 2522 HA LEU A 156 61.077 86.996 63.443 1.00 0.00 H
ATOM 2523 HB2 LEU A 156 58.585 85.639 64.462 1.00 0.00 H
ATOM 2524 HB3 LEU A 156 59.887 85.074 63.299 1.00 0.00 H
ATOM 2525 HG LEU A 156 60.305 85.069 66.212 1.00 0.00 H
ATOM 2526 HD11 LEU A 156 60.258 82.855 64.156 1.00 0.00 H
ATOM 2527 HD12 LEU A 156 60.248 82.695 66.027 1.00 0.00 H
ATOM 2528 HD13 LEU A 156 58.909 83.274 64.986 1.00 0.00 H
ATOM 2529 HD21 LEU A 156 62.217 85.730 64.820 1.00 0.00 H
ATOM 2530 HD22 LEU A 156 62.547 84.327 65.721 1.00 0.00 H
ATOM 2531 HD23 LEU A 156 62.110 84.082 63.988 1.00 0.00 H
ATOM 2532 N LEU A 157 57.955 88.165 63.310 1.00 0.00 N
ATOM 2533 CA LEU A 157 57.105 88.984 62.527 1.00 0.00 C
ATOM 2534 C LEU A 157 57.831 90.216 61.910 1.00 0.00 C
ATOM 2535 O LEU A 157 57.751 90.353 60.674 1.00 0.00 O
ATOM 2536 CB LEU A 157 55.843 89.408 63.131 1.00 0.00 C
ATOM 2537 CG LEU A 157 54.803 90.152 62.246 1.00 0.00 C
ATOM 2538 CD1 LEU A 157 54.405 89.289 61.053 1.00 0.00 C
ATOM 2539 CD2 LEU A 157 53.572 90.399 63.049 1.00 0.00 C
ATOM 2540 H LEU A 157 57.709 87.976 64.271 1.00 0.00 H
ATOM 2541 HA LEU A 157 56.897 88.292 61.711 1.00 0.00 H
ATOM 2542 HB2 LEU A 157 55.429 88.441 63.419 1.00 0.00 H
ATOM 2543 HB3 LEU A 157 55.998 89.974 64.049 1.00 0.00 H
ATOM 2544 HG LEU A 157 55.105 91.086 61.773 1.00 0.00 H
ATOM 2545 HD11 LEU A 157 53.948 88.341 61.338 1.00 0.00 H
ATOM 2546 HD12 LEU A 157 53.590 89.754 60.499 1.00 0.00 H
ATOM 2547 HD13 LEU A 157 55.260 89.130 60.397 1.00 0.00 H
ATOM 2548 HD21 LEU A 157 53.316 89.607 63.753 1.00 0.00 H
ATOM 2549 HD22 LEU A 157 53.783 91.263 63.679 1.00 0.00 H
ATOM 2550 HD23 LEU A 157 52.791 90.590 62.313 1.00 0.00 H
ATOM 2551 N SER A 158 58.745 90.862 62.593 1.00 0.00 N
ATOM 2552 CA SER A 158 59.533 91.902 61.955 1.00 0.00 C
ATOM 2553 C SER A 158 60.578 91.454 60.932 1.00 0.00 C
ATOM 2554 O SER A 158 60.613 92.026 59.842 1.00 0.00 O
ATOM 2555 CB SER A 158 60.205 92.801 63.013 1.00 0.00 C
ATOM 2556 OG SER A 158 60.830 93.914 62.365 1.00 0.00 O
ATOM 2557 H SER A 158 58.786 90.793 63.600 1.00 0.00 H
ATOM 2558 HA SER A 158 58.849 92.574 61.435 1.00 0.00 H
ATOM 2559 HB2 SER A 158 59.546 93.102 63.827 1.00 0.00 H
ATOM 2560 HB3 SER A 158 61.157 92.397 63.358 1.00 0.00 H
ATOM 2561 HG SER A 158 60.997 94.590 63.026 1.00 0.00 H
ATOM 2562 N ILE A 159 61.295 90.409 61.194 1.00 0.00 N
ATOM 2563 CA ILE A 159 62.215 89.858 60.182 1.00 0.00 C
ATOM 2564 C ILE A 159 61.497 89.559 58.872 1.00 0.00 C
ATOM 2565 O ILE A 159 61.723 90.131 57.790 1.00 0.00 O
ATOM 2566 CB ILE A 159 62.948 88.554 60.785 1.00 0.00 C
ATOM 2567 CG1 ILE A 159 64.119 89.008 61.642 1.00 0.00 C
ATOM 2568 CG2 ILE A 159 63.224 87.645 59.652 1.00 0.00 C
ATOM 2569 CD1 ILE A 159 65.469 89.425 60.996 1.00 0.00 C
ATOM 2570 H ILE A 159 61.250 89.903 62.067 1.00 0.00 H
ATOM 2571 HA ILE A 159 63.039 90.559 60.049 1.00 0.00 H
ATOM 2572 HB ILE A 159 62.218 87.973 61.349 1.00 0.00 H
ATOM 2573 HG12 ILE A 159 63.797 89.815 62.299 1.00 0.00 H
ATOM 2574 HG13 ILE A 159 64.361 88.143 62.260 1.00 0.00 H
ATOM 2575 HG21 ILE A 159 62.269 87.210 59.358 1.00 0.00 H
ATOM 2576 HG22 ILE A 159 63.657 88.265 58.866 1.00 0.00 H
ATOM 2577 HG23 ILE A 159 63.987 86.917 59.927 1.00 0.00 H
ATOM 2578 HD11 ILE A 159 66.022 88.555 60.641 1.00 0.00 H
ATOM 2579 HD12 ILE A 159 65.320 90.125 60.174 1.00 0.00 H
ATOM 2580 HD13 ILE A 159 66.139 89.901 61.713 1.00 0.00 H
ATOM 2581 N VAL A 160 60.359 88.852 58.867 1.00 0.00 N
ATOM 2582 CA VAL A 160 59.595 88.425 57.663 1.00 0.00 C
ATOM 2583 C VAL A 160 58.880 89.622 57.064 1.00 0.00 C
ATOM 2584 O VAL A 160 58.627 89.604 55.854 1.00 0.00 O
ATOM 2585 CB VAL A 160 58.656 87.196 57.923 1.00 0.00 C
ATOM 2586 CG1 VAL A 160 59.407 86.034 58.494 1.00 0.00 C
ATOM 2587 CG2 VAL A 160 57.397 87.479 58.799 1.00 0.00 C
ATOM 2588 H VAL A 160 60.017 88.465 59.734 1.00 0.00 H
ATOM 2589 HA VAL A 160 60.352 88.032 56.984 1.00 0.00 H
ATOM 2590 HB VAL A 160 58.214 86.908 56.969 1.00 0.00 H
ATOM 2591 HG11 VAL A 160 60.263 85.825 57.852 1.00 0.00 H
ATOM 2592 HG12 VAL A 160 59.739 86.273 59.504 1.00 0.00 H
ATOM 2593 HG13 VAL A 160 58.829 85.110 58.498 1.00 0.00 H
ATOM 2594 HG21 VAL A 160 56.749 86.618 58.960 1.00 0.00 H
ATOM 2595 HG22 VAL A 160 57.798 87.776 59.768 1.00 0.00 H
ATOM 2596 HG23 VAL A 160 56.802 88.367 58.583 1.00 0.00 H
ATOM 2597 N THR A 161 58.457 90.571 57.903 1.00 0.00 N
ATOM 2598 CA THR A 161 57.964 91.860 57.397 1.00 0.00 C
ATOM 2599 C THR A 161 58.953 92.508 56.443 1.00 0.00 C
ATOM 2600 O THR A 161 58.529 93.076 55.460 1.00 0.00 O
ATOM 2601 CB THR A 161 57.656 92.832 58.602 1.00 0.00 C
ATOM 2602 CG2 THR A 161 57.169 94.262 58.291 1.00 0.00 C
ATOM 2603 OG1 THR A 161 56.590 92.288 59.286 1.00 0.00 O
ATOM 2604 H THR A 161 58.515 90.427 58.901 1.00 0.00 H
ATOM 2605 HA THR A 161 57.067 91.608 56.831 1.00 0.00 H
ATOM 2606 HB THR A 161 58.471 92.834 59.326 1.00 0.00 H
ATOM 2607 HG1 THR A 161 56.987 91.566 59.778 1.00 0.00 H
ATOM 2608 HG21 THR A 161 56.802 94.701 59.218 1.00 0.00 H
ATOM 2609 HG22 THR A 161 58.010 94.869 57.955 1.00 0.00 H
ATOM 2610 HG23 THR A 161 56.363 94.351 57.563 1.00 0.00 H
ATOM 2611 N HIE A 162 60.217 92.509 56.788 1.00 0.00 N
ATOM 2612 CA HIE A 162 61.119 93.446 56.095 1.00 0.00 C
ATOM 2613 C HIE A 162 62.141 92.721 55.146 1.00 0.00 C
ATOM 2614 O HIE A 162 62.424 93.229 54.067 1.00 0.00 O
ATOM 2615 CB HIE A 162 61.780 94.250 57.174 1.00 0.00 C
ATOM 2616 CG HIE A 162 60.840 95.200 57.845 1.00 0.00 C
ATOM 2617 CD2 HIE A 162 60.615 95.129 59.165 1.00 0.00 C
ATOM 2618 ND1 HIE A 162 60.308 96.369 57.292 1.00 0.00 N
ATOM 2619 CE1 HIE A 162 59.602 96.954 58.288 1.00 0.00 C
ATOM 2620 NE2 HIE A 162 59.715 96.161 59.374 1.00 0.00 N
ATOM 2621 H HIE A 162 60.451 92.009 57.633 1.00 0.00 H
ATOM 2622 HA HIE A 162 60.598 94.035 55.341 1.00 0.00 H
ATOM 2623 HB2 HIE A 162 62.297 93.579 57.861 1.00 0.00 H
ATOM 2624 HB3 HIE A 162 62.528 94.918 56.747 1.00 0.00 H
ATOM 2625 HD2 HIE A 162 60.974 94.420 59.897 1.00 0.00 H
ATOM 2626 HE1 HIE A 162 59.088 97.903 58.247 1.00 0.00 H
ATOM 2627 HE2 HIE A 162 59.326 96.442 60.263 1.00 0.00 H
ATOM 2628 N CYS A 163 62.645 91.547 55.559 1.00 0.00 N
ATOM 2629 CA CYS A 163 63.463 90.581 54.806 1.00 0.00 C
ATOM 2630 C CYS A 163 62.682 89.751 53.877 1.00 0.00 C
ATOM 2631 O CYS A 163 62.527 88.556 53.954 1.00 0.00 O
ATOM 2632 CB CYS A 163 64.240 89.769 55.831 1.00 0.00 C
ATOM 2633 SG CYS A 163 64.879 90.834 57.141 1.00 0.00 S
ATOM 2634 H CYS A 163 62.360 91.258 56.484 1.00 0.00 H
ATOM 2635 HA CYS A 163 64.175 91.080 54.148 1.00 0.00 H
ATOM 2636 HB2 CYS A 163 63.581 89.087 56.369 1.00 0.00 H
ATOM 2637 HB3 CYS A 163 64.985 89.191 55.284 1.00 0.00 H
ATOM 2638 HG CYS A 163 65.642 91.482 56.255 1.00 0.00 H
ATOM 2639 N ARG A 164 61.967 90.452 52.920 1.00 0.00 N
ATOM 2640 CA ARG A 164 60.905 89.836 52.042 1.00 0.00 C
ATOM 2641 C ARG A 164 61.342 88.745 51.015 1.00 0.00 C
ATOM 2642 O ARG A 164 60.487 87.914 50.695 1.00 0.00 O
ATOM 2643 CB ARG A 164 60.232 91.034 51.244 1.00 0.00 C
ATOM 2644 CG ARG A 164 59.215 91.873 52.063 1.00 0.00 C
ATOM 2645 CD ARG A 164 58.190 90.951 52.555 1.00 0.00 C
ATOM 2646 NE ARG A 164 56.962 91.683 52.937 1.00 0.00 N
ATOM 2647 CZ ARG A 164 56.073 91.451 53.846 1.00 0.00 C
ATOM 2648 NH1 ARG A 164 56.176 90.571 54.774 1.00 0.00 N1+
ATOM 2649 NH2 ARG A 164 54.907 92.123 53.907 1.00 0.00 N
ATOM 2650 H ARG A 164 62.011 91.456 53.026 1.00 0.00 H
ATOM 2651 HA ARG A 164 60.173 89.438 52.744 1.00 0.00 H
ATOM 2652 HB2 ARG A 164 61.042 91.599 50.781 1.00 0.00 H
ATOM 2653 HB3 ARG A 164 59.765 90.685 50.324 1.00 0.00 H
ATOM 2654 HG2 ARG A 164 59.721 92.506 52.793 1.00 0.00 H
ATOM 2655 HG3 ARG A 164 58.809 92.572 51.331 1.00 0.00 H
ATOM 2656 HD2 ARG A 164 57.970 90.285 51.720 1.00 0.00 H
ATOM 2657 HD3 ARG A 164 58.547 90.502 53.481 1.00 0.00 H
ATOM 2658 HE ARG A 164 56.684 92.462 52.358 1.00 0.00 H
ATOM 2659 HH11 ARG A 164 57.030 90.033 54.814 1.00 0.00 H
ATOM 2660 HH12 ARG A 164 55.316 90.370 55.262 1.00 0.00 H
ATOM 2661 HH21 ARG A 164 54.942 93.031 53.467 1.00 0.00 H
ATOM 2662 HH22 ARG A 164 54.225 91.910 54.622 1.00 0.00 H
ATOM 2663 N LYS A 165 62.588 88.615 50.712 1.00 0.00 N
ATOM 2664 CA LYS A 165 63.122 87.566 49.823 1.00 0.00 C
ATOM 2665 C LYS A 165 63.995 86.556 50.622 1.00 0.00 C
ATOM 2666 O LYS A 165 64.868 85.903 50.012 1.00 0.00 O
ATOM 2667 CB LYS A 165 63.791 88.131 48.559 1.00 0.00 C
ATOM 2668 CG LYS A 165 62.875 89.278 47.885 1.00 0.00 C
ATOM 2669 CD LYS A 165 63.215 89.918 46.483 1.00 0.00 C
ATOM 2670 CE LYS A 165 62.108 90.987 46.131 1.00 0.00 C
ATOM 2671 NZ LYS A 165 62.385 91.596 44.861 1.00 0.00 N1+
ATOM 2672 H LYS A 165 63.220 89.214 51.225 1.00 0.00 H
ATOM 2673 HA LYS A 165 62.236 87.017 49.505 1.00 0.00 H
ATOM 2674 HB2 LYS A 165 64.739 88.593 48.835 1.00 0.00 H
ATOM 2675 HB3 LYS A 165 63.977 87.331 47.842 1.00 0.00 H
ATOM 2676 HG2 LYS A 165 61.889 88.818 47.826 1.00 0.00 H
ATOM 2677 HG3 LYS A 165 62.783 90.091 48.605 1.00 0.00 H
ATOM 2678 HD2 LYS A 165 64.220 90.328 46.380 1.00 0.00 H
ATOM 2679 HD3 LYS A 165 63.173 89.090 45.776 1.00 0.00 H
ATOM 2680 HE2 LYS A 165 61.126 90.517 46.186 1.00 0.00 H
ATOM 2681 HE3 LYS A 165 62.025 91.755 46.899 1.00 0.00 H
ATOM 2682 HZ1 LYS A 165 62.188 90.895 44.160 1.00 0.00 H
ATOM 2683 HZ2 LYS A 165 61.765 92.374 44.690 1.00 0.00 H
ATOM 2684 HZ3 LYS A 165 63.332 91.943 44.806 1.00 0.00 H
ATOM 2685 N ILE A 166 63.879 86.418 51.886 1.00 0.00 N
ATOM 2686 CA ILE A 166 64.702 85.550 52.696 1.00 0.00 C
ATOM 2687 C ILE A 166 64.588 84.155 52.227 1.00 0.00 C
ATOM 2688 O ILE A 166 63.538 83.656 51.812 1.00 0.00 O
ATOM 2689 CB ILE A 166 64.386 85.696 54.186 1.00 0.00 C
ATOM 2690 CG1 ILE A 166 65.465 84.895 55.066 1.00 0.00 C
ATOM 2691 CG2 ILE A 166 63.020 85.236 54.423 1.00 0.00 C
ATOM 2692 CD1 ILE A 166 65.342 84.844 56.583 1.00 0.00 C
ATOM 2693 H ILE A 166 63.222 86.981 52.408 1.00 0.00 H
ATOM 2694 HA ILE A 166 65.729 85.838 52.473 1.00 0.00 H
ATOM 2695 HB ILE A 166 64.424 86.740 54.498 1.00 0.00 H
ATOM 2696 HG12 ILE A 166 65.616 83.845 54.814 1.00 0.00 H
ATOM 2697 HG13 ILE A 166 66.465 85.280 54.867 1.00 0.00 H
ATOM 2698 HG21 ILE A 166 62.829 85.330 55.492 1.00 0.00 H
ATOM 2699 HG22 ILE A 166 62.280 85.806 53.861 1.00 0.00 H
ATOM 2700 HG23 ILE A 166 62.792 84.186 54.242 1.00 0.00 H
ATOM 2701 HD11 ILE A 166 66.267 84.500 57.048 1.00 0.00 H
ATOM 2702 HD12 ILE A 166 64.983 85.838 56.849 1.00 0.00 H
ATOM 2703 HD13 ILE A 166 64.605 84.062 56.765 1.00 0.00 H
ATOM 2704 N LYS A 167 65.757 83.495 52.083 1.00 0.00 N
ATOM 2705 CA LYS A 167 65.897 82.153 51.459 1.00 0.00 C
ATOM 2706 C LYS A 167 66.155 81.092 52.514 1.00 0.00 C
ATOM 2707 O LYS A 167 65.744 79.992 52.288 1.00 0.00 O
ATOM 2708 CB LYS A 167 67.023 82.203 50.384 1.00 0.00 C
ATOM 2709 CG LYS A 167 66.629 83.217 49.264 1.00 0.00 C
ATOM 2710 CD LYS A 167 66.962 82.530 47.924 1.00 0.00 C
ATOM 2711 CE LYS A 167 67.614 83.542 46.968 1.00 0.00 C
ATOM 2712 NZ LYS A 167 68.061 82.902 45.672 1.00 0.00 N1+
ATOM 2713 H LYS A 167 66.582 83.953 52.443 1.00 0.00 H
ATOM 2714 HA LYS A 167 64.977 81.876 50.944 1.00 0.00 H
ATOM 2715 HB2 LYS A 167 67.887 82.644 50.882 1.00 0.00 H
ATOM 2716 HB3 LYS A 167 67.232 81.204 50.001 1.00 0.00 H
ATOM 2717 HG2 LYS A 167 65.558 83.389 49.158 1.00 0.00 H
ATOM 2718 HG3 LYS A 167 67.123 84.152 49.530 1.00 0.00 H
ATOM 2719 HD2 LYS A 167 67.717 81.752 48.044 1.00 0.00 H
ATOM 2720 HD3 LYS A 167 66.065 82.059 47.523 1.00 0.00 H
ATOM 2721 HE2 LYS A 167 66.920 84.360 46.777 1.00 0.00 H
ATOM 2722 HE3 LYS A 167 68.469 84.022 47.444 1.00 0.00 H
ATOM 2723 HZ1 LYS A 167 67.285 82.459 45.202 1.00 0.00 H
ATOM 2724 HZ2 LYS A 167 68.408 83.596 45.026 1.00 0.00 H
ATOM 2725 HZ3 LYS A 167 68.864 82.335 45.904 1.00 0.00 H
ATOM 2726 N THR A 168 66.741 81.385 53.699 1.00 0.00 N
ATOM 2727 CA THR A 168 66.757 80.450 54.818 1.00 0.00 C
ATOM 2728 C THR A 168 66.384 81.055 56.132 1.00 0.00 C
ATOM 2729 O THR A 168 66.902 82.121 56.436 1.00 0.00 O
ATOM 2730 CB THR A 168 68.061 79.769 55.007 1.00 0.00 C
ATOM 2731 CG2 THR A 168 68.090 78.769 56.075 1.00 0.00 C
ATOM 2732 OG1 THR A 168 68.330 79.009 53.840 1.00 0.00 O
ATOM 2733 H THR A 168 67.284 82.230 53.801 1.00 0.00 H
ATOM 2734 HA THR A 168 66.031 79.665 54.606 1.00 0.00 H
ATOM 2735 HB THR A 168 68.880 80.478 55.129 1.00 0.00 H
ATOM 2736 HG1 THR A 168 68.847 79.543 53.233 1.00 0.00 H
ATOM 2737 HG21 THR A 168 68.227 79.249 57.044 1.00 0.00 H
ATOM 2738 HG22 THR A 168 67.096 78.326 56.138 1.00 0.00 H
ATOM 2739 HG23 THR A 168 68.905 78.072 55.883 1.00 0.00 H
ATOM 2740 N LEU A 169 65.503 80.367 56.844 1.00 0.00 N
ATOM 2741 CA LEU A 169 65.141 80.750 58.191 1.00 0.00 C
ATOM 2742 C LEU A 169 65.213 79.492 59.029 1.00 0.00 C
ATOM 2743 O LEU A 169 64.528 78.483 58.762 1.00 0.00 O
ATOM 2744 CB LEU A 169 63.678 81.349 58.227 1.00 0.00 C
ATOM 2745 CG LEU A 169 63.105 81.466 59.656 1.00 0.00 C
ATOM 2746 CD1 LEU A 169 63.898 82.465 60.554 1.00 0.00 C
ATOM 2747 CD2 LEU A 169 61.655 82.069 59.440 1.00 0.00 C
ATOM 2748 H LEU A 169 65.090 79.514 56.496 1.00 0.00 H
ATOM 2749 HA LEU A 169 65.834 81.524 58.522 1.00 0.00 H
ATOM 2750 HB2 LEU A 169 63.603 82.357 57.820 1.00 0.00 H
ATOM 2751 HB3 LEU A 169 63.047 80.649 57.679 1.00 0.00 H
ATOM 2752 HG LEU A 169 63.011 80.494 60.142 1.00 0.00 H
ATOM 2753 HD11 LEU A 169 64.127 83.383 60.013 1.00 0.00 H
ATOM 2754 HD12 LEU A 169 63.425 82.675 61.513 1.00 0.00 H
ATOM 2755 HD13 LEU A 169 64.829 82.037 60.924 1.00 0.00 H
ATOM 2756 HD21 LEU A 169 61.703 82.872 58.704 1.00 0.00 H
ATOM 2757 HD22 LEU A 169 60.980 81.337 58.996 1.00 0.00 H
ATOM 2758 HD23 LEU A 169 61.220 82.388 60.387 1.00 0.00 H
ATOM 2759 N LEU A 170 66.015 79.595 60.067 1.00 0.00 N
ATOM 2760 CA LEU A 170 66.258 78.461 60.967 1.00 0.00 C
ATOM 2761 C LEU A 170 66.170 78.804 62.408 1.00 0.00 C
ATOM 2762 O LEU A 170 66.695 79.796 62.862 1.00 0.00 O
ATOM 2763 CB LEU A 170 67.554 77.688 60.476 1.00 0.00 C
ATOM 2764 CG LEU A 170 67.925 76.409 61.246 1.00 0.00 C
ATOM 2765 CD1 LEU A 170 68.589 75.360 60.413 1.00 0.00 C
ATOM 2766 CD2 LEU A 170 68.790 76.678 62.446 1.00 0.00 C
ATOM 2767 H LEU A 170 66.553 80.450 60.063 1.00 0.00 H
ATOM 2768 HA LEU A 170 65.402 77.814 60.774 1.00 0.00 H
ATOM 2769 HB2 LEU A 170 67.344 77.373 59.455 1.00 0.00 H
ATOM 2770 HB3 LEU A 170 68.478 78.258 60.373 1.00 0.00 H
ATOM 2771 HG LEU A 170 66.976 76.031 61.626 1.00 0.00 H
ATOM 2772 HD11 LEU A 170 69.523 75.835 60.113 1.00 0.00 H
ATOM 2773 HD12 LEU A 170 68.776 74.398 60.891 1.00 0.00 H
ATOM 2774 HD13 LEU A 170 68.055 75.213 59.474 1.00 0.00 H
ATOM 2775 HD21 LEU A 170 68.438 77.485 63.089 1.00 0.00 H
ATOM 2776 HD22 LEU A 170 68.752 75.841 63.143 1.00 0.00 H
ATOM 2777 HD23 LEU A 170 69.783 76.957 62.093 1.00 0.00 H
ATOM 2778 N MET A 171 65.674 77.842 63.218 1.00 0.00 N
ATOM 2779 CA MET A 171 65.369 78.020 64.643 1.00 0.00 C
ATOM 2780 C MET A 171 65.410 76.732 65.398 1.00 0.00 C
ATOM 2781 O MET A 171 64.806 76.485 66.430 1.00 0.00 O
ATOM 2782 CB MET A 171 63.982 78.643 64.862 1.00 0.00 C
ATOM 2783 CG MET A 171 64.010 80.200 64.729 1.00 0.00 C
ATOM 2784 SD MET A 171 62.376 80.838 64.949 1.00 0.00 S
ATOM 2785 CE MET A 171 61.413 80.070 63.652 1.00 0.00 C
ATOM 2786 H MET A 171 65.224 77.066 62.753 1.00 0.00 H
ATOM 2787 HA MET A 171 66.150 78.662 65.050 1.00 0.00 H
ATOM 2788 HB2 MET A 171 63.313 78.163 64.147 1.00 0.00 H
ATOM 2789 HB3 MET A 171 63.623 78.394 65.861 1.00 0.00 H
ATOM 2790 HG2 MET A 171 64.568 80.713 65.512 1.00 0.00 H
ATOM 2791 HG3 MET A 171 64.433 80.548 63.786 1.00 0.00 H
ATOM 2792 HE1 MET A 171 61.480 78.982 63.672 1.00 0.00 H
ATOM 2793 HE2 MET A 171 60.340 80.222 63.774 1.00 0.00 H
ATOM 2794 HE3 MET A 171 61.739 80.332 62.645 1.00 0.00 H
ATOM 2795 N GLU A 172 66.361 75.832 65.039 1.00 0.00 N
ATOM 2796 CA GLU A 172 66.404 74.466 65.614 1.00 0.00 C
ATOM 2797 C GLU A 172 66.741 74.428 67.090 1.00 0.00 C
ATOM 2798 O GLU A 172 67.775 74.883 67.508 1.00 0.00 O
ATOM 2799 CB GLU A 172 67.284 73.526 64.815 1.00 0.00 C
ATOM 2800 CG GLU A 172 67.163 72.106 65.305 1.00 0.00 C
ATOM 2801 CD GLU A 172 67.758 71.021 64.402 1.00 0.00 C
ATOM 2802 OE1 GLU A 172 68.377 71.460 63.427 1.00 0.00 O
ATOM 2803 OE2 GLU A 172 67.707 69.781 64.593 1.00 0.00 O1-
ATOM 2804 H GLU A 172 66.986 76.016 64.266 1.00 0.00 H
ATOM 2805 HA GLU A 172 65.452 73.970 65.425 1.00 0.00 H
ATOM 2806 HB2 GLU A 172 66.914 73.553 63.790 1.00 0.00 H
ATOM 2807 HB3 GLU A 172 68.331 73.822 64.763 1.00 0.00 H
ATOM 2808 HG2 GLU A 172 67.573 71.964 66.305 1.00 0.00 H
ATOM 2809 HG3 GLU A 172 66.087 71.941 65.366 1.00 0.00 H
ATOM 2810 N GLU A 173 65.814 73.725 67.858 1.00 0.00 N
ATOM 2811 CA GLU A 173 65.983 73.486 69.363 1.00 0.00 C
ATOM 2812 C GLU A 173 66.153 74.773 70.167 1.00 0.00 C
ATOM 2813 O GLU A 173 66.817 74.790 71.204 1.00 0.00 O
ATOM 2814 CB GLU A 173 67.041 72.433 69.630 1.00 0.00 C
ATOM 2815 CG GLU A 173 66.794 71.047 69.095 1.00 0.00 C
ATOM 2816 CD GLU A 173 68.006 70.048 69.349 1.00 0.00 C
ATOM 2817 OE1 GLU A 173 69.010 70.113 68.642 1.00 0.00 O
ATOM 2818 OE2 GLU A 173 67.951 69.144 70.256 1.00 0.00 O1-
ATOM 2819 H GLU A 173 65.146 73.134 67.384 1.00 0.00 H
ATOM 2820 HA GLU A 173 65.067 73.003 69.701 1.00 0.00 H
ATOM 2821 HB2 GLU A 173 67.977 72.804 69.212 1.00 0.00 H
ATOM 2822 HB3 GLU A 173 67.169 72.264 70.699 1.00 0.00 H
ATOM 2823 HG2 GLU A 173 65.915 70.654 69.607 1.00 0.00 H
ATOM 2824 HG3 GLU A 173 66.565 71.136 68.033 1.00 0.00 H
ATOM 2825 N SER A 174 65.572 75.897 69.685 1.00 0.00 N
ATOM 2826 CA SER A 174 65.492 77.197 70.359 1.00 0.00 C
ATOM 2827 C SER A 174 64.387 77.391 71.404 1.00 0.00 C
ATOM 2828 O SER A 174 63.380 76.721 71.337 1.00 0.00 O
ATOM 2829 CB SER A 174 65.572 78.294 69.301 1.00 0.00 C
ATOM 2830 OG SER A 174 66.962 78.308 68.854 1.00 0.00 O
ATOM 2831 H SER A 174 65.078 75.882 68.804 1.00 0.00 H
ATOM 2832 HA SER A 174 66.377 77.362 70.975 1.00 0.00 H
ATOM 2833 HB2 SER A 174 64.844 78.111 68.511 1.00 0.00 H
ATOM 2834 HB3 SER A 174 65.363 79.278 69.722 1.00 0.00 H
ATOM 2835 HG SER A 174 66.880 77.757 68.072 1.00 0.00 H
ATOM 2836 N SER A 175 64.516 78.337 72.341 1.00 0.00 N
ATOM 2837 CA SER A 175 63.431 78.703 73.277 1.00 0.00 C
ATOM 2838 C SER A 175 63.220 80.223 73.263 1.00 0.00 C
ATOM 2839 O SER A 175 64.113 81.074 72.884 1.00 0.00 O
ATOM 2840 CB SER A 175 63.706 78.302 74.792 1.00 0.00 C
ATOM 2841 OG SER A 175 64.880 78.976 75.264 1.00 0.00 O
ATOM 2842 H SER A 175 65.411 78.796 72.437 1.00 0.00 H
ATOM 2843 HA SER A 175 62.559 78.221 72.836 1.00 0.00 H
ATOM 2844 HB2 SER A 175 62.806 78.512 75.370 1.00 0.00 H
ATOM 2845 HB3 SER A 175 63.898 77.229 74.796 1.00 0.00 H
ATOM 2846 HG SER A 175 64.647 79.788 75.719 1.00 0.00 H
ATOM 2847 N PHE A 176 61.945 80.576 73.602 1.00 0.00 N
ATOM 2848 CA PHE A 176 61.214 81.799 73.198 1.00 0.00 C
ATOM 2849 C PHE A 176 59.737 81.766 73.759 1.00 0.00 C
ATOM 2850 O PHE A 176 59.354 80.823 74.529 1.00 0.00 O
ATOM 2851 CB PHE A 176 61.196 81.829 71.611 1.00 0.00 C
ATOM 2852 CG PHE A 176 60.633 80.501 71.050 1.00 0.00 C
ATOM 2853 CD1 PHE A 176 61.509 79.523 70.571 1.00 0.00 C
ATOM 2854 CD2 PHE A 176 59.238 80.370 71.026 1.00 0.00 C
ATOM 2855 CE1 PHE A 176 60.966 78.412 69.968 1.00 0.00 C
ATOM 2856 CE2 PHE A 176 58.713 79.115 70.595 1.00 0.00 C
ATOM 2857 CZ PHE A 176 59.570 78.248 70.007 1.00 0.00 C
ATOM 2858 H PHE A 176 61.427 79.928 74.177 1.00 0.00 H
ATOM 2859 HA PHE A 176 61.678 82.698 73.604 1.00 0.00 H
ATOM 2860 HB2 PHE A 176 60.683 82.735 71.289 1.00 0.00 H
ATOM 2861 HB3 PHE A 176 62.261 81.879 71.381 1.00 0.00 H
ATOM 2862 HD1 PHE A 176 62.581 79.636 70.629 1.00 0.00 H
ATOM 2863 HD2 PHE A 176 58.471 80.982 71.478 1.00 0.00 H
ATOM 2864 HE1 PHE A 176 61.583 77.660 69.498 1.00 0.00 H
ATOM 2865 HE2 PHE A 176 57.640 78.987 70.582 1.00 0.00 H
ATOM 2866 HZ PHE A 176 59.217 77.452 69.368 1.00 0.00 H
ATOM 2867 N SER A 177 59.048 82.871 73.587 1.00 0.00 N
ATOM 2868 CA SER A 177 57.610 82.983 73.835 1.00 0.00 C
ATOM 2869 C SER A 177 56.726 83.233 72.616 1.00 0.00 C
ATOM 2870 O SER A 177 57.070 84.184 71.897 1.00 0.00 O
ATOM 2871 CB SER A 177 57.396 84.142 74.913 1.00 0.00 C
ATOM 2872 OG SER A 177 55.985 84.279 75.243 1.00 0.00 O
ATOM 2873 H SER A 177 59.535 83.594 73.077 1.00 0.00 H
ATOM 2874 HA SER A 177 57.316 82.057 74.329 1.00 0.00 H
ATOM 2875 HB2 SER A 177 57.970 83.921 75.813 1.00 0.00 H
ATOM 2876 HB3 SER A 177 57.718 85.086 74.472 1.00 0.00 H
ATOM 2877 HG SER A 177 55.685 83.580 75.829 1.00 0.00 H
ATOM 2878 N GLU A 178 55.735 82.452 72.266 1.00 0.00 N
ATOM 2879 CA GLU A 178 54.772 82.812 71.255 1.00 0.00 C
ATOM 2880 C GLU A 178 53.629 83.695 71.772 1.00 0.00 C
ATOM 2881 O GLU A 178 52.907 83.244 72.694 1.00 0.00 O
ATOM 2882 CB GLU A 178 54.307 81.508 70.560 1.00 0.00 C
ATOM 2883 CG GLU A 178 53.096 81.618 69.622 1.00 0.00 C
ATOM 2884 CD GLU A 178 52.697 80.344 68.875 1.00 0.00 C
ATOM 2885 OE1 GLU A 178 52.989 80.279 67.652 1.00 0.00 O
ATOM 2886 OE2 GLU A 178 52.416 79.312 69.572 1.00 0.00 O1-
ATOM 2887 H GLU A 178 55.635 81.691 72.922 1.00 0.00 H
ATOM 2888 HA GLU A 178 55.240 83.477 70.529 1.00 0.00 H
ATOM 2889 HB2 GLU A 178 55.183 81.275 69.955 1.00 0.00 H
ATOM 2890 HB3 GLU A 178 54.218 80.793 71.378 1.00 0.00 H
ATOM 2891 HG2 GLU A 178 52.138 81.978 69.996 1.00 0.00 H
ATOM 2892 HG3 GLU A 178 53.275 82.358 68.842 1.00 0.00 H
ATOM 2893 N LYS A 179 53.413 84.962 71.170 1.00 0.00 N
ATOM 2894 CA LYS A 179 52.192 85.671 71.381 1.00 0.00 C
ATOM 2895 C LYS A 179 51.077 85.119 70.385 1.00 0.00 C
ATOM 2896 O LYS A 179 50.069 84.615 70.746 1.00 0.00 O
ATOM 2897 CB LYS A 179 52.427 87.139 71.113 1.00 0.00 C
ATOM 2898 CG LYS A 179 51.140 87.984 71.538 1.00 0.00 C
ATOM 2899 CD LYS A 179 51.443 89.445 71.221 1.00 0.00 C
ATOM 2900 CE LYS A 179 51.341 89.789 69.784 1.00 0.00 C
ATOM 2901 NZ LYS A 179 51.826 91.169 69.519 1.00 0.00 N1+
ATOM 2902 H LYS A 179 54.097 85.291 70.503 1.00 0.00 H
ATOM 2903 HA LYS A 179 51.966 85.563 72.442 1.00 0.00 H
ATOM 2904 HB2 LYS A 179 53.225 87.521 71.750 1.00 0.00 H
ATOM 2905 HB3 LYS A 179 52.713 87.473 70.115 1.00 0.00 H
ATOM 2906 HG2 LYS A 179 50.253 87.673 70.986 1.00 0.00 H
ATOM 2907 HG3 LYS A 179 50.887 87.844 72.589 1.00 0.00 H
ATOM 2908 HD2 LYS A 179 50.846 90.090 71.865 1.00 0.00 H
ATOM 2909 HD3 LYS A 179 52.455 89.639 71.575 1.00 0.00 H
ATOM 2910 HE2 LYS A 179 52.059 89.196 69.217 1.00 0.00 H
ATOM 2911 HE3 LYS A 179 50.365 89.600 69.338 1.00 0.00 H
ATOM 2912 HZ1 LYS A 179 51.476 91.867 70.160 1.00 0.00 H
ATOM 2913 HZ2 LYS A 179 52.817 91.139 69.711 1.00 0.00 H
ATOM 2914 HZ3 LYS A 179 51.546 91.456 68.592 1.00 0.00 H
ATOM 2915 N ASP A 180 51.502 85.004 69.144 1.00 0.00 N
ATOM 2916 CA ASP A 180 50.688 84.392 68.097 1.00 0.00 C
ATOM 2917 C ASP A 180 51.540 83.729 67.041 1.00 0.00 C
ATOM 2918 O ASP A 180 52.632 84.254 66.719 1.00 0.00 O
ATOM 2919 CB ASP A 180 49.755 85.516 67.535 1.00 0.00 C
ATOM 2920 CG ASP A 180 48.434 84.809 67.191 1.00 0.00 C
ATOM 2921 OD1 ASP A 180 48.470 83.749 66.508 1.00 0.00 O
ATOM 2922 OD2 ASP A 180 47.327 85.140 67.654 1.00 0.00 O1-
ATOM 2923 H ASP A 180 52.432 85.313 68.898 1.00 0.00 H
ATOM 2924 HA ASP A 180 50.019 83.641 68.518 1.00 0.00 H
ATOM 2925 HB2 ASP A 180 49.618 86.271 68.309 1.00 0.00 H
ATOM 2926 HB3 ASP A 180 50.183 85.970 66.641 1.00 0.00 H
ATOM 2927 N GLY A 181 50.975 82.878 66.201 1.00 0.00 N
ATOM 2928 CA GLY A 181 51.639 82.227 64.999 1.00 0.00 C
ATOM 2929 C GLY A 181 51.603 83.188 63.810 1.00 0.00 C
ATOM 2930 O GLY A 181 51.954 82.718 62.719 1.00 0.00 O
ATOM 2931 H GLY A 181 49.969 82.803 66.258 1.00 0.00 H
ATOM 2932 HA2 GLY A 181 52.601 81.794 65.272 1.00 0.00 H
ATOM 2933 HA3 GLY A 181 51.065 81.326 64.782 1.00 0.00 H
ATOM 2934 N LYS A 182 51.287 84.485 63.981 1.00 0.00 N
ATOM 2935 CA LYS A 182 51.135 85.371 62.807 1.00 0.00 C
ATOM 2936 C LYS A 182 52.391 85.392 61.997 1.00 0.00 C
ATOM 2937 O LYS A 182 52.360 85.630 60.823 1.00 0.00 O
ATOM 2938 CB LYS A 182 50.698 86.721 63.353 1.00 0.00 C
ATOM 2939 CG LYS A 182 50.121 87.714 62.294 1.00 0.00 C
ATOM 2940 CD LYS A 182 48.829 87.184 61.630 1.00 0.00 C
ATOM 2941 CE LYS A 182 48.194 88.222 60.802 1.00 0.00 C
ATOM 2942 NZ LYS A 182 47.014 87.659 60.003 1.00 0.00 N1+
ATOM 2943 H LYS A 182 50.737 84.695 64.801 1.00 0.00 H
ATOM 2944 HA LYS A 182 50.343 85.027 62.142 1.00 0.00 H
ATOM 2945 HB2 LYS A 182 49.874 86.707 64.066 1.00 0.00 H
ATOM 2946 HB3 LYS A 182 51.516 87.262 63.829 1.00 0.00 H
ATOM 2947 HG2 LYS A 182 49.947 88.668 62.792 1.00 0.00 H
ATOM 2948 HG3 LYS A 182 50.838 87.811 61.479 1.00 0.00 H
ATOM 2949 HD2 LYS A 182 49.078 86.302 61.041 1.00 0.00 H
ATOM 2950 HD3 LYS A 182 48.195 86.819 62.438 1.00 0.00 H
ATOM 2951 HE2 LYS A 182 47.740 88.931 61.494 1.00 0.00 H
ATOM 2952 HE3 LYS A 182 48.970 88.636 60.158 1.00 0.00 H
ATOM 2953 HZ1 LYS A 182 46.665 88.465 59.505 1.00 0.00 H
ATOM 2954 HZ2 LYS A 182 47.280 87.065 59.230 1.00 0.00 H
ATOM 2955 HZ3 LYS A 182 46.258 87.266 60.545 1.00 0.00 H
ATOM 2956 N TRP A 183 53.598 85.237 62.583 1.00 0.00 N
ATOM 2957 CA TRP A 183 54.872 85.313 61.864 1.00 0.00 C
ATOM 2958 C TRP A 183 54.907 84.270 60.695 1.00 0.00 C
ATOM 2959 O TRP A 183 55.547 84.558 59.727 1.00 0.00 O
ATOM 2960 CB TRP A 183 55.976 85.024 62.953 1.00 0.00 C
ATOM 2961 CG TRP A 183 55.935 83.661 63.564 1.00 0.00 C
ATOM 2962 CD1 TRP A 183 55.249 83.213 64.648 1.00 0.00 C
ATOM 2963 CD2 TRP A 183 56.690 82.509 63.074 1.00 0.00 C
ATOM 2964 CE2 TRP A 183 56.345 81.372 63.914 1.00 0.00 C
ATOM 2965 CE3 TRP A 183 57.568 82.278 61.995 1.00 0.00 C
ATOM 2966 NE1 TRP A 183 55.379 81.884 64.777 1.00 0.00 N
ATOM 2967 CZ2 TRP A 183 57.030 80.115 63.767 1.00 0.00 C
ATOM 2968 CZ3 TRP A 183 58.298 81.081 61.863 1.00 0.00 C
ATOM 2969 CH2 TRP A 183 58.022 80.055 62.800 1.00 0.00 C
ATOM 2970 H TRP A 183 53.645 85.262 63.592 1.00 0.00 H
ATOM 2971 HA TRP A 183 54.962 86.292 61.394 1.00 0.00 H
ATOM 2972 HB2 TRP A 183 57.003 85.242 62.661 1.00 0.00 H
ATOM 2973 HB3 TRP A 183 55.973 85.784 63.734 1.00 0.00 H
ATOM 2974 HD1 TRP A 183 54.542 83.875 65.127 1.00 0.00 H
ATOM 2975 HE1 TRP A 183 54.879 81.368 65.486 1.00 0.00 H
ATOM 2976 HE3 TRP A 183 57.747 83.091 61.307 1.00 0.00 H
ATOM 2977 HZ2 TRP A 183 56.825 79.350 64.501 1.00 0.00 H
ATOM 2978 HZ3 TRP A 183 58.993 80.930 61.051 1.00 0.00 H
ATOM 2979 HH2 TRP A 183 58.519 79.125 62.568 1.00 0.00 H
ATOM 2980 N LEU A 184 54.205 83.113 60.819 1.00 0.00 N
ATOM 2981 CA LEU A 184 54.146 82.098 59.743 1.00 0.00 C
ATOM 2982 C LEU A 184 53.098 82.567 58.697 1.00 0.00 C
ATOM 2983 O LEU A 184 53.404 82.548 57.519 1.00 0.00 O
ATOM 2984 CB LEU A 184 53.897 80.673 60.276 1.00 0.00 C
ATOM 2985 CG LEU A 184 54.311 79.595 59.264 1.00 0.00 C
ATOM 2986 CD1 LEU A 184 55.802 79.463 59.056 1.00 0.00 C
ATOM 2987 CD2 LEU A 184 53.990 78.303 60.033 1.00 0.00 C
ATOM 2988 H LEU A 184 53.613 82.962 61.623 1.00 0.00 H
ATOM 2989 HA LEU A 184 55.066 82.154 59.162 1.00 0.00 H
ATOM 2990 HB2 LEU A 184 54.457 80.603 61.208 1.00 0.00 H
ATOM 2991 HB3 LEU A 184 52.847 80.601 60.561 1.00 0.00 H
ATOM 2992 HG LEU A 184 53.674 79.667 58.382 1.00 0.00 H
ATOM 2993 HD11 LEU A 184 56.046 78.639 58.385 1.00 0.00 H
ATOM 2994 HD12 LEU A 184 56.106 80.425 58.642 1.00 0.00 H
ATOM 2995 HD13 LEU A 184 56.133 79.293 60.080 1.00 0.00 H
ATOM 2996 HD21 LEU A 184 54.572 78.158 60.943 1.00 0.00 H
ATOM 2997 HD22 LEU A 184 52.983 78.311 60.452 1.00 0.00 H
ATOM 2998 HD23 LEU A 184 53.966 77.448 59.358 1.00 0.00 H
ATOM 2999 N HIE A 185 51.928 83.034 59.088 1.00 0.00 N
ATOM 3000 CA HIE A 185 50.879 83.617 58.226 1.00 0.00 C
ATOM 3001 C HIE A 185 51.401 84.693 57.285 1.00 0.00 C
ATOM 3002 O HIE A 185 51.308 84.632 56.067 1.00 0.00 O
ATOM 3003 CB HIE A 185 49.730 84.225 58.988 1.00 0.00 C
ATOM 3004 CG HIE A 185 48.619 84.604 58.080 1.00 0.00 C
ATOM 3005 CD2 HIE A 185 47.387 84.007 57.994 1.00 0.00 C
ATOM 3006 ND1 HIE A 185 48.505 85.785 57.345 1.00 0.00 N
ATOM 3007 CE1 HIE A 185 47.273 85.825 56.837 1.00 0.00 C
ATOM 3008 NE2 HIE A 185 46.642 84.736 57.173 1.00 0.00 N
ATOM 3009 H HIE A 185 51.715 83.055 60.075 1.00 0.00 H
ATOM 3010 HA HIE A 185 50.619 82.762 57.602 1.00 0.00 H
ATOM 3011 HB2 HIE A 185 49.437 83.414 59.655 1.00 0.00 H
ATOM 3012 HB3 HIE A 185 49.940 85.128 59.560 1.00 0.00 H
ATOM 3013 HD2 HIE A 185 47.104 83.114 58.532 1.00 0.00 H
ATOM 3014 HE1 HIE A 185 46.973 86.575 56.120 1.00 0.00 H
ATOM 3015 HE2 HIE A 185 45.689 84.532 56.910 1.00 0.00 H
ATOM 3016 N GLU A 186 52.080 85.701 57.832 1.00 0.00 N
ATOM 3017 CA GLU A 186 52.724 86.759 57.125 1.00 0.00 C
ATOM 3018 C GLU A 186 53.736 86.237 56.048 1.00 0.00 C
ATOM 3019 O GLU A 186 53.823 86.708 54.912 1.00 0.00 O
ATOM 3020 CB GLU A 186 53.462 87.649 58.107 1.00 0.00 C
ATOM 3021 CG GLU A 186 54.143 88.947 57.506 1.00 0.00 C
ATOM 3022 CD GLU A 186 53.133 89.939 56.750 1.00 0.00 C
ATOM 3023 OE1 GLU A 186 53.641 90.735 55.914 1.00 0.00 O
ATOM 3024 OE2 GLU A 186 51.895 89.798 56.867 1.00 0.00 O1-
ATOM 3025 H GLU A 186 52.083 85.759 58.840 1.00 0.00 H
ATOM 3026 HA GLU A 186 51.909 87.272 56.613 1.00 0.00 H
ATOM 3027 HB2 GLU A 186 52.664 88.008 58.756 1.00 0.00 H
ATOM 3028 HB3 GLU A 186 54.172 86.975 58.585 1.00 0.00 H
ATOM 3029 HG2 GLU A 186 54.665 89.476 58.304 1.00 0.00 H
ATOM 3030 HG3 GLU A 186 54.957 88.622 56.858 1.00 0.00 H
ATOM 3031 N LEU A 187 54.542 85.240 56.493 1.00 0.00 N
ATOM 3032 CA LEU A 187 55.585 84.623 55.589 1.00 0.00 C
ATOM 3033 C LEU A 187 54.885 83.836 54.476 1.00 0.00 C
ATOM 3034 O LEU A 187 55.170 83.922 53.283 1.00 0.00 O
ATOM 3035 CB LEU A 187 56.506 83.712 56.485 1.00 0.00 C
ATOM 3036 CG LEU A 187 57.725 83.017 55.759 1.00 0.00 C
ATOM 3037 CD1 LEU A 187 58.826 84.051 55.318 1.00 0.00 C
ATOM 3038 CD2 LEU A 187 58.332 81.937 56.678 1.00 0.00 C
ATOM 3039 H LEU A 187 54.394 84.892 57.429 1.00 0.00 H
ATOM 3040 HA LEU A 187 56.310 85.325 55.177 1.00 0.00 H
ATOM 3041 HB2 LEU A 187 57.046 84.395 57.139 1.00 0.00 H
ATOM 3042 HB3 LEU A 187 55.822 83.069 57.039 1.00 0.00 H
ATOM 3043 HG LEU A 187 57.288 82.562 54.870 1.00 0.00 H
ATOM 3044 HD11 LEU A 187 58.268 84.904 54.933 1.00 0.00 H
ATOM 3045 HD12 LEU A 187 59.384 84.425 56.177 1.00 0.00 H
ATOM 3046 HD13 LEU A 187 59.575 83.677 54.619 1.00 0.00 H
ATOM 3047 HD21 LEU A 187 59.359 81.656 56.445 1.00 0.00 H
ATOM 3048 HD22 LEU A 187 58.396 82.369 57.676 1.00 0.00 H
ATOM 3049 HD23 LEU A 187 57.732 81.031 56.590 1.00 0.00 H
ATOM 3050 N ALA A 188 53.887 83.055 54.868 1.00 0.00 N
ATOM 3051 CA ALA A 188 52.998 82.324 53.949 1.00 0.00 C
ATOM 3052 C ALA A 188 52.197 83.288 52.977 1.00 0.00 C
ATOM 3053 O ALA A 188 51.643 82.784 51.997 1.00 0.00 O
ATOM 3054 CB ALA A 188 52.026 81.454 54.737 1.00 0.00 C
ATOM 3055 H ALA A 188 53.716 82.870 55.846 1.00 0.00 H
ATOM 3056 HA ALA A 188 53.571 81.612 53.355 1.00 0.00 H
ATOM 3057 HB1 ALA A 188 51.451 80.767 54.115 1.00 0.00 H
ATOM 3058 HB2 ALA A 188 52.634 80.911 55.460 1.00 0.00 H
ATOM 3059 HB3 ALA A 188 51.387 82.163 55.263 1.00 0.00 H
ATOM 3060 N GLN A 189 52.089 84.532 53.338 1.00 0.00 N
ATOM 3061 CA GLN A 189 51.494 85.536 52.591 1.00 0.00 C
ATOM 3062 C GLN A 189 52.368 86.247 51.496 1.00 0.00 C
ATOM 3063 O GLN A 189 51.831 86.516 50.430 1.00 0.00 O
ATOM 3064 CB GLN A 189 50.669 86.457 53.468 1.00 0.00 C
ATOM 3065 CG GLN A 189 49.615 87.207 52.764 1.00 0.00 C
ATOM 3066 CD GLN A 189 48.719 88.070 53.636 1.00 0.00 C
ATOM 3067 NE2 GLN A 189 47.777 88.784 53.106 1.00 0.00 N
ATOM 3068 OE1 GLN A 189 48.798 88.059 54.862 1.00 0.00 O
ATOM 3069 H GLN A 189 52.495 84.767 54.233 1.00 0.00 H
ATOM 3070 HA GLN A 189 50.778 85.027 51.946 1.00 0.00 H
ATOM 3071 HB2 GLN A 189 50.130 85.880 54.219 1.00 0.00 H
ATOM 3072 HB3 GLN A 189 51.282 87.223 53.942 1.00 0.00 H
ATOM 3073 HG2 GLN A 189 50.002 87.905 52.021 1.00 0.00 H
ATOM 3074 HG3 GLN A 189 48.985 86.538 52.177 1.00 0.00 H
ATOM 3075 HE21 GLN A 189 47.228 89.342 53.744 1.00 0.00 H
ATOM 3076 HE22 GLN A 189 47.699 88.807 52.099 1.00 0.00 H
ATOM 3077 N HIE A 190 53.614 86.526 51.773 1.00 0.00 N
ATOM 3078 CA HIE A 190 54.500 87.368 50.854 1.00 0.00 C
ATOM 3079 C HIE A 190 55.736 86.715 50.233 1.00 0.00 C
ATOM 3080 O HIE A 190 56.325 87.237 49.263 1.00 0.00 O
ATOM 3081 CB HIE A 190 54.863 88.649 51.650 1.00 0.00 C
ATOM 3082 CG HIE A 190 53.598 89.488 52.012 1.00 0.00 C
ATOM 3083 CD2 HIE A 190 52.935 89.541 53.178 1.00 0.00 C
ATOM 3084 ND1 HIE A 190 52.853 90.225 51.074 1.00 0.00 N
ATOM 3085 CE1 HIE A 190 51.753 90.669 51.705 1.00 0.00 C
ATOM 3086 NE2 HIE A 190 51.816 90.334 53.001 1.00 0.00 N
ATOM 3087 H HIE A 190 54.033 86.099 52.587 1.00 0.00 H
ATOM 3088 HA HIE A 190 53.928 87.654 49.971 1.00 0.00 H
ATOM 3089 HB2 HIE A 190 55.252 88.330 52.617 1.00 0.00 H
ATOM 3090 HB3 HIE A 190 55.561 89.228 51.045 1.00 0.00 H
ATOM 3091 HD2 HIE A 190 53.152 89.124 54.150 1.00 0.00 H
ATOM 3092 HE1 HIE A 190 51.010 91.255 51.184 1.00 0.00 H
ATOM 3093 HE2 HIE A 190 51.204 90.712 53.710 1.00 0.00 H
ATOM 3094 N ASN A 191 56.300 85.776 50.960 1.00 0.00 N
ATOM 3095 CA ASN A 191 57.517 85.041 50.536 1.00 0.00 C
ATOM 3096 C ASN A 191 57.246 83.952 49.516 1.00 0.00 C
ATOM 3097 O ASN A 191 56.353 83.116 49.627 1.00 0.00 O
ATOM 3098 CB ASN A 191 58.146 84.476 51.907 1.00 0.00 C
ATOM 3099 CG ASN A 191 59.601 84.045 51.712 1.00 0.00 C
ATOM 3100 ND2 ASN A 191 60.566 84.925 51.967 1.00 0.00 N
ATOM 3101 OD1 ASN A 191 59.933 83.021 51.184 1.00 0.00 O
ATOM 3102 H ASN A 191 55.721 85.350 51.669 1.00 0.00 H
ATOM 3103 HA ASN A 191 58.279 85.699 50.117 1.00 0.00 H
ATOM 3104 HB2 ASN A 191 57.932 85.211 52.683 1.00 0.00 H
ATOM 3105 HB3 ASN A 191 57.587 83.582 52.185 1.00 0.00 H
ATOM 3106 HD21 ASN A 191 61.506 84.619 51.761 1.00 0.00 H
ATOM 3107 HD22 ASN A 191 60.346 85.801 52.420 1.00 0.00 H
ATOM 3108 N THR A 192 58.134 83.935 48.485 1.00 0.00 N
ATOM 3109 CA THR A 192 58.250 82.841 47.432 1.00 0.00 C
ATOM 3110 C THR A 192 59.719 82.431 47.168 1.00 0.00 C
ATOM 3111 O THR A 192 60.108 82.263 46.008 1.00 0.00 O
ATOM 3112 CB THR A 192 57.565 83.400 46.193 1.00 0.00 C
ATOM 3113 CG2 THR A 192 56.051 83.549 46.310 1.00 0.00 C
ATOM 3114 OG1 THR A 192 58.187 84.645 45.813 1.00 0.00 O
ATOM 3115 H THR A 192 58.692 84.765 48.340 1.00 0.00 H
ATOM 3116 HA THR A 192 57.671 81.962 47.716 1.00 0.00 H
ATOM 3117 HB THR A 192 57.776 82.628 45.452 1.00 0.00 H
ATOM 3118 HG1 THR A 192 59.094 84.368 45.664 1.00 0.00 H
ATOM 3119 HG21 THR A 192 55.758 84.331 47.010 1.00 0.00 H
ATOM 3120 HG22 THR A 192 55.722 83.653 45.276 1.00 0.00 H
ATOM 3121 HG23 THR A 192 55.516 82.607 46.427 1.00 0.00 H
ATOM 3122 N SER A 193 60.482 82.380 48.252 1.00 0.00 N
ATOM 3123 CA SER A 193 61.923 82.621 48.232 1.00 0.00 C
ATOM 3124 C SER A 193 62.687 81.571 49.048 1.00 0.00 C
ATOM 3125 O SER A 193 63.917 81.427 48.830 1.00 0.00 O
ATOM 3126 CB SER A 193 62.258 84.059 48.452 1.00 0.00 C
ATOM 3127 OG SER A 193 61.658 84.976 47.616 1.00 0.00 O
ATOM 3128 H SER A 193 59.968 82.415 49.121 1.00 0.00 H
ATOM 3129 HA SER A 193 62.229 82.594 47.186 1.00 0.00 H
ATOM 3130 HB2 SER A 193 62.055 84.264 49.503 1.00 0.00 H
ATOM 3131 HB3 SER A 193 63.323 84.277 48.375 1.00 0.00 H
ATOM 3132 HG SER A 193 60.866 85.391 47.967 1.00 0.00 H
ATOM 3133 N LEU A 194 62.022 80.773 49.896 1.00 0.00 N
ATOM 3134 CA LEU A 194 62.701 79.880 50.825 1.00 0.00 C
ATOM 3135 C LEU A 194 63.307 78.700 50.061 1.00 0.00 C
ATOM 3136 O LEU A 194 62.703 78.038 49.245 1.00 0.00 O
ATOM 3137 CB LEU A 194 61.871 79.355 52.008 1.00 0.00 C
ATOM 3138 CG LEU A 194 61.443 80.452 53.041 1.00 0.00 C
ATOM 3139 CD1 LEU A 194 60.040 80.064 53.655 1.00 0.00 C
ATOM 3140 CD2 LEU A 194 62.338 80.523 54.278 1.00 0.00 C
ATOM 3141 H LEU A 194 61.039 80.949 50.048 1.00 0.00 H
ATOM 3142 HA LEU A 194 63.467 80.510 51.278 1.00 0.00 H
ATOM 3143 HB2 LEU A 194 60.954 78.959 51.573 1.00 0.00 H
ATOM 3144 HB3 LEU A 194 62.402 78.584 52.567 1.00 0.00 H
ATOM 3145 HG LEU A 194 61.303 81.388 52.501 1.00 0.00 H
ATOM 3146 HD11 LEU A 194 59.786 80.894 54.315 1.00 0.00 H
ATOM 3147 HD12 LEU A 194 59.322 79.980 52.840 1.00 0.00 H
ATOM 3148 HD13 LEU A 194 60.085 79.045 54.040 1.00 0.00 H
ATOM 3149 HD21 LEU A 194 62.312 79.569 54.806 1.00 0.00 H
ATOM 3150 HD22 LEU A 194 63.365 80.715 53.968 1.00 0.00 H
ATOM 3151 HD23 LEU A 194 62.040 81.394 54.862 1.00 0.00 H
ATOM 3152 N GLU A 195 64.564 78.354 50.415 1.00 0.00 N
ATOM 3153 CA GLU A 195 65.227 77.057 50.097 1.00 0.00 C
ATOM 3154 C GLU A 195 65.190 76.125 51.281 1.00 0.00 C
ATOM 3155 O GLU A 195 65.241 74.904 51.094 1.00 0.00 O
ATOM 3156 CB GLU A 195 66.621 77.343 49.502 1.00 0.00 C
ATOM 3157 CG GLU A 195 66.526 78.167 48.188 1.00 0.00 C
ATOM 3158 CD GLU A 195 67.873 78.053 47.415 1.00 0.00 C
ATOM 3159 OE1 GLU A 195 68.815 78.860 47.602 1.00 0.00 O
ATOM 3160 OE2 GLU A 195 67.867 77.217 46.460 1.00 0.00 O1-
ATOM 3161 H GLU A 195 64.924 78.885 51.195 1.00 0.00 H
ATOM 3162 HA GLU A 195 64.691 76.577 49.278 1.00 0.00 H
ATOM 3163 HB2 GLU A 195 67.227 77.722 50.325 1.00 0.00 H
ATOM 3164 HB3 GLU A 195 67.152 76.411 49.308 1.00 0.00 H
ATOM 3165 HG2 GLU A 195 65.680 77.812 47.600 1.00 0.00 H
ATOM 3166 HG3 GLU A 195 66.287 79.200 48.440 1.00 0.00 H
ATOM 3167 N VAL A 196 65.044 76.637 52.492 1.00 0.00 N
ATOM 3168 CA VAL A 196 65.216 75.906 53.759 1.00 0.00 C
ATOM 3169 C VAL A 196 64.480 76.549 54.850 1.00 0.00 C
ATOM 3170 O VAL A 196 64.616 77.716 55.113 1.00 0.00 O
ATOM 3171 CB VAL A 196 66.693 75.781 54.184 1.00 0.00 C
ATOM 3172 CG1 VAL A 196 66.866 75.161 55.574 1.00 0.00 C
ATOM 3173 CG2 VAL A 196 67.518 74.879 53.281 1.00 0.00 C
ATOM 3174 H VAL A 196 64.938 77.636 52.592 1.00 0.00 H
ATOM 3175 HA VAL A 196 64.838 74.900 53.574 1.00 0.00 H
ATOM 3176 HB VAL A 196 67.176 76.758 54.193 1.00 0.00 H
ATOM 3177 HG11 VAL A 196 66.411 74.171 55.536 1.00 0.00 H
ATOM 3178 HG12 VAL A 196 67.915 75.174 55.872 1.00 0.00 H
ATOM 3179 HG13 VAL A 196 66.402 75.750 56.365 1.00 0.00 H
ATOM 3180 HG21 VAL A 196 67.001 73.941 53.079 1.00 0.00 H
ATOM 3181 HG22 VAL A 196 67.652 75.393 52.330 1.00 0.00 H
ATOM 3182 HG23 VAL A 196 68.473 74.576 53.711 1.00 0.00 H
ATOM 3183 N LEU A 197 63.600 75.764 55.474 1.00 0.00 N
ATOM 3184 CA LEU A 197 62.837 76.125 56.689 1.00 0.00 C
ATOM 3185 C LEU A 197 62.862 75.135 57.834 1.00 0.00 C
ATOM 3186 O LEU A 197 62.269 74.070 57.717 1.00 0.00 O
ATOM 3187 CB LEU A 197 61.424 76.384 56.262 1.00 0.00 C
ATOM 3188 CG LEU A 197 60.515 76.965 57.339 1.00 0.00 C
ATOM 3189 CD1 LEU A 197 60.901 78.414 57.567 1.00 0.00 C
ATOM 3190 CD2 LEU A 197 59.140 76.812 56.789 1.00 0.00 C
ATOM 3191 H LEU A 197 63.491 74.825 55.119 1.00 0.00 H
ATOM 3192 HA LEU A 197 63.200 77.108 56.991 1.00 0.00 H
ATOM 3193 HB2 LEU A 197 61.522 77.070 55.421 1.00 0.00 H
ATOM 3194 HB3 LEU A 197 61.019 75.431 55.922 1.00 0.00 H
ATOM 3195 HG LEU A 197 60.580 76.348 58.236 1.00 0.00 H
ATOM 3196 HD11 LEU A 197 61.825 78.435 58.146 1.00 0.00 H
ATOM 3197 HD12 LEU A 197 61.005 78.914 56.604 1.00 0.00 H
ATOM 3198 HD13 LEU A 197 60.112 78.903 58.139 1.00 0.00 H
ATOM 3199 HD21 LEU A 197 58.920 75.769 56.563 1.00 0.00 H
ATOM 3200 HD22 LEU A 197 58.363 77.152 57.473 1.00 0.00 H
ATOM 3201 HD23 LEU A 197 59.005 77.311 55.829 1.00 0.00 H
ATOM 3202 N ASN A 198 63.591 75.467 58.930 1.00 0.00 N
ATOM 3203 CA ASN A 198 63.838 74.512 60.003 1.00 0.00 C
ATOM 3204 C ASN A 198 63.516 75.066 61.365 1.00 0.00 C
ATOM 3205 O ASN A 198 63.976 76.162 61.755 1.00 0.00 O
ATOM 3206 CB ASN A 198 65.306 74.075 59.952 1.00 0.00 C
ATOM 3207 CG ASN A 198 65.819 73.049 61.032 1.00 0.00 C
ATOM 3208 ND2 ASN A 198 66.981 72.510 60.767 1.00 0.00 N
ATOM 3209 OD1 ASN A 198 65.182 72.904 62.066 1.00 0.00 O
ATOM 3210 H ASN A 198 64.117 76.329 58.930 1.00 0.00 H
ATOM 3211 HA ASN A 198 63.297 73.587 59.805 1.00 0.00 H
ATOM 3212 HB2 ASN A 198 65.591 73.741 58.954 1.00 0.00 H
ATOM 3213 HB3 ASN A 198 65.869 74.994 60.115 1.00 0.00 H
ATOM 3214 HD21 ASN A 198 67.401 71.990 61.525 1.00 0.00 H
ATOM 3215 HD22 ASN A 198 67.525 72.720 59.942 1.00 0.00 H
ATOM 3216 N PHE A 199 62.667 74.458 62.161 1.00 0.00 N
ATOM 3217 CA PHE A 199 62.231 74.844 63.520 1.00 0.00 C
ATOM 3218 C PHE A 199 61.767 73.582 64.277 1.00 0.00 C
ATOM 3219 O PHE A 199 60.713 73.390 64.902 1.00 0.00 O
ATOM 3220 CB PHE A 199 61.176 75.918 63.507 1.00 0.00 C
ATOM 3221 CG PHE A 199 59.867 75.610 62.740 1.00 0.00 C
ATOM 3222 CD1 PHE A 199 59.804 75.967 61.390 1.00 0.00 C
ATOM 3223 CD2 PHE A 199 58.642 75.325 63.393 1.00 0.00 C
ATOM 3224 CE1 PHE A 199 58.641 75.931 60.707 1.00 0.00 C
ATOM 3225 CE2 PHE A 199 57.444 75.337 62.692 1.00 0.00 C
ATOM 3226 CZ PHE A 199 57.429 75.564 61.330 1.00 0.00 C
ATOM 3227 H PHE A 199 62.270 73.611 61.780 1.00 0.00 H
ATOM 3228 HA PHE A 199 63.087 75.197 64.096 1.00 0.00 H
ATOM 3229 HB2 PHE A 199 60.842 76.286 64.477 1.00 0.00 H
ATOM 3230 HB3 PHE A 199 61.627 76.830 63.116 1.00 0.00 H
ATOM 3231 HD1 PHE A 199 60.719 76.286 60.913 1.00 0.00 H
ATOM 3232 HD2 PHE A 199 58.709 75.093 64.445 1.00 0.00 H
ATOM 3233 HE1 PHE A 199 58.625 76.175 59.655 1.00 0.00 H
ATOM 3234 HE2 PHE A 199 56.544 75.072 63.227 1.00 0.00 H
ATOM 3235 HZ PHE A 199 56.539 75.611 60.720 1.00 0.00 H
ATOM 3236 N TYR A 200 62.654 72.581 64.138 1.00 0.00 N
ATOM 3237 CA TYR A 200 62.549 71.213 64.746 1.00 0.00 C
ATOM 3238 C TYR A 200 62.739 71.354 66.235 1.00 0.00 C
ATOM 3239 O TYR A 200 63.502 72.249 66.704 1.00 0.00 O
ATOM 3240 CB TYR A 200 63.653 70.375 64.113 1.00 0.00 C
ATOM 3241 CG TYR A 200 63.890 68.979 64.615 1.00 0.00 C
ATOM 3242 CD1 TYR A 200 64.821 68.693 65.629 1.00 0.00 C
ATOM 3243 CD2 TYR A 200 62.992 67.963 64.177 1.00 0.00 C
ATOM 3244 CE1 TYR A 200 64.999 67.384 66.172 1.00 0.00 C
ATOM 3245 CE2 TYR A 200 63.123 66.683 64.718 1.00 0.00 C
ATOM 3246 CZ TYR A 200 64.135 66.416 65.709 1.00 0.00 C
ATOM 3247 OH TYR A 200 64.159 65.176 66.288 1.00 0.00 O
ATOM 3248 H TYR A 200 63.517 72.647 63.617 1.00 0.00 H
ATOM 3249 HA TYR A 200 61.588 70.734 64.561 1.00 0.00 H
ATOM 3250 HB2 TYR A 200 63.539 70.274 63.033 1.00 0.00 H
ATOM 3251 HB3 TYR A 200 64.575 70.935 64.271 1.00 0.00 H
ATOM 3252 HD1 TYR A 200 65.439 69.480 66.033 1.00 0.00 H
ATOM 3253 HD2 TYR A 200 62.268 68.134 63.394 1.00 0.00 H
ATOM 3254 HE1 TYR A 200 65.730 67.149 66.931 1.00 0.00 H
ATOM 3255 HE2 TYR A 200 62.376 65.937 64.489 1.00 0.00 H
ATOM 3256 HH TYR A 200 63.317 64.751 66.109 1.00 0.00 H
ATOM 3257 N MET A 201 61.936 70.666 67.072 1.00 0.00 N
ATOM 3258 CA MET A 201 61.905 70.757 68.544 1.00 0.00 C
ATOM 3259 C MET A 201 61.713 72.239 69.067 1.00 0.00 C
ATOM 3260 O MET A 201 62.552 72.672 69.901 1.00 0.00 O
ATOM 3261 CB MET A 201 62.959 69.881 69.246 1.00 0.00 C
ATOM 3262 CG MET A 201 62.712 68.395 69.117 1.00 0.00 C
ATOM 3263 SD MET A 201 61.126 67.706 69.837 1.00 0.00 S
ATOM 3264 CE MET A 201 60.852 66.309 68.741 1.00 0.00 C
ATOM 3265 H MET A 201 61.388 69.904 66.699 1.00 0.00 H
ATOM 3266 HA MET A 201 60.985 70.257 68.845 1.00 0.00 H
ATOM 3267 HB2 MET A 201 64.000 70.148 69.061 1.00 0.00 H
ATOM 3268 HB3 MET A 201 62.782 70.097 70.299 1.00 0.00 H
ATOM 3269 HG2 MET A 201 62.803 68.111 68.069 1.00 0.00 H
ATOM 3270 HG3 MET A 201 63.530 67.884 69.624 1.00 0.00 H
ATOM 3271 HE1 MET A 201 61.103 66.630 67.730 1.00 0.00 H
ATOM 3272 HE2 MET A 201 61.393 65.401 69.008 1.00 0.00 H
ATOM 3273 HE3 MET A 201 59.788 66.098 68.635 1.00 0.00 H
ATOM 3274 N THR A 202 60.594 72.888 68.760 1.00 0.00 N
ATOM 3275 CA THR A 202 60.250 74.297 69.075 1.00 0.00 C
ATOM 3276 C THR A 202 58.804 74.358 69.664 1.00 0.00 C
ATOM 3277 O THR A 202 57.876 73.678 69.257 1.00 0.00 O
ATOM 3278 CB THR A 202 60.395 75.289 67.866 1.00 0.00 C
ATOM 3279 CG2 THR A 202 61.734 75.634 67.386 1.00 0.00 C
ATOM 3280 OG1 THR A 202 59.574 74.842 66.862 1.00 0.00 O
ATOM 3281 H THR A 202 59.887 72.324 68.311 1.00 0.00 H
ATOM 3282 HA THR A 202 60.785 74.556 69.989 1.00 0.00 H
ATOM 3283 HB THR A 202 59.848 76.186 68.156 1.00 0.00 H
ATOM 3284 HG1 THR A 202 60.048 74.176 66.359 1.00 0.00 H
ATOM 3285 HG21 THR A 202 62.449 74.814 67.448 1.00 0.00 H
ATOM 3286 HG22 THR A 202 61.719 76.126 66.414 1.00 0.00 H
ATOM 3287 HG23 THR A 202 61.997 76.534 67.943 1.00 0.00 H
ATOM 3288 N GLU A 203 58.588 75.095 70.730 1.00 0.00 N
ATOM 3289 CA GLU A 203 57.366 75.172 71.463 1.00 0.00 C
ATOM 3290 C GLU A 203 56.201 75.875 70.741 1.00 0.00 C
ATOM 3291 O GLU A 203 55.217 76.088 71.414 1.00 0.00 O
ATOM 3292 CB GLU A 203 57.667 75.744 72.880 1.00 0.00 C
ATOM 3293 CG GLU A 203 58.300 74.733 73.849 1.00 0.00 C
ATOM 3294 CD GLU A 203 58.558 75.414 75.219 1.00 0.00 C
ATOM 3295 OE1 GLU A 203 58.568 76.606 75.314 1.00 0.00 O
ATOM 3296 OE2 GLU A 203 59.027 74.717 76.167 1.00 0.00 O1-
ATOM 3297 H GLU A 203 59.349 75.603 71.157 1.00 0.00 H
ATOM 3298 HA GLU A 203 56.955 74.171 71.589 1.00 0.00 H
ATOM 3299 HB2 GLU A 203 58.265 76.613 72.604 1.00 0.00 H
ATOM 3300 HB3 GLU A 203 56.705 76.004 73.322 1.00 0.00 H
ATOM 3301 HG2 GLU A 203 57.599 73.908 73.973 1.00 0.00 H
ATOM 3302 HG3 GLU A 203 59.260 74.394 73.459 1.00 0.00 H
ATOM 3303 N PHE A 204 56.283 76.236 69.459 1.00 0.00 N
ATOM 3304 CA PHE A 204 55.246 76.950 68.676 1.00 0.00 C
ATOM 3305 C PHE A 204 53.961 76.026 68.700 1.00 0.00 C
ATOM 3306 O PHE A 204 54.088 74.822 68.543 1.00 0.00 O
ATOM 3307 CB PHE A 204 55.651 77.371 67.273 1.00 0.00 C
ATOM 3308 CG PHE A 204 56.864 78.245 67.166 1.00 0.00 C
ATOM 3309 CD1 PHE A 204 56.821 79.608 67.596 1.00 0.00 C
ATOM 3310 CD2 PHE A 204 58.021 77.749 66.584 1.00 0.00 C
ATOM 3311 CE1 PHE A 204 58.051 80.376 67.529 1.00 0.00 C
ATOM 3312 CE2 PHE A 204 59.217 78.554 66.366 1.00 0.00 C
ATOM 3313 CZ PHE A 204 59.198 79.802 67.054 1.00 0.00 C
ATOM 3314 H PHE A 204 57.076 75.955 68.900 1.00 0.00 H
ATOM 3315 HA PHE A 204 54.864 77.863 69.133 1.00 0.00 H
ATOM 3316 HB2 PHE A 204 55.738 76.460 66.681 1.00 0.00 H
ATOM 3317 HB3 PHE A 204 54.833 77.943 66.835 1.00 0.00 H
ATOM 3318 HD1 PHE A 204 55.923 80.064 67.986 1.00 0.00 H
ATOM 3319 HD2 PHE A 204 57.823 76.764 66.188 1.00 0.00 H
ATOM 3320 HE1 PHE A 204 58.039 81.300 68.088 1.00 0.00 H
ATOM 3321 HE2 PHE A 204 59.988 78.179 65.708 1.00 0.00 H
ATOM 3322 HZ PHE A 204 60.138 80.327 66.960 1.00 0.00 H
ATOM 3323 N ALA A 205 52.779 76.620 68.734 1.00 0.00 N
ATOM 3324 CA ALA A 205 51.476 75.872 68.616 1.00 0.00 C
ATOM 3325 C ALA A 205 50.308 76.780 68.101 1.00 0.00 C
ATOM 3326 O ALA A 205 49.306 76.230 67.709 1.00 0.00 O
ATOM 3327 CB ALA A 205 50.997 75.331 70.035 1.00 0.00 C
ATOM 3328 H ALA A 205 52.778 77.615 68.910 1.00 0.00 H
ATOM 3329 HA ALA A 205 51.616 75.088 67.872 1.00 0.00 H
ATOM 3330 HB1 ALA A 205 51.094 76.080 70.821 1.00 0.00 H
ATOM 3331 HB2 ALA A 205 49.922 75.172 69.948 1.00 0.00 H
ATOM 3332 HB3 ALA A 205 51.501 74.418 70.352 1.00 0.00 H
ATOM 3333 N LYS A 206 50.313 78.127 68.270 1.00 0.00 N
ATOM 3334 CA LYS A 206 49.191 78.958 67.713 1.00 0.00 C
ATOM 3335 C LYS A 206 49.396 79.091 66.230 1.00 0.00 C
ATOM 3336 O LYS A 206 48.456 79.296 65.517 1.00 0.00 O
ATOM 3337 CB LYS A 206 49.085 80.310 68.536 1.00 0.00 C
ATOM 3338 CG LYS A 206 48.476 80.138 69.928 1.00 0.00 C
ATOM 3339 CD LYS A 206 48.636 81.465 70.661 1.00 0.00 C
ATOM 3340 CE LYS A 206 47.996 81.371 72.073 1.00 0.00 C
ATOM 3341 NZ LYS A 206 47.669 82.748 72.545 1.00 0.00 N1+
ATOM 3342 H LYS A 206 51.087 78.578 68.737 1.00 0.00 H
ATOM 3343 HA LYS A 206 48.289 78.363 67.855 1.00 0.00 H
ATOM 3344 HB2 LYS A 206 50.064 80.790 68.539 1.00 0.00 H
ATOM 3345 HB3 LYS A 206 48.409 81.045 68.099 1.00 0.00 H
ATOM 3346 HG2 LYS A 206 47.395 80.000 69.934 1.00 0.00 H
ATOM 3347 HG3 LYS A 206 49.035 79.382 70.479 1.00 0.00 H
ATOM 3348 HD2 LYS A 206 49.666 81.812 70.742 1.00 0.00 H
ATOM 3349 HD3 LYS A 206 48.099 82.228 70.098 1.00 0.00 H
ATOM 3350 HE2 LYS A 206 47.178 80.652 72.034 1.00 0.00 H
ATOM 3351 HE3 LYS A 206 48.755 80.938 72.723 1.00 0.00 H
ATOM 3352 HZ1 LYS A 206 47.351 82.861 73.497 1.00 0.00 H
ATOM 3353 HZ2 LYS A 206 48.479 83.351 72.518 1.00 0.00 H
ATOM 3354 HZ3 LYS A 206 47.041 83.166 71.873 1.00 0.00 H
ATOM 3355 N ILE A 207 50.519 78.786 65.644 1.00 0.00 N
ATOM 3356 CA ILE A 207 50.799 78.573 64.189 1.00 0.00 C
ATOM 3357 C ILE A 207 50.033 77.453 63.562 1.00 0.00 C
ATOM 3358 O ILE A 207 49.410 76.635 64.210 1.00 0.00 O
ATOM 3359 CB ILE A 207 52.311 78.311 63.932 1.00 0.00 C
ATOM 3360 CG1 ILE A 207 52.842 77.114 64.769 1.00 0.00 C
ATOM 3361 CG2 ILE A 207 53.062 79.620 63.983 1.00 0.00 C
ATOM 3362 CD1 ILE A 207 54.220 76.700 64.229 1.00 0.00 C
ATOM 3363 H ILE A 207 51.281 78.788 66.307 1.00 0.00 H
ATOM 3364 HA ILE A 207 50.591 79.514 63.680 1.00 0.00 H
ATOM 3365 HB ILE A 207 52.466 77.997 62.900 1.00 0.00 H
ATOM 3366 HG12 ILE A 207 53.006 77.393 65.809 1.00 0.00 H
ATOM 3367 HG13 ILE A 207 52.129 76.303 64.617 1.00 0.00 H
ATOM 3368 HG21 ILE A 207 53.090 79.966 65.016 1.00 0.00 H
ATOM 3369 HG22 ILE A 207 54.070 79.510 63.584 1.00 0.00 H
ATOM 3370 HG23 ILE A 207 52.629 80.399 63.356 1.00 0.00 H
ATOM 3371 HD11 ILE A 207 54.952 77.507 64.256 1.00 0.00 H
ATOM 3372 HD12 ILE A 207 54.490 75.811 64.799 1.00 0.00 H
ATOM 3373 HD13 ILE A 207 54.064 76.259 63.244 1.00 0.00 H
ATOM 3374 N SER A 208 49.953 77.486 62.224 1.00 0.00 N
ATOM 3375 CA SER A 208 49.075 76.675 61.396 1.00 0.00 C
ATOM 3376 C SER A 208 49.773 75.869 60.319 1.00 0.00 C
ATOM 3377 O SER A 208 50.483 76.444 59.453 1.00 0.00 O
ATOM 3378 CB SER A 208 47.929 77.536 60.835 1.00 0.00 C
ATOM 3379 OG SER A 208 46.988 76.729 60.171 1.00 0.00 O
ATOM 3380 H SER A 208 50.478 78.228 61.785 1.00 0.00 H
ATOM 3381 HA SER A 208 48.569 76.025 62.109 1.00 0.00 H
ATOM 3382 HB2 SER A 208 47.498 78.053 61.692 1.00 0.00 H
ATOM 3383 HB3 SER A 208 48.231 78.270 60.088 1.00 0.00 H
ATOM 3384 HG SER A 208 46.323 77.412 60.058 1.00 0.00 H
ATOM 3385 N PRO A 209 49.568 74.529 60.358 1.00 0.00 N
ATOM 3386 CA PRO A 209 49.868 73.717 59.201 1.00 0.00 C
ATOM 3387 C PRO A 209 49.200 74.181 57.973 1.00 0.00 C
ATOM 3388 O PRO A 209 49.687 73.842 56.897 1.00 0.00 O
ATOM 3389 CB PRO A 209 49.520 72.250 59.529 1.00 0.00 C
ATOM 3390 CG PRO A 209 49.199 72.181 60.963 1.00 0.00 C
ATOM 3391 CD PRO A 209 49.000 73.687 61.397 1.00 0.00 C
ATOM 3392 HA PRO A 209 50.946 73.708 59.038 1.00 0.00 H
ATOM 3393 HB2 PRO A 209 48.672 71.819 58.995 1.00 0.00 H
ATOM 3394 HB3 PRO A 209 50.377 71.581 59.448 1.00 0.00 H
ATOM 3395 HG2 PRO A 209 48.355 71.502 61.089 1.00 0.00 H
ATOM 3396 HG3 PRO A 209 50.056 71.737 61.468 1.00 0.00 H
ATOM 3397 HD2 PRO A 209 47.989 74.066 61.550 1.00 0.00 H
ATOM 3398 HD3 PRO A 209 49.573 73.791 62.318 1.00 0.00 H
ATOM 3399 N LYS A 210 48.077 74.919 57.969 1.00 0.00 N
ATOM 3400 CA LYS A 210 47.486 75.472 56.734 1.00 0.00 C
ATOM 3401 C LYS A 210 48.428 76.496 56.053 1.00 0.00 C
ATOM 3402 O LYS A 210 48.495 76.560 54.832 1.00 0.00 O
ATOM 3403 CB LYS A 210 46.054 76.080 57.021 1.00 0.00 C
ATOM 3404 CG LYS A 210 45.093 74.986 57.521 1.00 0.00 C
ATOM 3405 CD LYS A 210 43.747 75.666 57.876 1.00 0.00 C
ATOM 3406 CE LYS A 210 42.828 74.912 58.856 1.00 0.00 C
ATOM 3407 NZ LYS A 210 42.521 73.516 58.402 1.00 0.00 N1+
ATOM 3408 H LYS A 210 47.574 74.984 58.843 1.00 0.00 H
ATOM 3409 HA LYS A 210 47.329 74.617 56.077 1.00 0.00 H
ATOM 3410 HB2 LYS A 210 46.143 76.899 57.735 1.00 0.00 H
ATOM 3411 HB3 LYS A 210 45.583 76.423 56.101 1.00 0.00 H
ATOM 3412 HG2 LYS A 210 45.029 74.243 56.726 1.00 0.00 H
ATOM 3413 HG3 LYS A 210 45.581 74.566 58.401 1.00 0.00 H
ATOM 3414 HD2 LYS A 210 44.057 76.608 58.328 1.00 0.00 H
ATOM 3415 HD3 LYS A 210 43.213 75.974 56.977 1.00 0.00 H
ATOM 3416 HE2 LYS A 210 43.199 74.978 59.879 1.00 0.00 H
ATOM 3417 HE3 LYS A 210 41.879 75.427 58.710 1.00 0.00 H
ATOM 3418 HZ1 LYS A 210 41.971 73.094 59.137 1.00 0.00 H
ATOM 3419 HZ2 LYS A 210 42.055 73.499 57.506 1.00 0.00 H
ATOM 3420 HZ3 LYS A 210 43.401 73.028 58.312 1.00 0.00 H
ATOM 3421 N ASP A 211 49.118 77.292 56.871 1.00 0.00 N
ATOM 3422 CA ASP A 211 50.091 78.212 56.354 1.00 0.00 C
ATOM 3423 C ASP A 211 51.354 77.402 55.933 1.00 0.00 C
ATOM 3424 O ASP A 211 51.941 77.762 54.890 1.00 0.00 O
ATOM 3425 CB ASP A 211 50.349 79.324 57.385 1.00 0.00 C
ATOM 3426 CG ASP A 211 49.338 80.430 57.628 1.00 0.00 C
ATOM 3427 OD1 ASP A 211 48.605 80.791 56.658 1.00 0.00 O
ATOM 3428 OD2 ASP A 211 49.257 80.902 58.797 1.00 0.00 O1-
ATOM 3429 H ASP A 211 49.238 77.102 57.855 1.00 0.00 H
ATOM 3430 HA ASP A 211 49.720 78.558 55.389 1.00 0.00 H
ATOM 3431 HB2 ASP A 211 50.682 78.873 58.320 1.00 0.00 H
ATOM 3432 HB3 ASP A 211 51.234 79.862 57.046 1.00 0.00 H
ATOM 3433 N LEU A 212 51.760 76.285 56.637 1.00 0.00 N
ATOM 3434 CA LEU A 212 52.829 75.536 56.117 1.00 0.00 C
ATOM 3435 C LEU A 212 52.530 74.853 54.770 1.00 0.00 C
ATOM 3436 O LEU A 212 53.378 74.749 53.848 1.00 0.00 O
ATOM 3437 CB LEU A 212 53.288 74.559 57.149 1.00 0.00 C
ATOM 3438 CG LEU A 212 54.565 73.703 56.681 1.00 0.00 C
ATOM 3439 CD1 LEU A 212 55.676 74.569 56.115 1.00 0.00 C
ATOM 3440 CD2 LEU A 212 55.142 72.897 57.780 1.00 0.00 C
ATOM 3441 H LEU A 212 51.224 75.932 57.417 1.00 0.00 H
ATOM 3442 HA LEU A 212 53.706 76.126 55.847 1.00 0.00 H
ATOM 3443 HB2 LEU A 212 53.510 75.085 58.078 1.00 0.00 H
ATOM 3444 HB3 LEU A 212 52.458 73.891 57.381 1.00 0.00 H
ATOM 3445 HG LEU A 212 54.288 73.045 55.858 1.00 0.00 H
ATOM 3446 HD11 LEU A 212 55.602 75.201 55.230 1.00 0.00 H
ATOM 3447 HD12 LEU A 212 55.978 75.360 56.801 1.00 0.00 H
ATOM 3448 HD13 LEU A 212 56.525 73.904 55.955 1.00 0.00 H
ATOM 3449 HD21 LEU A 212 55.930 72.301 57.321 1.00 0.00 H
ATOM 3450 HD22 LEU A 212 55.731 73.503 58.469 1.00 0.00 H
ATOM 3451 HD23 LEU A 212 54.420 72.242 58.267 1.00 0.00 H
ATOM 3452 N GLU A 213 51.255 74.456 54.499 1.00 0.00 N
ATOM 3453 CA GLU A 213 50.976 73.859 53.190 1.00 0.00 C
ATOM 3454 C GLU A 213 51.082 74.939 52.095 1.00 0.00 C
ATOM 3455 O GLU A 213 51.765 74.690 51.103 1.00 0.00 O
ATOM 3456 CB GLU A 213 49.535 73.167 53.253 1.00 0.00 C
ATOM 3457 CG GLU A 213 48.950 72.508 52.001 1.00 0.00 C
ATOM 3458 CD GLU A 213 48.295 73.463 50.925 1.00 0.00 C
ATOM 3459 OE1 GLU A 213 47.526 74.460 51.266 1.00 0.00 O
ATOM 3460 OE2 GLU A 213 48.370 73.124 49.718 1.00 0.00 O1-
ATOM 3461 H GLU A 213 50.562 74.439 55.234 1.00 0.00 H
ATOM 3462 HA GLU A 213 51.782 73.203 52.861 1.00 0.00 H
ATOM 3463 HB2 GLU A 213 49.583 72.318 53.935 1.00 0.00 H
ATOM 3464 HB3 GLU A 213 48.796 73.866 53.645 1.00 0.00 H
ATOM 3465 HG2 GLU A 213 49.750 71.907 51.568 1.00 0.00 H
ATOM 3466 HG3 GLU A 213 48.187 71.789 52.299 1.00 0.00 H
ATOM 3467 N THR A 214 50.640 76.250 52.391 1.00 0.00 N
ATOM 3468 CA THR A 214 50.838 77.423 51.467 1.00 0.00 C
ATOM 3469 C THR A 214 52.265 77.870 51.185 1.00 0.00 C
ATOM 3470 O THR A 214 52.563 78.228 50.057 1.00 0.00 O
ATOM 3471 CB THR A 214 50.103 78.609 52.014 1.00 0.00 C
ATOM 3472 CG2 THR A 214 50.056 79.804 51.096 1.00 0.00 C
ATOM 3473 OG1 THR A 214 48.719 78.204 52.330 1.00 0.00 O
ATOM 3474 H THR A 214 49.867 76.338 53.036 1.00 0.00 H
ATOM 3475 HA THR A 214 50.454 77.244 50.463 1.00 0.00 H
ATOM 3476 HB THR A 214 50.462 78.895 53.002 1.00 0.00 H
ATOM 3477 HG1 THR A 214 48.594 77.799 53.191 1.00 0.00 H
ATOM 3478 HG21 THR A 214 49.244 80.446 51.438 1.00 0.00 H
ATOM 3479 HG22 THR A 214 50.954 80.404 51.239 1.00 0.00 H
ATOM 3480 HG23 THR A 214 49.940 79.542 50.044 1.00 0.00 H
ATOM 3481 N ILE A 215 53.179 77.807 52.174 1.00 0.00 N
ATOM 3482 CA ILE A 215 54.618 77.982 52.032 1.00 0.00 C
ATOM 3483 C ILE A 215 55.226 76.952 51.080 1.00 0.00 C
ATOM 3484 O ILE A 215 56.087 77.317 50.229 1.00 0.00 O
ATOM 3485 CB ILE A 215 55.202 77.932 53.470 1.00 0.00 C
ATOM 3486 CG1 ILE A 215 54.964 79.152 54.305 1.00 0.00 C
ATOM 3487 CG2 ILE A 215 56.705 77.740 53.386 1.00 0.00 C
ATOM 3488 CD1 ILE A 215 55.467 79.039 55.790 1.00 0.00 C
ATOM 3489 H ILE A 215 52.874 77.465 53.074 1.00 0.00 H
ATOM 3490 HA ILE A 215 54.842 78.987 51.675 1.00 0.00 H
ATOM 3491 HB ILE A 215 54.800 77.006 53.880 1.00 0.00 H
ATOM 3492 HG12 ILE A 215 55.472 80.008 53.862 1.00 0.00 H
ATOM 3493 HG13 ILE A 215 53.903 79.395 54.252 1.00 0.00 H
ATOM 3494 HG21 ILE A 215 57.228 77.568 54.328 1.00 0.00 H
ATOM 3495 HG22 ILE A 215 56.878 76.822 52.826 1.00 0.00 H
ATOM 3496 HG23 ILE A 215 57.054 78.523 52.712 1.00 0.00 H
ATOM 3497 HD11 ILE A 215 56.482 79.401 55.952 1.00 0.00 H
ATOM 3498 HD12 ILE A 215 54.753 79.693 56.291 1.00 0.00 H
ATOM 3499 HD13 ILE A 215 55.259 78.036 56.163 1.00 0.00 H
ATOM 3500 N ALA A 216 54.809 75.704 51.083 1.00 0.00 N
ATOM 3501 CA ALA A 216 55.233 74.705 50.121 1.00 0.00 C
ATOM 3502 C ALA A 216 54.733 75.035 48.707 1.00 0.00 C
ATOM 3503 O ALA A 216 55.478 74.770 47.745 1.00 0.00 O
ATOM 3504 CB ALA A 216 54.873 73.281 50.525 1.00 0.00 C
ATOM 3505 H ALA A 216 54.195 75.456 51.846 1.00 0.00 H
ATOM 3506 HA ALA A 216 56.319 74.744 50.030 1.00 0.00 H
ATOM 3507 HB1 ALA A 216 53.785 73.219 50.502 1.00 0.00 H
ATOM 3508 HB2 ALA A 216 55.181 72.559 49.769 1.00 0.00 H
ATOM 3509 HB3 ALA A 216 55.271 72.997 51.498 1.00 0.00 H
ATOM 3510 N ARG A 217 53.587 75.751 48.627 1.00 0.00 N
ATOM 3511 CA ARG A 217 53.043 76.114 47.322 1.00 0.00 C
ATOM 3512 C ARG A 217 53.716 77.415 46.703 1.00 0.00 C
ATOM 3513 O ARG A 217 53.920 77.474 45.501 1.00 0.00 O
ATOM 3514 CB ARG A 217 51.516 76.220 47.435 1.00 0.00 C
ATOM 3515 CG ARG A 217 50.708 74.933 47.552 1.00 0.00 C
ATOM 3516 CD ARG A 217 49.209 75.137 47.414 1.00 0.00 C
ATOM 3517 NE ARG A 217 48.613 75.711 48.613 1.00 0.00 N
ATOM 3518 CZ ARG A 217 48.225 76.950 48.882 1.00 0.00 C
ATOM 3519 NH1 ARG A 217 48.445 77.952 48.134 1.00 0.00 N1+
ATOM 3520 NH2 ARG A 217 47.552 77.019 49.967 1.00 0.00 N
ATOM 3521 H ARG A 217 53.030 75.949 49.445 1.00 0.00 H
ATOM 3522 HA ARG A 217 53.289 75.342 46.592 1.00 0.00 H
ATOM 3523 HB2 ARG A 217 51.145 76.883 48.217 1.00 0.00 H
ATOM 3524 HB3 ARG A 217 51.198 76.703 46.512 1.00 0.00 H
ATOM 3525 HG2 ARG A 217 50.914 74.377 46.637 1.00 0.00 H
ATOM 3526 HG3 ARG A 217 50.971 74.379 48.452 1.00 0.00 H
ATOM 3527 HD2 ARG A 217 49.059 75.774 46.542 1.00 0.00 H
ATOM 3528 HD3 ARG A 217 48.754 74.198 47.098 1.00 0.00 H
ATOM 3529 HE ARG A 217 48.337 74.990 49.265 1.00 0.00 H
ATOM 3530 HH11 ARG A 217 49.012 77.796 47.313 1.00 0.00 H
ATOM 3531 HH12 ARG A 217 48.255 78.871 48.507 1.00 0.00 H
ATOM 3532 HH21 ARG A 217 47.426 76.162 50.487 1.00 0.00 H
ATOM 3533 HH22 ARG A 217 47.612 77.840 50.553 1.00 0.00 H
ATOM 3534 N ASN A 218 54.053 78.362 47.564 1.00 0.00 N
ATOM 3535 CA ASN A 218 54.849 79.577 47.257 1.00 0.00 C
ATOM 3536 C ASN A 218 56.312 79.140 46.979 1.00 0.00 C
ATOM 3537 O ASN A 218 56.942 79.523 45.923 1.00 0.00 O
ATOM 3538 CB ASN A 218 54.795 80.435 48.502 1.00 0.00 C
ATOM 3539 CG ASN A 218 53.609 81.341 48.469 1.00 0.00 C
ATOM 3540 ND2 ASN A 218 53.102 81.743 49.600 1.00 0.00 N
ATOM 3541 OD1 ASN A 218 52.963 81.670 47.451 1.00 0.00 O
ATOM 3542 H ASN A 218 53.800 78.192 48.527 1.00 0.00 H
ATOM 3543 HA ASN A 218 54.517 80.131 46.379 1.00 0.00 H
ATOM 3544 HB2 ASN A 218 54.834 79.833 49.409 1.00 0.00 H
ATOM 3545 HB3 ASN A 218 55.677 81.053 48.672 1.00 0.00 H
ATOM 3546 HD21 ASN A 218 52.256 82.294 49.580 1.00 0.00 H
ATOM 3547 HD22 ASN A 218 53.433 81.319 50.455 1.00 0.00 H
ATOM 3548 N CYS A 219 56.992 78.593 47.984 1.00 0.00 N
ATOM 3549 CA CYS A 219 58.418 78.311 47.999 1.00 0.00 C
ATOM 3550 C CYS A 219 58.766 76.956 47.409 1.00 0.00 C
ATOM 3551 O CYS A 219 59.139 76.052 48.150 1.00 0.00 O
ATOM 3552 CB CYS A 219 59.035 78.584 49.382 1.00 0.00 C
ATOM 3553 SG CYS A 219 58.735 80.333 49.838 1.00 0.00 S
ATOM 3554 H CYS A 219 56.447 78.339 48.796 1.00 0.00 H
ATOM 3555 HA CYS A 219 58.931 79.043 47.375 1.00 0.00 H
ATOM 3556 HB2 CYS A 219 58.614 77.985 50.189 1.00 0.00 H
ATOM 3557 HB3 CYS A 219 60.091 78.336 49.271 1.00 0.00 H
ATOM 3558 HG CYS A 219 57.422 80.458 49.625 1.00 0.00 H
ATOM 3559 N ARG A 220 58.515 76.655 46.135 1.00 0.00 N
ATOM 3560 CA ARG A 220 58.682 75.304 45.539 1.00 0.00 C
ATOM 3561 C ARG A 220 60.216 74.867 45.606 1.00 0.00 C
ATOM 3562 O ARG A 220 60.519 73.680 45.529 1.00 0.00 O
ATOM 3563 CB ARG A 220 58.224 75.356 44.076 1.00 0.00 C
ATOM 3564 CG ARG A 220 56.718 75.605 43.810 1.00 0.00 C
ATOM 3565 CD ARG A 220 55.715 74.498 44.234 1.00 0.00 C
ATOM 3566 NE ARG A 220 54.351 74.954 43.990 1.00 0.00 N
ATOM 3567 CZ ARG A 220 53.293 74.207 43.787 1.00 0.00 C
ATOM 3568 NH1 ARG A 220 53.371 72.906 43.942 1.00 0.00 N1+
ATOM 3569 NH2 ARG A 220 52.188 74.813 43.478 1.00 0.00 N
ATOM 3570 H ARG A 220 58.150 77.397 45.554 1.00 0.00 H
ATOM 3571 HA ARG A 220 57.990 74.591 45.988 1.00 0.00 H
ATOM 3572 HB2 ARG A 220 58.692 76.180 43.537 1.00 0.00 H
ATOM 3573 HB3 ARG A 220 58.537 74.437 43.581 1.00 0.00 H
ATOM 3574 HG2 ARG A 220 56.418 76.590 44.166 1.00 0.00 H
ATOM 3575 HG3 ARG A 220 56.618 75.869 42.757 1.00 0.00 H
ATOM 3576 HD2 ARG A 220 55.861 73.652 43.562 1.00 0.00 H
ATOM 3577 HD3 ARG A 220 55.748 74.098 45.247 1.00 0.00 H
ATOM 3578 HE ARG A 220 54.201 75.933 44.189 1.00 0.00 H
ATOM 3579 HH11 ARG A 220 54.269 72.454 44.036 1.00 0.00 H
ATOM 3580 HH12 ARG A 220 52.614 72.317 43.624 1.00 0.00 H
ATOM 3581 HH21 ARG A 220 52.218 75.755 43.116 1.00 0.00 H
ATOM 3582 HH22 ARG A 220 51.309 74.325 43.380 1.00 0.00 H
ATOM 3583 N SER A 221 61.124 75.798 45.830 1.00 0.00 N
ATOM 3584 CA SER A 221 62.542 75.519 46.114 1.00 0.00 C
ATOM 3585 C SER A 221 62.961 74.967 47.456 1.00 0.00 C
ATOM 3586 O SER A 221 64.076 74.568 47.652 1.00 0.00 O
ATOM 3587 CB SER A 221 63.271 76.868 45.904 1.00 0.00 C
ATOM 3588 OG SER A 221 62.702 77.862 46.729 1.00 0.00 O
ATOM 3589 H SER A 221 60.810 76.758 45.818 1.00 0.00 H
ATOM 3590 HA SER A 221 62.821 74.862 45.289 1.00 0.00 H
ATOM 3591 HB2 SER A 221 64.351 76.822 46.047 1.00 0.00 H
ATOM 3592 HB3 SER A 221 63.147 77.175 44.865 1.00 0.00 H
ATOM 3593 HG SER A 221 62.800 77.615 47.652 1.00 0.00 H
ATOM 3594 N LEU A 222 62.001 74.717 48.436 1.00 0.00 N
ATOM 3595 CA LEU A 222 62.327 74.110 49.742 1.00 0.00 C
ATOM 3596 C LEU A 222 62.825 72.658 49.530 1.00 0.00 C
ATOM 3597 O LEU A 222 62.129 71.807 48.985 1.00 0.00 O
ATOM 3598 CB LEU A 222 61.100 74.136 50.728 1.00 0.00 C
ATOM 3599 CG LEU A 222 60.647 75.474 51.252 1.00 0.00 C
ATOM 3600 CD1 LEU A 222 59.174 75.242 51.627 1.00 0.00 C
ATOM 3601 CD2 LEU A 222 61.463 75.862 52.481 1.00 0.00 C
ATOM 3602 H LEU A 222 61.092 75.112 48.243 1.00 0.00 H
ATOM 3603 HA LEU A 222 63.213 74.628 50.111 1.00 0.00 H
ATOM 3604 HB2 LEU A 222 60.323 73.539 50.250 1.00 0.00 H
ATOM 3605 HB3 LEU A 222 61.379 73.450 51.527 1.00 0.00 H
ATOM 3606 HG LEU A 222 60.802 76.296 50.553 1.00 0.00 H
ATOM 3607 HD11 LEU A 222 58.948 74.323 52.166 1.00 0.00 H
ATOM 3608 HD12 LEU A 222 58.871 76.110 52.212 1.00 0.00 H
ATOM 3609 HD13 LEU A 222 58.597 75.275 50.702 1.00 0.00 H
ATOM 3610 HD21 LEU A 222 61.597 75.185 53.324 1.00 0.00 H
ATOM 3611 HD22 LEU A 222 62.493 75.942 52.134 1.00 0.00 H
ATOM 3612 HD23 LEU A 222 61.165 76.825 52.896 1.00 0.00 H
ATOM 3613 N VAL A 223 64.105 72.427 49.898 1.00 0.00 N
ATOM 3614 CA VAL A 223 64.873 71.209 49.703 1.00 0.00 C
ATOM 3615 C VAL A 223 65.081 70.425 51.040 1.00 0.00 C
ATOM 3616 O VAL A 223 65.584 69.275 51.151 1.00 0.00 O
ATOM 3617 CB VAL A 223 66.124 71.523 48.916 1.00 0.00 C
ATOM 3618 CG1 VAL A 223 67.238 72.193 49.730 1.00 0.00 C
ATOM 3619 CG2 VAL A 223 66.789 70.284 48.358 1.00 0.00 C
ATOM 3620 H VAL A 223 64.617 73.185 50.327 1.00 0.00 H
ATOM 3621 HA VAL A 223 64.290 70.518 49.095 1.00 0.00 H
ATOM 3622 HB VAL A 223 65.967 72.141 48.032 1.00 0.00 H
ATOM 3623 HG11 VAL A 223 66.784 73.081 50.171 1.00 0.00 H
ATOM 3624 HG12 VAL A 223 67.717 71.569 50.485 1.00 0.00 H
ATOM 3625 HG13 VAL A 223 68.054 72.648 49.168 1.00 0.00 H
ATOM 3626 HG21 VAL A 223 67.567 70.575 47.653 1.00 0.00 H
ATOM 3627 HG22 VAL A 223 67.178 69.554 49.068 1.00 0.00 H
ATOM 3628 HG23 VAL A 223 66.097 69.682 47.768 1.00 0.00 H
ATOM 3629 N SER A 224 64.719 71.087 52.111 1.00 0.00 N
ATOM 3630 CA SER A 224 64.735 70.577 53.471 1.00 0.00 C
ATOM 3631 C SER A 224 63.800 71.375 54.372 1.00 0.00 C
ATOM 3632 O SER A 224 63.913 72.598 54.430 1.00 0.00 O
ATOM 3633 CB SER A 224 66.143 70.671 54.101 1.00 0.00 C
ATOM 3634 OG SER A 224 66.202 70.352 55.452 1.00 0.00 O
ATOM 3635 H SER A 224 64.158 71.910 51.947 1.00 0.00 H
ATOM 3636 HA SER A 224 64.384 69.549 53.561 1.00 0.00 H
ATOM 3637 HB2 SER A 224 66.735 69.991 53.489 1.00 0.00 H
ATOM 3638 HB3 SER A 224 66.575 71.661 53.954 1.00 0.00 H
ATOM 3639 HG SER A 224 66.733 69.554 55.516 1.00 0.00 H
ATOM 3640 N VAL A 225 62.877 70.717 55.032 1.00 0.00 N
ATOM 3641 CA VAL A 225 62.012 71.278 56.031 1.00 0.00 C
ATOM 3642 C VAL A 225 62.063 70.370 57.232 1.00 0.00 C
ATOM 3643 O VAL A 225 61.735 69.191 57.097 1.00 0.00 O
ATOM 3644 CB VAL A 225 60.594 71.551 55.514 1.00 0.00 C
ATOM 3645 CG1 VAL A 225 59.571 72.109 56.483 1.00 0.00 C
ATOM 3646 CG2 VAL A 225 60.619 72.502 54.286 1.00 0.00 C
ATOM 3647 H VAL A 225 62.681 69.756 54.792 1.00 0.00 H
ATOM 3648 HA VAL A 225 62.596 72.166 56.271 1.00 0.00 H
ATOM 3649 HB VAL A 225 60.232 70.602 55.118 1.00 0.00 H
ATOM 3650 HG11 VAL A 225 59.538 71.400 57.310 1.00 0.00 H
ATOM 3651 HG12 VAL A 225 59.912 73.103 56.772 1.00 0.00 H
ATOM 3652 HG13 VAL A 225 58.591 72.222 56.020 1.00 0.00 H
ATOM 3653 HG21 VAL A 225 59.599 72.783 54.024 1.00 0.00 H
ATOM 3654 HG22 VAL A 225 61.091 73.418 54.640 1.00 0.00 H
ATOM 3655 HG23 VAL A 225 61.204 71.950 53.550 1.00 0.00 H
ATOM 3656 N LYS A 226 62.327 70.961 58.391 1.00 0.00 N
ATOM 3657 CA LYS A 226 62.115 70.357 59.701 1.00 0.00 C
ATOM 3658 C LYS A 226 61.218 71.203 60.624 1.00 0.00 C
ATOM 3659 O LYS A 226 61.457 72.414 60.686 1.00 0.00 O
ATOM 3660 CB LYS A 226 63.462 69.933 60.326 1.00 0.00 C
ATOM 3661 CG LYS A 226 64.494 69.458 59.302 1.00 0.00 C
ATOM 3662 CD LYS A 226 65.768 69.036 60.150 1.00 0.00 C
ATOM 3663 CE LYS A 226 66.609 68.181 59.193 1.00 0.00 C
ATOM 3664 NZ LYS A 226 67.901 67.809 59.765 1.00 0.00 N1+
ATOM 3665 H LYS A 226 62.481 71.959 58.384 1.00 0.00 H
ATOM 3666 HA LYS A 226 61.600 69.412 59.533 1.00 0.00 H
ATOM 3667 HB2 LYS A 226 64.018 70.746 60.794 1.00 0.00 H
ATOM 3668 HB3 LYS A 226 63.327 69.099 61.014 1.00 0.00 H
ATOM 3669 HG2 LYS A 226 64.027 68.654 58.734 1.00 0.00 H
ATOM 3670 HG3 LYS A 226 64.912 70.070 58.502 1.00 0.00 H
ATOM 3671 HD2 LYS A 226 66.399 69.864 60.472 1.00 0.00 H
ATOM 3672 HD3 LYS A 226 65.394 68.505 61.026 1.00 0.00 H
ATOM 3673 HE2 LYS A 226 66.163 67.245 58.857 1.00 0.00 H
ATOM 3674 HE3 LYS A 226 66.762 68.798 58.308 1.00 0.00 H
ATOM 3675 HZ1 LYS A 226 68.129 68.390 60.560 1.00 0.00 H
ATOM 3676 HZ2 LYS A 226 67.796 66.857 60.085 1.00 0.00 H
ATOM 3677 HZ3 LYS A 226 68.688 67.911 59.140 1.00 0.00 H
ATOM 3678 N VAL A 227 60.310 70.676 61.407 1.00 0.00 N
ATOM 3679 CA VAL A 227 59.213 71.454 62.085 1.00 0.00 C
ATOM 3680 C VAL A 227 58.924 70.894 63.463 1.00 0.00 C
ATOM 3681 O VAL A 227 59.104 69.700 63.749 1.00 0.00 O
ATOM 3682 CB VAL A 227 57.894 71.578 61.282 1.00 0.00 C
ATOM 3683 CG1 VAL A 227 58.131 72.246 59.949 1.00 0.00 C
ATOM 3684 CG2 VAL A 227 57.171 70.237 61.026 1.00 0.00 C
ATOM 3685 H VAL A 227 60.126 69.684 61.436 1.00 0.00 H
ATOM 3686 HA VAL A 227 59.515 72.494 62.211 1.00 0.00 H
ATOM 3687 HB VAL A 227 57.198 72.181 61.866 1.00 0.00 H
ATOM 3688 HG11 VAL A 227 58.461 73.261 60.170 1.00 0.00 H
ATOM 3689 HG12 VAL A 227 59.010 71.757 59.530 1.00 0.00 H
ATOM 3690 HG13 VAL A 227 57.383 72.213 59.157 1.00 0.00 H
ATOM 3691 HG21 VAL A 227 57.848 69.383 61.002 1.00 0.00 H
ATOM 3692 HG22 VAL A 227 56.500 69.963 61.840 1.00 0.00 H
ATOM 3693 HG23 VAL A 227 56.502 70.302 60.169 1.00 0.00 H
ATOM 3694 N GLY A 228 58.257 71.757 64.227 1.00 0.00 N
ATOM 3695 CA GLY A 228 57.463 71.431 65.448 1.00 0.00 C
ATOM 3696 C GLY A 228 56.541 70.210 65.444 1.00 0.00 C
ATOM 3697 O GLY A 228 56.515 69.469 64.428 1.00 0.00 O
ATOM 3698 H GLY A 228 58.292 72.694 63.853 1.00 0.00 H
ATOM 3699 HA2 GLY A 228 58.094 71.364 66.335 1.00 0.00 H
ATOM 3700 HA3 GLY A 228 56.815 72.274 65.690 1.00 0.00 H
ATOM 3701 N ASP A 229 55.729 69.969 66.398 1.00 0.00 N
ATOM 3702 CA ASP A 229 54.883 68.739 66.570 1.00 0.00 C
ATOM 3703 C ASP A 229 53.612 68.796 65.735 1.00 0.00 C
ATOM 3704 O ASP A 229 52.519 68.435 66.238 1.00 0.00 O
ATOM 3705 CB ASP A 229 54.532 68.420 68.022 1.00 0.00 C
ATOM 3706 CG ASP A 229 55.725 68.092 69.006 1.00 0.00 C
ATOM 3707 OD1 ASP A 229 55.460 68.129 70.248 1.00 0.00 O
ATOM 3708 OD2 ASP A 229 56.891 67.846 68.553 1.00 0.00 O1-
ATOM 3709 H ASP A 229 55.431 70.751 66.963 1.00 0.00 H
ATOM 3710 HA ASP A 229 55.294 67.926 65.972 1.00 0.00 H
ATOM 3711 HB2 ASP A 229 53.995 69.209 68.549 1.00 0.00 H
ATOM 3712 HB3 ASP A 229 53.954 67.495 68.017 1.00 0.00 H
ATOM 3713 N PHE A 230 53.610 69.222 64.473 1.00 0.00 N
ATOM 3714 CA PHE A 230 52.440 69.149 63.600 1.00 0.00 C
ATOM 3715 C PHE A 230 52.053 67.668 63.280 1.00 0.00 C
ATOM 3716 O PHE A 230 52.859 66.767 63.034 1.00 0.00 O
ATOM 3717 CB PHE A 230 52.724 69.794 62.280 1.00 0.00 C
ATOM 3718 CG PHE A 230 52.851 71.324 62.324 1.00 0.00 C
ATOM 3719 CD1 PHE A 230 52.062 72.170 63.160 1.00 0.00 C
ATOM 3720 CD2 PHE A 230 53.671 71.917 61.392 1.00 0.00 C
ATOM 3721 CE1 PHE A 230 52.109 73.524 63.077 1.00 0.00 C
ATOM 3722 CE2 PHE A 230 53.647 73.350 61.226 1.00 0.00 C
ATOM 3723 CZ PHE A 230 52.947 74.134 62.089 1.00 0.00 C
ATOM 3724 H PHE A 230 54.455 69.578 64.049 1.00 0.00 H
ATOM 3725 HA PHE A 230 51.551 69.579 64.062 1.00 0.00 H
ATOM 3726 HB2 PHE A 230 53.682 69.394 61.947 1.00 0.00 H
ATOM 3727 HB3 PHE A 230 51.923 69.607 61.565 1.00 0.00 H
ATOM 3728 HD1 PHE A 230 51.412 71.762 63.920 1.00 0.00 H
ATOM 3729 HD2 PHE A 230 54.250 71.376 60.659 1.00 0.00 H
ATOM 3730 HE1 PHE A 230 51.446 74.023 63.769 1.00 0.00 H
ATOM 3731 HE2 PHE A 230 54.239 73.758 60.420 1.00 0.00 H
ATOM 3732 HZ PHE A 230 53.045 75.186 61.865 1.00 0.00 H
ATOM 3733 N GLU A 231 50.789 67.461 63.196 1.00 0.00 N
ATOM 3734 CA GLU A 231 50.066 66.256 62.660 1.00 0.00 C
ATOM 3735 C GLU A 231 50.445 65.876 61.186 1.00 0.00 C
ATOM 3736 O GLU A 231 50.287 66.770 60.253 1.00 0.00 O
ATOM 3737 CB GLU A 231 48.594 66.656 62.882 1.00 0.00 C
ATOM 3738 CG GLU A 231 47.594 65.593 62.271 1.00 0.00 C
ATOM 3739 CD GLU A 231 47.886 64.182 62.653 1.00 0.00 C
ATOM 3740 OE1 GLU A 231 48.375 63.386 61.783 1.00 0.00 O
ATOM 3741 OE2 GLU A 231 47.643 63.800 63.806 1.00 0.00 O1-
ATOM 3742 H GLU A 231 50.137 68.165 63.510 1.00 0.00 H
ATOM 3743 HA GLU A 231 50.406 65.391 63.230 1.00 0.00 H
ATOM 3744 HB2 GLU A 231 48.424 66.688 63.958 1.00 0.00 H
ATOM 3745 HB3 GLU A 231 48.331 67.627 62.463 1.00 0.00 H
ATOM 3746 HG2 GLU A 231 46.575 65.791 62.606 1.00 0.00 H
ATOM 3747 HG3 GLU A 231 47.636 65.778 61.198 1.00 0.00 H
ATOM 3748 N ILE A 232 50.894 64.662 60.885 1.00 0.00 N
ATOM 3749 CA ILE A 232 51.107 64.183 59.504 1.00 0.00 C
ATOM 3750 C ILE A 232 49.860 64.294 58.581 1.00 0.00 C
ATOM 3751 O ILE A 232 50.002 64.657 57.412 1.00 0.00 O
ATOM 3752 CB ILE A 232 51.758 62.723 59.602 1.00 0.00 C
ATOM 3753 CG1 ILE A 232 53.203 62.801 60.203 1.00 0.00 C
ATOM 3754 CG2 ILE A 232 51.807 61.900 58.302 1.00 0.00 C
ATOM 3755 CD1 ILE A 232 54.231 63.760 59.636 1.00 0.00 C
ATOM 3756 H ILE A 232 51.045 64.019 61.650 1.00 0.00 H
ATOM 3757 HA ILE A 232 51.756 64.884 58.978 1.00 0.00 H
ATOM 3758 HB ILE A 232 51.140 62.173 60.312 1.00 0.00 H
ATOM 3759 HG12 ILE A 232 53.094 62.907 61.282 1.00 0.00 H
ATOM 3760 HG13 ILE A 232 53.606 61.793 60.102 1.00 0.00 H
ATOM 3761 HG21 ILE A 232 50.794 61.780 57.918 1.00 0.00 H
ATOM 3762 HG22 ILE A 232 52.328 62.428 57.503 1.00 0.00 H
ATOM 3763 HG23 ILE A 232 52.313 60.945 58.441 1.00 0.00 H
ATOM 3764 HD11 ILE A 232 54.509 63.546 58.604 1.00 0.00 H
ATOM 3765 HD12 ILE A 232 53.960 64.802 59.809 1.00 0.00 H
ATOM 3766 HD13 ILE A 232 55.093 63.575 60.277 1.00 0.00 H
ATOM 3767 N LEU A 233 48.602 64.020 59.106 1.00 0.00 N
ATOM 3768 CA LEU A 233 47.344 64.251 58.415 1.00 0.00 C
ATOM 3769 C LEU A 233 46.988 65.670 57.866 1.00 0.00 C
ATOM 3770 O LEU A 233 46.613 65.876 56.704 1.00 0.00 O
ATOM 3771 CB LEU A 233 46.255 63.600 59.251 1.00 0.00 C
ATOM 3772 CG LEU A 233 44.790 63.728 58.749 1.00 0.00 C
ATOM 3773 CD1 LEU A 233 44.551 63.019 57.405 1.00 0.00 C
ATOM 3774 CD2 LEU A 233 43.884 63.076 59.814 1.00 0.00 C
ATOM 3775 H LEU A 233 48.498 63.828 60.092 1.00 0.00 H
ATOM 3776 HA LEU A 233 47.369 63.587 57.550 1.00 0.00 H
ATOM 3777 HB2 LEU A 233 46.523 62.552 59.386 1.00 0.00 H
ATOM 3778 HB3 LEU A 233 46.306 64.102 60.217 1.00 0.00 H
ATOM 3779 HG LEU A 233 44.505 64.767 58.583 1.00 0.00 H
ATOM 3780 HD11 LEU A 233 45.203 63.459 56.651 1.00 0.00 H
ATOM 3781 HD12 LEU A 233 44.682 61.937 57.413 1.00 0.00 H
ATOM 3782 HD13 LEU A 233 43.538 63.281 57.100 1.00 0.00 H
ATOM 3783 HD21 LEU A 233 44.189 63.431 60.799 1.00 0.00 H
ATOM 3784 HD22 LEU A 233 42.839 63.340 59.655 1.00 0.00 H
ATOM 3785 HD23 LEU A 233 43.941 61.995 59.687 1.00 0.00 H
ATOM 3786 N GLU A 234 47.297 66.712 58.675 1.00 0.00 N
ATOM 3787 CA GLU A 234 47.302 68.117 58.174 1.00 0.00 C
ATOM 3788 C GLU A 234 48.415 68.507 57.235 1.00 0.00 C
ATOM 3789 O GLU A 234 48.337 69.586 56.642 1.00 0.00 O
ATOM 3790 CB GLU A 234 47.296 69.030 59.419 1.00 0.00 C
ATOM 3791 CG GLU A 234 46.181 68.946 60.389 1.00 0.00 C
ATOM 3792 CD GLU A 234 44.764 68.884 59.775 1.00 0.00 C
ATOM 3793 OE1 GLU A 234 43.782 68.571 60.541 1.00 0.00 O
ATOM 3794 OE2 GLU A 234 44.469 69.299 58.640 1.00 0.00 O1-
ATOM 3795 H GLU A 234 47.797 66.491 59.524 1.00 0.00 H
ATOM 3796 HA GLU A 234 46.344 68.218 57.664 1.00 0.00 H
ATOM 3797 HB2 GLU A 234 48.220 68.804 59.952 1.00 0.00 H
ATOM 3798 HB3 GLU A 234 47.378 70.064 59.084 1.00 0.00 H
ATOM 3799 HG2 GLU A 234 46.344 67.976 60.858 1.00 0.00 H
ATOM 3800 HG3 GLU A 234 46.349 69.761 61.094 1.00 0.00 H
ATOM 3801 N LEU A 235 49.441 67.629 57.019 1.00 0.00 N
ATOM 3802 CA LEU A 235 50.478 67.751 56.023 1.00 0.00 C
ATOM 3803 C LEU A 235 50.378 66.886 54.720 1.00 0.00 C
ATOM 3804 O LEU A 235 51.221 66.978 53.832 1.00 0.00 O
ATOM 3805 CB LEU A 235 51.823 67.607 56.701 1.00 0.00 C
ATOM 3806 CG LEU A 235 52.201 68.511 57.829 1.00 0.00 C
ATOM 3807 CD1 LEU A 235 53.448 67.805 58.439 1.00 0.00 C
ATOM 3808 CD2 LEU A 235 52.557 69.884 57.333 1.00 0.00 C
ATOM 3809 H LEU A 235 49.346 66.823 57.620 1.00 0.00 H
ATOM 3810 HA LEU A 235 50.486 68.757 55.602 1.00 0.00 H
ATOM 3811 HB2 LEU A 235 51.809 66.624 57.172 1.00 0.00 H
ATOM 3812 HB3 LEU A 235 52.546 67.657 55.887 1.00 0.00 H
ATOM 3813 HG LEU A 235 51.436 68.612 58.599 1.00 0.00 H
ATOM 3814 HD11 LEU A 235 53.810 68.369 59.299 1.00 0.00 H
ATOM 3815 HD12 LEU A 235 53.191 66.831 58.856 1.00 0.00 H
ATOM 3816 HD13 LEU A 235 54.223 67.714 57.678 1.00 0.00 H
ATOM 3817 HD21 LEU A 235 51.770 70.229 56.662 1.00 0.00 H
ATOM 3818 HD22 LEU A 235 52.619 70.517 58.218 1.00 0.00 H
ATOM 3819 HD23 LEU A 235 53.514 69.824 56.813 1.00 0.00 H
ATOM 3820 N VAL A 236 49.257 66.169 54.452 1.00 0.00 N
ATOM 3821 CA VAL A 236 49.035 65.460 53.210 1.00 0.00 C
ATOM 3822 C VAL A 236 49.183 66.366 51.988 1.00 0.00 C
ATOM 3823 O VAL A 236 49.755 66.028 50.937 1.00 0.00 O
ATOM 3824 CB VAL A 236 47.570 64.767 53.199 1.00 0.00 C
ATOM 3825 CG1 VAL A 236 47.355 64.067 51.859 1.00 0.00 C
ATOM 3826 CG2 VAL A 236 47.314 63.679 54.248 1.00 0.00 C
ATOM 3827 H VAL A 236 48.625 66.027 55.227 1.00 0.00 H
ATOM 3828 HA VAL A 236 49.706 64.602 53.172 1.00 0.00 H
ATOM 3829 HB VAL A 236 46.783 65.513 53.309 1.00 0.00 H
ATOM 3830 HG11 VAL A 236 47.614 64.714 51.021 1.00 0.00 H
ATOM 3831 HG12 VAL A 236 47.997 63.204 51.685 1.00 0.00 H
ATOM 3832 HG13 VAL A 236 46.333 63.712 51.728 1.00 0.00 H
ATOM 3833 HG21 VAL A 236 47.633 64.038 55.227 1.00 0.00 H
ATOM 3834 HG22 VAL A 236 46.237 63.540 54.342 1.00 0.00 H
ATOM 3835 HG23 VAL A 236 47.869 62.782 53.974 1.00 0.00 H
ATOM 3836 N GLY A 237 48.685 67.598 52.022 1.00 0.00 N
ATOM 3837 CA GLY A 237 48.704 68.644 51.010 1.00 0.00 C
ATOM 3838 C GLY A 237 50.026 69.315 50.894 1.00 0.00 C
ATOM 3839 O GLY A 237 50.411 69.746 49.779 1.00 0.00 O
ATOM 3840 H GLY A 237 48.100 67.859 52.803 1.00 0.00 H
ATOM 3841 HA2 GLY A 237 48.408 68.301 50.019 1.00 0.00 H
ATOM 3842 HA3 GLY A 237 47.985 69.422 51.266 1.00 0.00 H
ATOM 3843 N PHE A 238 50.803 69.370 51.942 1.00 0.00 N
ATOM 3844 CA PHE A 238 52.146 69.981 51.921 1.00 0.00 C
ATOM 3845 C PHE A 238 53.025 69.103 51.029 1.00 0.00 C
ATOM 3846 O PHE A 238 53.643 69.640 50.069 1.00 0.00 O
ATOM 3847 CB PHE A 238 52.643 69.965 53.341 1.00 0.00 C
ATOM 3848 CG PHE A 238 54.150 70.180 53.568 1.00 0.00 C
ATOM 3849 CD1 PHE A 238 54.883 69.051 54.034 1.00 0.00 C
ATOM 3850 CD2 PHE A 238 54.750 71.457 53.466 1.00 0.00 C
ATOM 3851 CE1 PHE A 238 56.246 69.215 54.304 1.00 0.00 C
ATOM 3852 CE2 PHE A 238 56.145 71.519 53.603 1.00 0.00 C
ATOM 3853 CZ PHE A 238 56.899 70.411 54.087 1.00 0.00 C
ATOM 3854 H PHE A 238 50.403 69.030 52.805 1.00 0.00 H
ATOM 3855 HA PHE A 238 52.242 71.030 51.638 1.00 0.00 H
ATOM 3856 HB2 PHE A 238 52.156 70.795 53.852 1.00 0.00 H
ATOM 3857 HB3 PHE A 238 52.392 69.008 53.799 1.00 0.00 H
ATOM 3858 HD1 PHE A 238 54.459 68.073 54.211 1.00 0.00 H
ATOM 3859 HD2 PHE A 238 54.209 72.366 53.247 1.00 0.00 H
ATOM 3860 HE1 PHE A 238 56.784 68.370 54.708 1.00 0.00 H
ATOM 3861 HE2 PHE A 238 56.665 72.461 53.509 1.00 0.00 H
ATOM 3862 HZ PHE A 238 57.972 70.402 54.211 1.00 0.00 H
ATOM 3863 N PHE A 239 53.130 67.821 51.366 1.00 0.00 N
ATOM 3864 CA PHE A 239 54.116 66.884 50.736 1.00 0.00 C
ATOM 3865 C PHE A 239 53.706 66.692 49.258 1.00 0.00 C
ATOM 3866 O PHE A 239 54.449 66.145 48.499 1.00 0.00 O
ATOM 3867 CB PHE A 239 54.177 65.426 51.410 1.00 0.00 C
ATOM 3868 CG PHE A 239 54.728 65.256 52.791 1.00 0.00 C
ATOM 3869 CD1 PHE A 239 53.969 65.154 53.975 1.00 0.00 C
ATOM 3870 CD2 PHE A 239 56.178 65.348 52.960 1.00 0.00 C
ATOM 3871 CE1 PHE A 239 54.539 65.050 55.269 1.00 0.00 C
ATOM 3872 CE2 PHE A 239 56.667 65.162 54.229 1.00 0.00 C
ATOM 3873 CZ PHE A 239 55.931 65.045 55.393 1.00 0.00 C
ATOM 3874 H PHE A 239 52.436 67.408 51.971 1.00 0.00 H
ATOM 3875 HA PHE A 239 55.064 67.410 50.621 1.00 0.00 H
ATOM 3876 HB2 PHE A 239 53.182 64.981 51.403 1.00 0.00 H
ATOM 3877 HB3 PHE A 239 54.810 64.884 50.708 1.00 0.00 H
ATOM 3878 HD1 PHE A 239 52.919 64.930 53.864 1.00 0.00 H
ATOM 3879 HD2 PHE A 239 56.792 65.470 52.079 1.00 0.00 H
ATOM 3880 HE1 PHE A 239 54.019 64.895 56.203 1.00 0.00 H
ATOM 3881 HE2 PHE A 239 57.742 65.125 54.334 1.00 0.00 H
ATOM 3882 HZ PHE A 239 56.401 64.963 56.362 1.00 0.00 H
ATOM 3883 N LYS A 240 52.555 67.147 48.818 1.00 0.00 N
ATOM 3884 CA LYS A 240 52.132 67.178 47.408 1.00 0.00 C
ATOM 3885 C LYS A 240 52.610 68.510 46.783 1.00 0.00 C
ATOM 3886 O LYS A 240 53.235 68.408 45.743 1.00 0.00 O
ATOM 3887 CB LYS A 240 50.590 67.050 47.335 1.00 0.00 C
ATOM 3888 CG LYS A 240 50.198 65.578 47.433 1.00 0.00 C
ATOM 3889 CD LYS A 240 48.705 65.415 47.206 1.00 0.00 C
ATOM 3890 CE LYS A 240 47.732 66.481 47.680 1.00 0.00 C
ATOM 3891 NZ LYS A 240 46.314 66.110 47.315 1.00 0.00 N1+
ATOM 3892 H LYS A 240 51.944 67.567 49.504 1.00 0.00 H
ATOM 3893 HA LYS A 240 52.461 66.388 46.733 1.00 0.00 H
ATOM 3894 HB2 LYS A 240 50.065 67.595 48.119 1.00 0.00 H
ATOM 3895 HB3 LYS A 240 50.288 67.400 46.348 1.00 0.00 H
ATOM 3896 HG2 LYS A 240 50.620 64.975 46.629 1.00 0.00 H
ATOM 3897 HG3 LYS A 240 50.391 65.104 48.396 1.00 0.00 H
ATOM 3898 HD2 LYS A 240 48.546 65.300 46.133 1.00 0.00 H
ATOM 3899 HD3 LYS A 240 48.474 64.448 47.655 1.00 0.00 H
ATOM 3900 HE2 LYS A 240 47.691 66.494 48.769 1.00 0.00 H
ATOM 3901 HE3 LYS A 240 47.970 67.455 47.252 1.00 0.00 H
ATOM 3902 HZ1 LYS A 240 45.820 65.574 48.014 1.00 0.00 H
ATOM 3903 HZ2 LYS A 240 45.708 66.915 47.237 1.00 0.00 H
ATOM 3904 HZ3 LYS A 240 46.378 65.593 46.449 1.00 0.00 H
ATOM 3905 N ALA A 241 52.463 69.647 47.444 1.00 0.00 N
ATOM 3906 CA ALA A 241 53.089 70.931 47.146 1.00 0.00 C
ATOM 3907 C ALA A 241 54.598 70.914 47.041 1.00 0.00 C
ATOM 3908 O ALA A 241 55.218 71.646 46.243 1.00 0.00 O
ATOM 3909 CB ALA A 241 52.538 71.969 48.098 1.00 0.00 C
ATOM 3910 H ALA A 241 51.872 69.602 48.262 1.00 0.00 H
ATOM 3911 HA ALA A 241 52.769 71.246 46.153 1.00 0.00 H
ATOM 3912 HB1 ALA A 241 51.452 71.926 48.025 1.00 0.00 H
ATOM 3913 HB2 ALA A 241 52.888 71.750 49.107 1.00 0.00 H
ATOM 3914 HB3 ALA A 241 52.899 72.982 47.922 1.00 0.00 H
ATOM 3915 N ALA A 242 55.243 70.064 47.845 1.00 0.00 N
ATOM 3916 CA ALA A 242 56.738 69.892 48.108 1.00 0.00 C
ATOM 3917 C ALA A 242 57.480 68.961 47.119 1.00 0.00 C
ATOM 3918 O ALA A 242 58.029 67.893 47.518 1.00 0.00 O
ATOM 3919 CB ALA A 242 56.933 69.334 49.538 1.00 0.00 C
ATOM 3920 H ALA A 242 54.669 69.609 48.540 1.00 0.00 H
ATOM 3921 HA ALA A 242 57.250 70.853 48.052 1.00 0.00 H
ATOM 3922 HB1 ALA A 242 56.732 68.267 49.635 1.00 0.00 H
ATOM 3923 HB2 ALA A 242 57.864 69.735 49.938 1.00 0.00 H
ATOM 3924 HB3 ALA A 242 56.172 69.810 50.157 1.00 0.00 H
ATOM 3925 N ALA A 243 57.495 69.265 45.820 1.00 0.00 N
ATOM 3926 CA ALA A 243 57.968 68.389 44.760 1.00 0.00 C
ATOM 3927 C ALA A 243 59.548 68.145 44.897 1.00 0.00 C
ATOM 3928 O ALA A 243 59.956 67.075 44.531 1.00 0.00 O
ATOM 3929 CB ALA A 243 57.865 69.097 43.379 1.00 0.00 C
ATOM 3930 H ALA A 243 57.117 70.169 45.577 1.00 0.00 H
ATOM 3931 HA ALA A 243 57.446 67.433 44.725 1.00 0.00 H
ATOM 3932 HB1 ALA A 243 58.241 68.393 42.637 1.00 0.00 H
ATOM 3933 HB2 ALA A 243 56.861 69.340 43.032 1.00 0.00 H
ATOM 3934 HB3 ALA A 243 58.443 70.020 43.413 1.00 0.00 H
ATOM 3935 N ASN A 244 60.329 69.007 45.564 1.00 0.00 N
ATOM 3936 CA ASN A 244 61.806 68.960 45.586 1.00 0.00 C
ATOM 3937 C ASN A 244 62.414 68.707 46.996 1.00 0.00 C
ATOM 3938 O ASN A 244 63.622 68.816 47.215 1.00 0.00 O
ATOM 3939 CB ASN A 244 62.467 70.251 44.877 1.00 0.00 C
ATOM 3940 CG ASN A 244 61.896 70.593 43.492 1.00 0.00 C
ATOM 3941 ND2 ASN A 244 61.440 71.829 43.331 1.00 0.00 N
ATOM 3942 OD1 ASN A 244 61.618 69.722 42.674 1.00 0.00 O
ATOM 3943 H ASN A 244 60.005 69.852 46.012 1.00 0.00 H
ATOM 3944 HA ASN A 244 62.000 68.152 44.881 1.00 0.00 H
ATOM 3945 HB2 ASN A 244 62.243 71.159 45.436 1.00 0.00 H
ATOM 3946 HB3 ASN A 244 63.551 70.227 44.990 1.00 0.00 H
ATOM 3947 HD21 ASN A 244 61.105 72.032 42.400 1.00 0.00 H
ATOM 3948 HD22 ASN A 244 61.597 72.547 44.025 1.00 0.00 H
ATOM 3949 N LEU A 245 61.506 68.427 47.951 1.00 0.00 N
ATOM 3950 CA LEU A 245 61.816 68.056 49.314 1.00 0.00 C
ATOM 3951 C LEU A 245 62.603 66.732 49.362 1.00 0.00 C
ATOM 3952 O LEU A 245 62.065 65.685 49.102 1.00 0.00 O
ATOM 3953 CB LEU A 245 60.539 68.049 50.057 1.00 0.00 C
ATOM 3954 CG LEU A 245 60.599 67.887 51.635 1.00 0.00 C
ATOM 3955 CD1 LEU A 245 61.053 69.214 52.359 1.00 0.00 C
ATOM 3956 CD2 LEU A 245 59.277 67.476 52.222 1.00 0.00 C
ATOM 3957 H LEU A 245 60.542 68.520 47.662 1.00 0.00 H
ATOM 3958 HA LEU A 245 62.429 68.885 49.667 1.00 0.00 H
ATOM 3959 HB2 LEU A 245 59.975 68.973 49.926 1.00 0.00 H
ATOM 3960 HB3 LEU A 245 59.865 67.284 49.671 1.00 0.00 H
ATOM 3961 HG LEU A 245 61.292 67.063 51.808 1.00 0.00 H
ATOM 3962 HD11 LEU A 245 61.265 69.058 53.417 1.00 0.00 H
ATOM 3963 HD12 LEU A 245 61.992 69.576 51.941 1.00 0.00 H
ATOM 3964 HD13 LEU A 245 60.354 70.029 52.172 1.00 0.00 H
ATOM 3965 HD21 LEU A 245 58.948 66.565 51.722 1.00 0.00 H
ATOM 3966 HD22 LEU A 245 59.458 67.417 53.296 1.00 0.00 H
ATOM 3967 HD23 LEU A 245 58.504 68.229 52.073 1.00 0.00 H
ATOM 3968 N GLU A 246 63.872 66.857 49.666 1.00 0.00 N
ATOM 3969 CA GLU A 246 64.810 65.746 49.937 1.00 0.00 C
ATOM 3970 C GLU A 246 64.841 65.169 51.349 1.00 0.00 C
ATOM 3971 O GLU A 246 65.142 64.001 51.568 1.00 0.00 O
ATOM 3972 CB GLU A 246 66.294 66.256 49.692 1.00 0.00 C
ATOM 3973 CG GLU A 246 67.531 65.424 50.114 1.00 0.00 C
ATOM 3974 CD GLU A 246 68.789 66.248 49.809 1.00 0.00 C
ATOM 3975 OE1 GLU A 246 69.238 67.099 50.653 1.00 0.00 O
ATOM 3976 OE2 GLU A 246 69.450 65.998 48.759 1.00 0.00 O1-
ATOM 3977 H GLU A 246 64.206 67.750 49.999 1.00 0.00 H
ATOM 3978 HA GLU A 246 64.544 64.930 49.265 1.00 0.00 H
ATOM 3979 HB2 GLU A 246 66.421 66.512 48.640 1.00 0.00 H
ATOM 3980 HB3 GLU A 246 66.381 67.170 50.279 1.00 0.00 H
ATOM 3981 HG2 GLU A 246 67.464 65.214 51.182 1.00 0.00 H
ATOM 3982 HG3 GLU A 246 67.495 64.488 49.557 1.00 0.00 H
ATOM 3983 N GLU A 247 64.341 66.001 52.249 1.00 0.00 N
ATOM 3984 CA GLU A 247 64.411 65.752 53.649 1.00 0.00 C
ATOM 3985 C GLU A 247 63.257 66.351 54.433 1.00 0.00 C
ATOM 3986 O GLU A 247 62.805 67.502 54.296 1.00 0.00 O
ATOM 3987 CB GLU A 247 65.702 66.527 54.116 1.00 0.00 C
ATOM 3988 CG GLU A 247 65.948 66.517 55.631 1.00 0.00 C
ATOM 3989 CD GLU A 247 67.363 67.079 55.906 1.00 0.00 C
ATOM 3990 OE1 GLU A 247 67.736 68.128 55.411 1.00 0.00 O
ATOM 3991 OE2 GLU A 247 68.222 66.335 56.479 1.00 0.00 O1-
ATOM 3992 H GLU A 247 63.970 66.876 51.908 1.00 0.00 H
ATOM 3993 HA GLU A 247 64.537 64.678 53.788 1.00 0.00 H
ATOM 3994 HB2 GLU A 247 66.525 65.999 53.634 1.00 0.00 H
ATOM 3995 HB3 GLU A 247 65.653 67.533 53.699 1.00 0.00 H
ATOM 3996 HG2 GLU A 247 65.227 67.157 56.140 1.00 0.00 H
ATOM 3997 HG3 GLU A 247 65.939 65.488 55.989 1.00 0.00 H
ATOM 3998 N PHE A 248 62.691 65.514 55.320 1.00 0.00 N
ATOM 3999 CA PHE A 248 61.728 66.004 56.354 1.00 0.00 C
ATOM 4000 C PHE A 248 62.077 65.542 57.766 1.00 0.00 C
ATOM 4001 O PHE A 248 62.298 64.334 57.995 1.00 0.00 O
ATOM 4002 CB PHE A 248 60.300 65.640 55.954 1.00 0.00 C
ATOM 4003 CG PHE A 248 59.164 65.975 56.947 1.00 0.00 C
ATOM 4004 CD1 PHE A 248 58.956 65.200 58.106 1.00 0.00 C
ATOM 4005 CD2 PHE A 248 58.555 67.230 56.786 1.00 0.00 C
ATOM 4006 CE1 PHE A 248 58.046 65.727 59.077 1.00 0.00 C
ATOM 4007 CE2 PHE A 248 57.587 67.701 57.723 1.00 0.00 C
ATOM 4008 CZ PHE A 248 57.330 66.911 58.889 1.00 0.00 C
ATOM 4009 H PHE A 248 62.979 64.557 55.466 1.00 0.00 H
ATOM 4010 HA PHE A 248 61.790 67.090 56.434 1.00 0.00 H
ATOM 4011 HB2 PHE A 248 60.029 66.120 55.013 1.00 0.00 H
ATOM 4012 HB3 PHE A 248 60.315 64.563 55.787 1.00 0.00 H
ATOM 4013 HD1 PHE A 248 59.653 64.392 58.269 1.00 0.00 H
ATOM 4014 HD2 PHE A 248 58.736 67.820 55.899 1.00 0.00 H
ATOM 4015 HE1 PHE A 248 57.934 65.232 60.030 1.00 0.00 H
ATOM 4016 HE2 PHE A 248 57.035 68.608 57.525 1.00 0.00 H
ATOM 4017 HZ PHE A 248 56.602 67.317 59.575 1.00 0.00 H
ATOM 4018 N CYS A 249 61.885 66.414 58.821 1.00 0.00 N
ATOM 4019 CA CYS A 249 62.091 65.936 60.208 1.00 0.00 C
ATOM 4020 C CYS A 249 61.143 66.540 61.215 1.00 0.00 C
ATOM 4021 O CYS A 249 60.797 67.699 61.020 1.00 0.00 O
ATOM 4022 CB CYS A 249 63.524 66.075 60.623 1.00 0.00 C
ATOM 4023 SG CYS A 249 64.706 65.088 59.777 1.00 0.00 S
ATOM 4024 H CYS A 249 61.514 67.345 58.692 1.00 0.00 H
ATOM 4025 HA CYS A 249 61.821 64.882 60.269 1.00 0.00 H
ATOM 4026 HB2 CYS A 249 63.795 67.130 60.578 1.00 0.00 H
ATOM 4027 HB3 CYS A 249 63.629 65.795 61.672 1.00 0.00 H
ATOM 4028 HG CYS A 249 65.662 65.146 60.708 1.00 0.00 H
ATOM 4029 N GLY A 250 60.720 65.782 62.208 1.00 0.00 N
ATOM 4030 CA GLY A 250 59.876 66.290 63.241 1.00 0.00 C
ATOM 4031 C GLY A 250 58.503 65.649 63.010 1.00 0.00 C
ATOM 4032 O GLY A 250 58.367 64.448 62.931 1.00 0.00 O
ATOM 4033 H GLY A 250 61.020 64.818 62.221 1.00 0.00 H
ATOM 4034 HA2 GLY A 250 60.196 66.132 64.271 1.00 0.00 H
ATOM 4035 HA3 GLY A 250 59.739 67.368 63.161 1.00 0.00 H
ATOM 4036 N GLY A 251 57.445 66.440 63.024 1.00 0.00 N
ATOM 4037 CA GLY A 251 56.027 65.937 62.960 1.00 0.00 C
ATOM 4038 C GLY A 251 55.504 65.377 64.192 1.00 0.00 C
ATOM 4039 O GLY A 251 56.164 65.515 65.214 1.00 0.00 O
ATOM 4040 H GLY A 251 57.617 67.424 63.173 1.00 0.00 H
ATOM 4041 HA2 GLY A 251 55.409 66.827 62.842 1.00 0.00 H
ATOM 4042 HA3 GLY A 251 55.939 65.245 62.122 1.00 0.00 H
ATOM 4043 N SER A 252 54.340 64.760 64.093 1.00 0.00 N
ATOM 4044 CA SER A 252 53.688 63.985 65.172 1.00 0.00 C
ATOM 4045 C SER A 252 52.618 63.058 64.615 1.00 0.00 C
ATOM 4046 O SER A 252 51.822 63.402 63.795 1.00 0.00 O
ATOM 4047 CB SER A 252 53.063 65.070 65.982 1.00 0.00 C
ATOM 4048 OG SER A 252 52.243 64.563 67.029 1.00 0.00 O
ATOM 4049 H SER A 252 53.974 64.724 63.153 1.00 0.00 H
ATOM 4050 HA SER A 252 54.464 63.478 65.746 1.00 0.00 H
ATOM 4051 HB2 SER A 252 53.847 65.634 66.487 1.00 0.00 H
ATOM 4052 HB3 SER A 252 52.395 65.692 65.385 1.00 0.00 H
ATOM 4053 HG SER A 252 51.849 65.347 67.418 1.00 0.00 H
ATOM 4054 N LEU A 253 52.613 61.848 65.119 1.00 0.00 N
ATOM 4055 CA LEU A 253 51.579 60.800 64.928 1.00 0.00 C
ATOM 4056 C LEU A 253 50.675 60.617 66.224 1.00 0.00 C
ATOM 4057 O LEU A 253 51.120 60.794 67.373 1.00 0.00 O
ATOM 4058 CB LEU A 253 52.256 59.517 64.462 1.00 0.00 C
ATOM 4059 CG LEU A 253 53.115 59.399 63.169 1.00 0.00 C
ATOM 4060 CD1 LEU A 253 52.363 59.752 61.958 1.00 0.00 C
ATOM 4061 CD2 LEU A 253 54.391 60.208 63.204 1.00 0.00 C
ATOM 4062 H LEU A 253 53.290 61.497 65.782 1.00 0.00 H
ATOM 4063 HA LEU A 253 50.955 61.052 64.070 1.00 0.00 H
ATOM 4064 HB2 LEU A 253 52.826 59.287 65.362 1.00 0.00 H
ATOM 4065 HB3 LEU A 253 51.491 58.743 64.409 1.00 0.00 H
ATOM 4066 HG LEU A 253 53.348 58.335 63.153 1.00 0.00 H
ATOM 4067 HD11 LEU A 253 52.132 60.817 61.962 1.00 0.00 H
ATOM 4068 HD12 LEU A 253 53.044 59.399 61.184 1.00 0.00 H
ATOM 4069 HD13 LEU A 253 51.456 59.149 61.914 1.00 0.00 H
ATOM 4070 HD21 LEU A 253 54.089 61.255 63.174 1.00 0.00 H
ATOM 4071 HD22 LEU A 253 54.855 60.075 64.181 1.00 0.00 H
ATOM 4072 HD23 LEU A 253 55.143 59.864 62.494 1.00 0.00 H
ATOM 4073 N ASN A 254 49.352 60.494 65.944 1.00 0.00 N
ATOM 4074 CA ASN A 254 48.307 60.776 66.949 1.00 0.00 C
ATOM 4075 C ASN A 254 47.109 59.795 66.862 1.00 0.00 C
ATOM 4076 O ASN A 254 46.532 59.607 65.811 1.00 0.00 O
ATOM 4077 CB ASN A 254 47.904 62.251 66.768 1.00 0.00 C
ATOM 4078 CG ASN A 254 49.078 63.186 67.050 1.00 0.00 C
ATOM 4079 ND2 ASN A 254 49.748 63.655 65.997 1.00 0.00 N
ATOM 4080 OD1 ASN A 254 49.413 63.489 68.189 1.00 0.00 O
ATOM 4081 H ASN A 254 49.087 60.470 64.969 1.00 0.00 H
ATOM 4082 HA ASN A 254 48.683 60.607 67.958 1.00 0.00 H
ATOM 4083 HB2 ASN A 254 47.547 62.423 65.752 1.00 0.00 H
ATOM 4084 HB3 ASN A 254 47.081 62.489 67.441 1.00 0.00 H
ATOM 4085 HD21 ASN A 254 50.679 63.968 66.232 1.00 0.00 H
ATOM 4086 HD22 ASN A 254 49.492 63.319 65.080 1.00 0.00 H
ATOM 4087 N GLU A 255 46.678 59.226 67.982 1.00 0.00 N
ATOM 4088 CA GLU A 255 45.733 58.133 68.104 1.00 0.00 C
ATOM 4089 C GLU A 255 44.259 58.561 68.120 1.00 0.00 C
ATOM 4090 O GLU A 255 43.921 59.400 68.933 1.00 0.00 O
ATOM 4091 CB GLU A 255 45.997 57.342 69.371 1.00 0.00 C
ATOM 4092 CG GLU A 255 45.094 56.157 69.741 1.00 0.00 C
ATOM 4093 CD GLU A 255 45.898 54.923 70.072 1.00 0.00 C
ATOM 4094 OE1 GLU A 255 46.431 54.932 71.226 1.00 0.00 O
ATOM 4095 OE2 GLU A 255 46.015 53.969 69.252 1.00 0.00 O1-
ATOM 4096 H GLU A 255 47.214 59.429 68.814 1.00 0.00 H
ATOM 4097 HA GLU A 255 45.838 57.444 67.266 1.00 0.00 H
ATOM 4098 HB2 GLU A 255 46.985 56.891 69.274 1.00 0.00 H
ATOM 4099 HB3 GLU A 255 45.911 58.056 70.191 1.00 0.00 H
ATOM 4100 HG2 GLU A 255 44.438 56.470 70.554 1.00 0.00 H
ATOM 4101 HG3 GLU A 255 44.484 55.933 68.866 1.00 0.00 H
ATOM 4102 N ASP A 256 43.519 58.031 67.108 1.00 0.00 N
ATOM 4103 CA ASP A 256 42.095 58.286 67.037 1.00 0.00 C
ATOM 4104 C ASP A 256 41.369 56.947 66.704 1.00 0.00 C
ATOM 4105 O ASP A 256 41.705 56.257 65.721 1.00 0.00 O
ATOM 4106 CB ASP A 256 41.857 59.199 65.879 1.00 0.00 C
ATOM 4107 CG ASP A 256 42.126 60.623 66.254 1.00 0.00 C
ATOM 4108 OD1 ASP A 256 41.376 61.116 67.133 1.00 0.00 O
ATOM 4109 OD2 ASP A 256 42.857 61.303 65.564 1.00 0.00 O1-
ATOM 4110 H ASP A 256 43.928 57.534 66.330 1.00 0.00 H
ATOM 4111 HA ASP A 256 41.662 58.779 67.908 1.00 0.00 H
ATOM 4112 HB2 ASP A 256 42.419 58.968 64.973 1.00 0.00 H
ATOM 4113 HB3 ASP A 256 40.847 59.218 65.470 1.00 0.00 H
ATOM 4114 N ILE A 257 40.600 56.398 67.636 1.00 0.00 N
ATOM 4115 CA ILE A 257 40.212 54.955 67.791 1.00 0.00 C
ATOM 4116 C ILE A 257 39.321 54.553 66.569 1.00 0.00 C
ATOM 4117 O ILE A 257 39.331 53.416 66.131 1.00 0.00 O
ATOM 4118 CB ILE A 257 39.540 54.675 69.095 1.00 0.00 C
ATOM 4119 CG1 ILE A 257 40.453 55.041 70.231 1.00 0.00 C
ATOM 4120 CG2 ILE A 257 39.098 53.185 69.138 1.00 0.00 C
ATOM 4121 CD1 ILE A 257 41.795 54.341 70.481 1.00 0.00 C
ATOM 4122 H ILE A 257 40.477 56.931 68.485 1.00 0.00 H
ATOM 4123 HA ILE A 257 41.059 54.310 67.557 1.00 0.00 H
ATOM 4124 HB ILE A 257 38.593 55.216 69.101 1.00 0.00 H
ATOM 4125 HG12 ILE A 257 40.743 56.085 70.109 1.00 0.00 H
ATOM 4126 HG13 ILE A 257 39.969 55.051 71.207 1.00 0.00 H
ATOM 4127 HG21 ILE A 257 39.103 52.862 70.179 1.00 0.00 H
ATOM 4128 HG22 ILE A 257 38.065 53.117 68.798 1.00 0.00 H
ATOM 4129 HG23 ILE A 257 39.740 52.540 68.538 1.00 0.00 H
ATOM 4130 HD11 ILE A 257 42.120 54.542 71.501 1.00 0.00 H
ATOM 4131 HD12 ILE A 257 41.710 53.254 70.497 1.00 0.00 H
ATOM 4132 HD13 ILE A 257 42.535 54.610 69.728 1.00 0.00 H
ATOM 4133 N GLY A 258 38.614 55.509 65.958 1.00 0.00 N
ATOM 4134 CA GLY A 258 37.787 55.275 64.804 1.00 0.00 C
ATOM 4135 C GLY A 258 38.523 55.311 63.417 1.00 0.00 C
ATOM 4136 O GLY A 258 37.911 55.135 62.385 1.00 0.00 O
ATOM 4137 H GLY A 258 38.703 56.474 66.245 1.00 0.00 H
ATOM 4138 HA2 GLY A 258 37.413 54.252 64.834 1.00 0.00 H
ATOM 4139 HA3 GLY A 258 36.986 56.012 64.858 1.00 0.00 H
ATOM 4140 N MET A 259 39.888 55.399 63.423 1.00 0.00 N
ATOM 4141 CA MET A 259 40.668 55.345 62.187 1.00 0.00 C
ATOM 4142 C MET A 259 42.119 54.663 62.262 1.00 0.00 C
ATOM 4143 O MET A 259 43.036 55.457 62.045 1.00 0.00 O
ATOM 4144 CB MET A 259 40.738 56.820 61.553 1.00 0.00 C
ATOM 4145 CG MET A 259 41.275 57.898 62.532 1.00 0.00 C
ATOM 4146 SD MET A 259 40.674 59.493 62.088 1.00 0.00 S
ATOM 4147 CE MET A 259 38.979 59.521 62.692 1.00 0.00 C
ATOM 4148 H MET A 259 40.361 55.275 64.307 1.00 0.00 H
ATOM 4149 HA MET A 259 40.091 54.741 61.488 1.00 0.00 H
ATOM 4150 HB2 MET A 259 41.312 56.791 60.627 1.00 0.00 H
ATOM 4151 HB3 MET A 259 39.696 57.093 61.387 1.00 0.00 H
ATOM 4152 HG2 MET A 259 40.823 57.661 63.496 1.00 0.00 H
ATOM 4153 HG3 MET A 259 42.350 57.752 62.640 1.00 0.00 H
ATOM 4154 HE1 MET A 259 38.975 59.161 63.721 1.00 0.00 H
ATOM 4155 HE2 MET A 259 38.461 60.479 62.652 1.00 0.00 H
ATOM 4156 HE3 MET A 259 38.430 58.763 62.133 1.00 0.00 H
ATOM 4157 N PRO A 260 42.287 53.367 62.289 1.00 0.00 N
ATOM 4158 CA PRO A 260 43.601 52.793 62.303 1.00 0.00 C
ATOM 4159 C PRO A 260 44.285 52.967 60.929 1.00 0.00 C
ATOM 4160 O PRO A 260 45.549 52.824 60.817 1.00 0.00 O
ATOM 4161 CB PRO A 260 43.489 51.300 62.649 1.00 0.00 C
ATOM 4162 CG PRO A 260 42.087 50.962 62.384 1.00 0.00 C
ATOM 4163 CD PRO A 260 41.367 52.312 62.514 1.00 0.00 C
ATOM 4164 HA PRO A 260 44.305 53.211 63.022 1.00 0.00 H
ATOM 4165 HB2 PRO A 260 44.187 50.768 62.004 1.00 0.00 H
ATOM 4166 HB3 PRO A 260 43.727 51.181 63.706 1.00 0.00 H
ATOM 4167 HG2 PRO A 260 41.948 50.523 61.396 1.00 0.00 H
ATOM 4168 HG3 PRO A 260 41.701 50.246 63.110 1.00 0.00 H
ATOM 4169 HD2 PRO A 260 40.622 52.180 61.730 1.00 0.00 H
ATOM 4170 HD3 PRO A 260 40.992 52.358 63.537 1.00 0.00 H
ATOM 4171 N GLU A 261 43.570 53.310 59.853 1.00 0.00 N
ATOM 4172 CA GLU A 261 44.180 53.667 58.591 1.00 0.00 C
ATOM 4173 C GLU A 261 44.374 55.199 58.270 1.00 0.00 C
ATOM 4174 O GLU A 261 44.575 55.687 57.154 1.00 0.00 O
ATOM 4175 CB GLU A 261 43.361 53.012 57.348 1.00 0.00 C
ATOM 4176 CG GLU A 261 42.062 53.872 57.057 1.00 0.00 C
ATOM 4177 CD GLU A 261 41.070 54.075 58.157 1.00 0.00 C
ATOM 4178 OE1 GLU A 261 40.260 55.008 57.985 1.00 0.00 O
ATOM 4179 OE2 GLU A 261 40.981 53.283 59.096 1.00 0.00 O1-
ATOM 4180 H GLU A 261 42.564 53.346 59.774 1.00 0.00 H
ATOM 4181 HA GLU A 261 45.184 53.246 58.546 1.00 0.00 H
ATOM 4182 HB2 GLU A 261 44.008 52.927 56.475 1.00 0.00 H
ATOM 4183 HB3 GLU A 261 43.067 52.014 57.673 1.00 0.00 H
ATOM 4184 HG2 GLU A 261 42.336 54.777 56.515 1.00 0.00 H
ATOM 4185 HG3 GLU A 261 41.503 53.324 56.298 1.00 0.00 H
ATOM 4186 N LYS A 262 44.517 55.962 59.360 1.00 0.00 N
ATOM 4187 CA LYS A 262 44.741 57.423 59.403 1.00 0.00 C
ATOM 4188 C LYS A 262 45.824 57.889 58.423 1.00 0.00 C
ATOM 4189 O LYS A 262 45.615 58.998 57.974 1.00 0.00 O
ATOM 4190 CB LYS A 262 45.039 57.890 60.810 1.00 0.00 C
ATOM 4191 CG LYS A 262 45.056 59.460 60.942 1.00 0.00 C
ATOM 4192 CD LYS A 262 45.268 59.855 62.358 1.00 0.00 C
ATOM 4193 CE LYS A 262 45.312 61.357 62.688 1.00 0.00 C
ATOM 4194 NZ LYS A 262 45.321 61.528 64.169 1.00 0.00 N1+
ATOM 4195 H LYS A 262 44.281 55.545 60.249 1.00 0.00 H
ATOM 4196 HA LYS A 262 43.811 57.956 59.204 1.00 0.00 H
ATOM 4197 HB2 LYS A 262 44.190 57.539 61.397 1.00 0.00 H
ATOM 4198 HB3 LYS A 262 45.923 57.370 61.177 1.00 0.00 H
ATOM 4199 HG2 LYS A 262 45.963 59.817 60.453 1.00 0.00 H
ATOM 4200 HG3 LYS A 262 44.161 59.956 60.567 1.00 0.00 H
ATOM 4201 HD2 LYS A 262 44.542 59.333 62.982 1.00 0.00 H
ATOM 4202 HD3 LYS A 262 46.227 59.552 62.777 1.00 0.00 H
ATOM 4203 HE2 LYS A 262 46.265 61.779 62.369 1.00 0.00 H
ATOM 4204 HE3 LYS A 262 44.520 61.916 62.190 1.00 0.00 H
ATOM 4205 HZ1 LYS A 262 45.497 62.495 64.401 1.00 0.00 H
ATOM 4206 HZ2 LYS A 262 44.435 61.165 64.488 1.00 0.00 H
ATOM 4207 HZ3 LYS A 262 46.005 60.943 64.627 1.00 0.00 H
ATOM 4208 N TYR A 263 46.880 57.100 58.177 1.00 0.00 N
ATOM 4209 CA TYR A 263 47.973 57.483 57.345 1.00 0.00 C
ATOM 4210 C TYR A 263 48.241 56.571 56.135 1.00 0.00 C
ATOM 4211 O TYR A 263 49.308 56.657 55.544 1.00 0.00 O
ATOM 4212 CB TYR A 263 49.245 57.578 58.233 1.00 0.00 C
ATOM 4213 CG TYR A 263 49.089 58.491 59.460 1.00 0.00 C
ATOM 4214 CD1 TYR A 263 48.723 59.852 59.345 1.00 0.00 C
ATOM 4215 CD2 TYR A 263 49.167 57.871 60.784 1.00 0.00 C
ATOM 4216 CE1 TYR A 263 48.614 60.687 60.472 1.00 0.00 C
ATOM 4217 CE2 TYR A 263 48.851 58.720 61.886 1.00 0.00 C
ATOM 4218 CZ TYR A 263 48.718 60.116 61.722 1.00 0.00 C
ATOM 4219 OH TYR A 263 48.690 60.903 62.860 1.00 0.00 O
ATOM 4220 H TYR A 263 46.973 56.249 58.714 1.00 0.00 H
ATOM 4221 HA TYR A 263 47.665 58.456 56.961 1.00 0.00 H
ATOM 4222 HB2 TYR A 263 49.372 56.560 58.600 1.00 0.00 H
ATOM 4223 HB3 TYR A 263 50.170 57.825 57.712 1.00 0.00 H
ATOM 4224 HD1 TYR A 263 48.576 60.277 58.363 1.00 0.00 H
ATOM 4225 HD2 TYR A 263 49.378 56.822 60.927 1.00 0.00 H
ATOM 4226 HE1 TYR A 263 48.407 61.734 60.307 1.00 0.00 H
ATOM 4227 HE2 TYR A 263 48.910 58.367 62.905 1.00 0.00 H
ATOM 4228 HH TYR A 263 48.665 61.843 62.665 1.00 0.00 H
ATOM 4229 N MET A 264 47.283 55.731 55.701 1.00 0.00 N
ATOM 4230 CA MET A 264 47.503 54.717 54.656 1.00 0.00 C
ATOM 4231 C MET A 264 47.696 55.345 53.259 1.00 0.00 C
ATOM 4232 O MET A 264 48.307 54.776 52.333 1.00 0.00 O
ATOM 4233 CB MET A 264 46.342 53.623 54.697 1.00 0.00 C
ATOM 4234 CG MET A 264 46.153 52.677 53.470 1.00 0.00 C
ATOM 4235 SD MET A 264 47.588 51.723 53.211 1.00 0.00 S
ATOM 4236 CE MET A 264 47.760 50.792 54.801 1.00 0.00 C
ATOM 4237 H MET A 264 46.523 55.591 56.351 1.00 0.00 H
ATOM 4238 HA MET A 264 48.463 54.237 54.845 1.00 0.00 H
ATOM 4239 HB2 MET A 264 46.469 53.035 55.606 1.00 0.00 H
ATOM 4240 HB3 MET A 264 45.396 54.164 54.722 1.00 0.00 H
ATOM 4241 HG2 MET A 264 45.282 52.028 53.558 1.00 0.00 H
ATOM 4242 HG3 MET A 264 45.931 53.354 52.645 1.00 0.00 H
ATOM 4243 HE1 MET A 264 48.288 51.349 55.575 1.00 0.00 H
ATOM 4244 HE2 MET A 264 46.728 50.594 55.089 1.00 0.00 H
ATOM 4245 HE3 MET A 264 48.327 49.874 54.643 1.00 0.00 H
ATOM 4246 N ASN A 265 46.969 56.452 52.966 1.00 0.00 N
ATOM 4247 CA ASN A 265 46.945 57.128 51.706 1.00 0.00 C
ATOM 4248 C ASN A 265 47.847 58.409 51.609 1.00 0.00 C
ATOM 4249 O ASN A 265 47.762 59.195 50.658 1.00 0.00 O
ATOM 4250 CB ASN A 265 45.536 57.264 51.206 1.00 0.00 C
ATOM 4251 CG ASN A 265 44.769 55.952 51.143 1.00 0.00 C
ATOM 4252 ND2 ASN A 265 44.095 55.621 52.225 1.00 0.00 N
ATOM 4253 OD1 ASN A 265 44.702 55.264 50.160 1.00 0.00 O
ATOM 4254 H ASN A 265 46.464 56.939 53.693 1.00 0.00 H
ATOM 4255 HA ASN A 265 47.496 56.496 51.009 1.00 0.00 H
ATOM 4256 HB2 ASN A 265 44.963 57.958 51.820 1.00 0.00 H
ATOM 4257 HB3 ASN A 265 45.457 57.727 50.222 1.00 0.00 H
ATOM 4258 HD21 ASN A 265 43.724 54.682 52.239 1.00 0.00 H
ATOM 4259 HD22 ASN A 265 44.285 56.116 53.084 1.00 0.00 H
ATOM 4260 N LEU A 266 48.762 58.625 52.598 1.00 0.00 N
ATOM 4261 CA LEU A 266 49.839 59.624 52.430 1.00 0.00 C
ATOM 4262 C LEU A 266 50.776 59.321 51.252 1.00 0.00 C
ATOM 4263 O LEU A 266 50.912 58.161 50.917 1.00 0.00 O
ATOM 4264 CB LEU A 266 50.564 59.393 53.794 1.00 0.00 C
ATOM 4265 CG LEU A 266 51.662 60.370 54.205 1.00 0.00 C
ATOM 4266 CD1 LEU A 266 51.163 61.806 54.068 1.00 0.00 C
ATOM 4267 CD2 LEU A 266 52.097 59.865 55.602 1.00 0.00 C
ATOM 4268 H LEU A 266 48.867 57.973 53.362 1.00 0.00 H
ATOM 4269 HA LEU A 266 49.399 60.621 52.395 1.00 0.00 H
ATOM 4270 HB2 LEU A 266 49.817 59.338 54.586 1.00 0.00 H
ATOM 4271 HB3 LEU A 266 50.952 58.376 53.732 1.00 0.00 H
ATOM 4272 HG LEU A 266 52.493 60.276 53.506 1.00 0.00 H
ATOM 4273 HD11 LEU A 266 50.158 61.880 54.485 1.00 0.00 H
ATOM 4274 HD12 LEU A 266 51.681 62.479 54.752 1.00 0.00 H
ATOM 4275 HD13 LEU A 266 51.243 62.172 53.045 1.00 0.00 H
ATOM 4276 HD21 LEU A 266 52.508 58.856 55.569 1.00 0.00 H
ATOM 4277 HD22 LEU A 266 52.880 60.586 55.836 1.00 0.00 H
ATOM 4278 HD23 LEU A 266 51.314 59.941 56.357 1.00 0.00 H
ATOM 4279 N VAL A 267 51.361 60.389 50.663 1.00 0.00 N
ATOM 4280 CA VAL A 267 52.287 60.327 49.557 1.00 0.00 C
ATOM 4281 C VAL A 267 53.452 61.276 49.730 1.00 0.00 C
ATOM 4282 O VAL A 267 53.396 62.484 49.737 1.00 0.00 O
ATOM 4283 CB VAL A 267 51.631 60.316 48.213 1.00 0.00 C
ATOM 4284 CG1 VAL A 267 50.676 59.110 48.022 1.00 0.00 C
ATOM 4285 CG2 VAL A 267 50.895 61.647 47.939 1.00 0.00 C
ATOM 4286 H VAL A 267 50.961 61.296 50.855 1.00 0.00 H
ATOM 4287 HA VAL A 267 52.847 59.404 49.712 1.00 0.00 H
ATOM 4288 HB VAL A 267 52.297 60.147 47.366 1.00 0.00 H
ATOM 4289 HG11 VAL A 267 51.118 58.175 48.367 1.00 0.00 H
ATOM 4290 HG12 VAL A 267 49.813 59.247 48.674 1.00 0.00 H
ATOM 4291 HG13 VAL A 267 50.272 59.084 47.010 1.00 0.00 H
ATOM 4292 HG21 VAL A 267 51.534 62.530 47.917 1.00 0.00 H
ATOM 4293 HG22 VAL A 267 50.541 61.445 46.928 1.00 0.00 H
ATOM 4294 HG23 VAL A 267 50.050 61.764 48.617 1.00 0.00 H
ATOM 4295 N PHE A 268 54.632 60.701 49.976 1.00 0.00 N
ATOM 4296 CA PHE A 268 55.890 61.403 50.007 1.00 0.00 C
ATOM 4297 C PHE A 268 56.468 61.384 48.570 1.00 0.00 C
ATOM 4298 O PHE A 268 56.223 60.454 47.790 1.00 0.00 O
ATOM 4299 CB PHE A 268 56.868 60.723 50.964 1.00 0.00 C
ATOM 4300 CG PHE A 268 56.392 60.512 52.434 1.00 0.00 C
ATOM 4301 CD1 PHE A 268 55.975 61.610 53.207 1.00 0.00 C
ATOM 4302 CD2 PHE A 268 56.267 59.201 52.899 1.00 0.00 C
ATOM 4303 CE1 PHE A 268 55.617 61.392 54.525 1.00 0.00 C
ATOM 4304 CE2 PHE A 268 55.813 58.932 54.198 1.00 0.00 C
ATOM 4305 CZ PHE A 268 55.627 60.089 55.018 1.00 0.00 C
ATOM 4306 H PHE A 268 54.664 59.700 49.842 1.00 0.00 H
ATOM 4307 HA PHE A 268 55.673 62.422 50.326 1.00 0.00 H
ATOM 4308 HB2 PHE A 268 56.896 59.688 50.623 1.00 0.00 H
ATOM 4309 HB3 PHE A 268 57.851 61.193 50.977 1.00 0.00 H
ATOM 4310 HD1 PHE A 268 56.004 62.610 52.801 1.00 0.00 H
ATOM 4311 HD2 PHE A 268 56.518 58.415 52.201 1.00 0.00 H
ATOM 4312 HE1 PHE A 268 55.408 62.286 55.094 1.00 0.00 H
ATOM 4313 HE2 PHE A 268 55.769 57.889 54.476 1.00 0.00 H
ATOM 4314 HZ PHE A 268 55.241 60.000 56.023 1.00 0.00 H
ATOM 4315 N PRO A 269 57.360 62.403 48.222 1.00 0.00 N
ATOM 4316 CA PRO A 269 58.040 62.474 46.940 1.00 0.00 C
ATOM 4317 C PRO A 269 59.178 61.391 46.838 1.00 0.00 C
ATOM 4318 O PRO A 269 59.807 61.119 47.846 1.00 0.00 O
ATOM 4319 CB PRO A 269 58.540 63.830 46.744 1.00 0.00 C
ATOM 4320 CG PRO A 269 58.467 64.520 48.113 1.00 0.00 C
ATOM 4321 CD PRO A 269 57.502 63.657 48.931 1.00 0.00 C
ATOM 4322 HA PRO A 269 57.271 62.265 46.196 1.00 0.00 H
ATOM 4323 HB2 PRO A 269 59.503 63.879 46.235 1.00 0.00 H
ATOM 4324 HB3 PRO A 269 57.808 64.299 46.087 1.00 0.00 H
ATOM 4325 HG2 PRO A 269 59.441 64.640 48.586 1.00 0.00 H
ATOM 4326 HG3 PRO A 269 57.983 65.483 47.952 1.00 0.00 H
ATOM 4327 HD2 PRO A 269 58.021 63.383 49.849 1.00 0.00 H
ATOM 4328 HD3 PRO A 269 56.585 64.213 49.127 1.00 0.00 H
ATOM 4329 N ARG A 270 59.298 60.817 45.622 1.00 0.00 N
ATOM 4330 CA ARG A 270 60.429 59.891 45.338 1.00 0.00 C
ATOM 4331 C ARG A 270 61.908 60.434 45.609 1.00 0.00 C
ATOM 4332 O ARG A 270 62.702 59.635 46.153 1.00 0.00 O
ATOM 4333 CB ARG A 270 60.222 59.425 43.875 1.00 0.00 C
ATOM 4334 CG ARG A 270 58.986 58.560 43.792 1.00 0.00 C
ATOM 4335 CD ARG A 270 58.831 57.992 42.375 1.00 0.00 C
ATOM 4336 NE ARG A 270 58.378 59.048 41.414 1.00 0.00 N
ATOM 4337 CZ ARG A 270 57.681 58.932 40.257 1.00 0.00 C
ATOM 4338 NH1 ARG A 270 57.235 57.743 39.852 1.00 0.00 N1+
ATOM 4339 NH2 ARG A 270 57.588 60.010 39.492 1.00 0.00 N
ATOM 4340 H ARG A 270 58.646 61.058 44.888 1.00 0.00 H
ATOM 4341 HA ARG A 270 60.382 59.021 45.994 1.00 0.00 H
ATOM 4342 HB2 ARG A 270 60.244 60.267 43.184 1.00 0.00 H
ATOM 4343 HB3 ARG A 270 60.992 58.709 43.588 1.00 0.00 H
ATOM 4344 HG2 ARG A 270 59.013 57.680 44.435 1.00 0.00 H
ATOM 4345 HG3 ARG A 270 58.055 59.051 44.077 1.00 0.00 H
ATOM 4346 HD2 ARG A 270 59.739 57.595 41.921 1.00 0.00 H
ATOM 4347 HD3 ARG A 270 58.070 57.215 42.444 1.00 0.00 H
ATOM 4348 HE ARG A 270 58.612 59.978 41.732 1.00 0.00 H
ATOM 4349 HH11 ARG A 270 57.338 56.949 40.467 1.00 0.00 H
ATOM 4350 HH12 ARG A 270 56.856 57.663 38.919 1.00 0.00 H
ATOM 4351 HH21 ARG A 270 58.081 60.847 39.767 1.00 0.00 H
ATOM 4352 HH22 ARG A 270 57.016 60.045 38.660 1.00 0.00 H
ATOM 4353 N LYS A 271 62.034 61.787 45.581 1.00 0.00 N
ATOM 4354 CA LYS A 271 63.121 62.606 46.082 1.00 0.00 C
ATOM 4355 C LYS A 271 63.497 62.380 47.602 1.00 0.00 C
ATOM 4356 O LYS A 271 64.687 62.422 47.946 1.00 0.00 O
ATOM 4357 CB LYS A 271 62.835 64.187 45.852 1.00 0.00 C
ATOM 4358 CG LYS A 271 63.997 65.122 46.253 1.00 0.00 C
ATOM 4359 CD LYS A 271 65.134 64.803 45.314 1.00 0.00 C
ATOM 4360 CE LYS A 271 65.970 66.090 45.059 1.00 0.00 C
ATOM 4361 NZ LYS A 271 67.165 65.853 44.207 1.00 0.00 N1+
ATOM 4362 H LYS A 271 61.196 62.251 45.261 1.00 0.00 H
ATOM 4363 HA LYS A 271 63.966 62.321 45.456 1.00 0.00 H
ATOM 4364 HB2 LYS A 271 62.555 64.221 44.799 1.00 0.00 H
ATOM 4365 HB3 LYS A 271 62.042 64.525 46.519 1.00 0.00 H
ATOM 4366 HG2 LYS A 271 63.721 66.153 46.033 1.00 0.00 H
ATOM 4367 HG3 LYS A 271 64.323 65.004 47.287 1.00 0.00 H
ATOM 4368 HD2 LYS A 271 65.828 64.013 45.603 1.00 0.00 H
ATOM 4369 HD3 LYS A 271 64.852 64.634 44.274 1.00 0.00 H
ATOM 4370 HE2 LYS A 271 65.440 66.879 44.526 1.00 0.00 H
ATOM 4371 HE3 LYS A 271 66.401 66.444 45.995 1.00 0.00 H
ATOM 4372 HZ1 LYS A 271 67.425 66.745 43.810 1.00 0.00 H
ATOM 4373 HZ2 LYS A 271 68.039 65.580 44.631 1.00 0.00 H
ATOM 4374 HZ3 LYS A 271 67.017 65.206 43.445 1.00 0.00 H
ATOM 4375 N LEU A 272 62.543 61.978 48.480 1.00 0.00 N
ATOM 4376 CA LEU A 272 62.787 62.046 49.950 1.00 0.00 C
ATOM 4377 C LEU A 272 63.677 60.844 50.363 1.00 0.00 C
ATOM 4378 O LEU A 272 63.332 59.719 50.024 1.00 0.00 O
ATOM 4379 CB LEU A 272 61.424 62.060 50.630 1.00 0.00 C
ATOM 4380 CG LEU A 272 61.634 62.584 52.067 1.00 0.00 C
ATOM 4381 CD1 LEU A 272 61.429 64.077 52.208 1.00 0.00 C
ATOM 4382 CD2 LEU A 272 60.625 61.802 52.958 1.00 0.00 C
ATOM 4383 H LEU A 272 61.616 62.054 48.088 1.00 0.00 H
ATOM 4384 HA LEU A 272 63.381 62.932 50.173 1.00 0.00 H
ATOM 4385 HB2 LEU A 272 60.674 62.638 50.091 1.00 0.00 H
ATOM 4386 HB3 LEU A 272 60.995 61.059 50.571 1.00 0.00 H
ATOM 4387 HG LEU A 272 62.618 62.352 52.474 1.00 0.00 H
ATOM 4388 HD11 LEU A 272 60.369 64.261 52.032 1.00 0.00 H
ATOM 4389 HD12 LEU A 272 61.584 64.379 53.244 1.00 0.00 H
ATOM 4390 HD13 LEU A 272 62.077 64.685 51.577 1.00 0.00 H
ATOM 4391 HD21 LEU A 272 59.618 61.974 52.578 1.00 0.00 H
ATOM 4392 HD22 LEU A 272 60.837 60.737 53.060 1.00 0.00 H
ATOM 4393 HD23 LEU A 272 60.597 62.245 53.954 1.00 0.00 H
ATOM 4394 N CYS A 273 64.813 61.147 50.962 1.00 0.00 N
ATOM 4395 CA CYS A 273 65.884 60.179 51.283 1.00 0.00 C
ATOM 4396 C CYS A 273 66.409 60.495 52.712 1.00 0.00 C
ATOM 4397 O CYS A 273 67.079 59.671 53.299 1.00 0.00 O
ATOM 4398 CB CYS A 273 67.015 60.190 50.236 1.00 0.00 C
ATOM 4399 SG CYS A 273 67.886 61.732 50.191 1.00 0.00 S
ATOM 4400 H CYS A 273 64.953 62.114 51.220 1.00 0.00 H
ATOM 4401 HA CYS A 273 65.498 59.159 51.298 1.00 0.00 H
ATOM 4402 HB2 CYS A 273 67.691 59.353 50.410 1.00 0.00 H
ATOM 4403 HB3 CYS A 273 66.751 59.999 49.196 1.00 0.00 H
ATOM 4404 HG CYS A 273 66.853 62.286 49.550 1.00 0.00 H
ATOM 4405 N ARG A 274 66.139 61.605 53.427 1.00 0.00 N
ATOM 4406 CA ARG A 274 66.507 61.863 54.782 1.00 0.00 C
ATOM 4407 C ARG A 274 65.309 62.125 55.738 1.00 0.00 C
ATOM 4408 O ARG A 274 64.472 62.907 55.314 1.00 0.00 O
ATOM 4409 CB ARG A 274 67.517 62.992 55.045 1.00 0.00 C
ATOM 4410 CG ARG A 274 68.843 62.617 54.311 1.00 0.00 C
ATOM 4411 CD ARG A 274 70.073 63.425 54.766 1.00 0.00 C
ATOM 4412 NE ARG A 274 69.709 64.888 54.608 1.00 0.00 N
ATOM 4413 CZ ARG A 274 69.735 65.525 53.466 1.00 0.00 C
ATOM 4414 NH1 ARG A 274 70.326 65.163 52.353 1.00 0.00 N1+
ATOM 4415 NH2 ARG A 274 69.350 66.784 53.388 1.00 0.00 N
ATOM 4416 H ARG A 274 65.502 62.277 53.023 1.00 0.00 H
ATOM 4417 HA ARG A 274 66.934 60.939 55.171 1.00 0.00 H
ATOM 4418 HB2 ARG A 274 67.205 64.009 54.810 1.00 0.00 H
ATOM 4419 HB3 ARG A 274 67.876 62.868 56.067 1.00 0.00 H
ATOM 4420 HG2 ARG A 274 68.995 61.551 54.477 1.00 0.00 H
ATOM 4421 HG3 ARG A 274 68.722 62.746 53.236 1.00 0.00 H
ATOM 4422 HD2 ARG A 274 70.226 63.227 55.827 1.00 0.00 H
ATOM 4423 HD3 ARG A 274 70.914 63.111 54.148 1.00 0.00 H
ATOM 4424 HE ARG A 274 69.429 65.364 55.454 1.00 0.00 H
ATOM 4425 HH11 ARG A 274 70.799 64.271 52.310 1.00 0.00 H
ATOM 4426 HH12 ARG A 274 70.280 65.691 51.493 1.00 0.00 H
ATOM 4427 HH21 ARG A 274 68.848 67.174 54.173 1.00 0.00 H
ATOM 4428 HH22 ARG A 274 69.346 67.145 52.445 1.00 0.00 H
ATOM 4429 N LEU A 275 65.268 61.488 56.920 1.00 0.00 N
ATOM 4430 CA LEU A 275 64.021 61.325 57.711 1.00 0.00 C
ATOM 4431 C LEU A 275 64.211 61.430 59.169 1.00 0.00 C
ATOM 4432 O LEU A 275 65.248 61.172 59.744 1.00 0.00 O
ATOM 4433 CB LEU A 275 63.278 60.020 57.327 1.00 0.00 C
ATOM 4434 CG LEU A 275 62.030 60.106 56.456 1.00 0.00 C
ATOM 4435 CD1 LEU A 275 61.390 58.768 56.241 1.00 0.00 C
ATOM 4436 CD2 LEU A 275 61.010 61.049 57.094 1.00 0.00 C
ATOM 4437 H LEU A 275 66.046 60.854 57.029 1.00 0.00 H
ATOM 4438 HA LEU A 275 63.462 62.221 57.443 1.00 0.00 H
ATOM 4439 HB2 LEU A 275 63.996 59.379 56.816 1.00 0.00 H
ATOM 4440 HB3 LEU A 275 62.951 59.577 58.268 1.00 0.00 H
ATOM 4441 HG LEU A 275 62.213 60.457 55.440 1.00 0.00 H
ATOM 4442 HD11 LEU A 275 61.019 58.422 57.206 1.00 0.00 H
ATOM 4443 HD12 LEU A 275 60.464 58.775 55.667 1.00 0.00 H
ATOM 4444 HD13 LEU A 275 61.914 57.893 55.858 1.00 0.00 H
ATOM 4445 HD21 LEU A 275 61.022 60.945 58.179 1.00 0.00 H
ATOM 4446 HD22 LEU A 275 61.126 62.079 56.757 1.00 0.00 H
ATOM 4447 HD23 LEU A 275 60.016 60.772 56.743 1.00 0.00 H
ATOM 4448 N GLY A 276 63.066 61.824 59.834 1.00 0.00 N
ATOM 4449 CA GLY A 276 63.082 61.896 61.290 1.00 0.00 C
ATOM 4450 C GLY A 276 61.698 62.025 61.935 1.00 0.00 C
ATOM 4451 O GLY A 276 61.412 63.037 62.600 1.00 0.00 O
ATOM 4452 H GLY A 276 62.235 62.067 59.313 1.00 0.00 H
ATOM 4453 HA2 GLY A 276 63.517 60.943 61.591 1.00 0.00 H
ATOM 4454 HA3 GLY A 276 63.657 62.719 61.714 1.00 0.00 H
ATOM 4455 N LEU A 277 60.637 61.186 61.651 1.00 0.00 N
ATOM 4456 CA LEU A 277 59.313 61.263 62.268 1.00 0.00 C
ATOM 4457 C LEU A 277 59.358 61.000 63.796 1.00 0.00 C
ATOM 4458 O LEU A 277 59.624 59.849 64.191 1.00 0.00 O
ATOM 4459 CB LEU A 277 58.403 60.314 61.488 1.00 0.00 C
ATOM 4460 CG LEU A 277 58.054 60.693 60.023 1.00 0.00 C
ATOM 4461 CD1 LEU A 277 57.268 59.607 59.293 1.00 0.00 C
ATOM 4462 CD2 LEU A 277 57.243 62.008 60.015 1.00 0.00 C
ATOM 4463 H LEU A 277 60.796 60.441 60.987 1.00 0.00 H
ATOM 4464 HA LEU A 277 58.896 62.264 62.161 1.00 0.00 H
ATOM 4465 HB2 LEU A 277 58.711 59.269 61.460 1.00 0.00 H
ATOM 4466 HB3 LEU A 277 57.445 60.218 61.997 1.00 0.00 H
ATOM 4467 HG LEU A 277 58.988 60.814 59.474 1.00 0.00 H
ATOM 4468 HD11 LEU A 277 57.832 58.691 59.469 1.00 0.00 H
ATOM 4469 HD12 LEU A 277 56.283 59.568 59.758 1.00 0.00 H
ATOM 4470 HD13 LEU A 277 57.038 59.782 58.242 1.00 0.00 H
ATOM 4471 HD21 LEU A 277 56.634 62.067 60.916 1.00 0.00 H
ATOM 4472 HD22 LEU A 277 57.967 62.793 60.232 1.00 0.00 H
ATOM 4473 HD23 LEU A 277 56.791 62.235 59.049 1.00 0.00 H
ATOM 4474 N SER A 278 59.044 62.060 64.593 1.00 0.00 N
ATOM 4475 CA SER A 278 58.653 61.881 66.056 1.00 0.00 C
ATOM 4476 C SER A 278 57.347 61.204 66.314 1.00 0.00 C
ATOM 4477 O SER A 278 56.402 61.298 65.541 1.00 0.00 O
ATOM 4478 CB SER A 278 58.580 63.205 66.742 1.00 0.00 C
ATOM 4479 OG SER A 278 59.686 63.942 66.691 1.00 0.00 O
ATOM 4480 H SER A 278 58.693 62.888 64.134 1.00 0.00 H
ATOM 4481 HA SER A 278 59.473 61.265 66.424 1.00 0.00 H
ATOM 4482 HB2 SER A 278 57.771 63.849 66.399 1.00 0.00 H
ATOM 4483 HB3 SER A 278 58.292 62.974 67.767 1.00 0.00 H
ATOM 4484 HG SER A 278 59.474 64.876 66.625 1.00 0.00 H
ATOM 4485 N TYR A 279 57.168 60.477 67.375 1.00 0.00 N
ATOM 4486 CA TYR A 279 56.031 59.657 67.771 1.00 0.00 C
ATOM 4487 C TYR A 279 55.514 58.590 66.811 1.00 0.00 C
ATOM 4488 O TYR A 279 54.473 58.002 66.976 1.00 0.00 O
ATOM 4489 CB TYR A 279 54.928 60.558 68.316 1.00 0.00 C
ATOM 4490 CG TYR A 279 55.409 61.498 69.386 1.00 0.00 C
ATOM 4491 CD1 TYR A 279 55.627 61.087 70.749 1.00 0.00 C
ATOM 4492 CD2 TYR A 279 55.727 62.832 69.016 1.00 0.00 C
ATOM 4493 CE1 TYR A 279 56.033 62.027 71.713 1.00 0.00 C
ATOM 4494 CE2 TYR A 279 56.185 63.782 69.943 1.00 0.00 C
ATOM 4495 CZ TYR A 279 56.291 63.381 71.322 1.00 0.00 C
ATOM 4496 OH TYR A 279 56.680 64.216 72.289 1.00 0.00 O
ATOM 4497 H TYR A 279 57.940 60.336 68.011 1.00 0.00 H
ATOM 4498 HA TYR A 279 56.376 59.140 68.667 1.00 0.00 H
ATOM 4499 HB2 TYR A 279 54.457 61.085 67.486 1.00 0.00 H
ATOM 4500 HB3 TYR A 279 54.186 59.890 68.753 1.00 0.00 H
ATOM 4501 HD1 TYR A 279 55.345 60.091 71.058 1.00 0.00 H
ATOM 4502 HD2 TYR A 279 55.631 63.090 67.971 1.00 0.00 H
ATOM 4503 HE1 TYR A 279 56.068 61.721 72.748 1.00 0.00 H
ATOM 4504 HE2 TYR A 279 56.378 64.787 69.596 1.00 0.00 H
ATOM 4505 HH TYR A 279 56.947 65.073 71.949 1.00 0.00 H
ATOM 4506 N MET A 280 56.323 58.374 65.731 1.00 0.00 N
ATOM 4507 CA MET A 280 56.066 57.237 64.844 1.00 0.00 C
ATOM 4508 C MET A 280 56.311 55.919 65.610 1.00 0.00 C
ATOM 4509 O MET A 280 57.347 55.860 66.234 1.00 0.00 O
ATOM 4510 CB MET A 280 56.929 57.323 63.556 1.00 0.00 C
ATOM 4511 CG MET A 280 56.734 56.120 62.621 1.00 0.00 C
ATOM 4512 SD MET A 280 58.232 55.424 61.764 1.00 0.00 S
ATOM 4513 CE MET A 280 59.434 55.123 63.054 1.00 0.00 C
ATOM 4514 H MET A 280 57.171 58.904 65.588 1.00 0.00 H
ATOM 4515 HA MET A 280 55.031 57.169 64.511 1.00 0.00 H
ATOM 4516 HB2 MET A 280 56.747 58.266 63.040 1.00 0.00 H
ATOM 4517 HB3 MET A 280 57.978 57.453 63.820 1.00 0.00 H
ATOM 4518 HG2 MET A 280 56.261 55.333 63.207 1.00 0.00 H
ATOM 4519 HG3 MET A 280 56.095 56.465 61.808 1.00 0.00 H
ATOM 4520 HE1 MET A 280 59.837 56.119 63.236 1.00 0.00 H
ATOM 4521 HE2 MET A 280 58.949 54.670 63.919 1.00 0.00 H
ATOM 4522 HE3 MET A 280 60.334 54.547 62.840 1.00 0.00 H
ATOM 4523 N GLY A 281 55.278 55.129 65.833 1.00 0.00 N
ATOM 4524 CA GLY A 281 55.306 53.838 66.465 1.00 0.00 C
ATOM 4525 C GLY A 281 55.166 52.642 65.572 1.00 0.00 C
ATOM 4526 O GLY A 281 55.355 52.728 64.357 1.00 0.00 O
ATOM 4527 H GLY A 281 54.367 55.358 65.462 1.00 0.00 H
ATOM 4528 HA2 GLY A 281 56.229 53.698 67.028 1.00 0.00 H
ATOM 4529 HA3 GLY A 281 54.477 53.842 67.173 1.00 0.00 H
ATOM 4530 N PRO A 282 54.880 51.485 66.252 1.00 0.00 N
ATOM 4531 CA PRO A 282 55.039 50.152 65.666 1.00 0.00 C
ATOM 4532 C PRO A 282 54.009 50.006 64.543 1.00 0.00 C
ATOM 4533 O PRO A 282 54.444 49.457 63.562 1.00 0.00 O
ATOM 4534 CB PRO A 282 54.771 49.128 66.801 1.00 0.00 C
ATOM 4535 CG PRO A 282 55.314 49.931 67.998 1.00 0.00 C
ATOM 4536 CD PRO A 282 54.743 51.318 67.720 1.00 0.00 C
ATOM 4537 HA PRO A 282 56.034 49.932 65.280 1.00 0.00 H
ATOM 4538 HB2 PRO A 282 53.707 48.893 66.829 1.00 0.00 H
ATOM 4539 HB3 PRO A 282 55.344 48.224 66.593 1.00 0.00 H
ATOM 4540 HG2 PRO A 282 55.000 49.448 68.924 1.00 0.00 H
ATOM 4541 HG3 PRO A 282 56.399 49.995 68.080 1.00 0.00 H
ATOM 4542 HD2 PRO A 282 53.672 51.292 67.917 1.00 0.00 H
ATOM 4543 HD3 PRO A 282 55.263 51.989 68.404 1.00 0.00 H
ATOM 4544 N ASN A 283 52.790 50.606 64.644 1.00 0.00 N
ATOM 4545 CA ASN A 283 51.725 50.531 63.598 1.00 0.00 C
ATOM 4546 C ASN A 283 51.852 51.593 62.520 1.00 0.00 C
ATOM 4547 O ASN A 283 51.524 51.329 61.353 1.00 0.00 O
ATOM 4548 CB ASN A 283 50.415 50.459 64.252 1.00 0.00 C
ATOM 4549 CG ASN A 283 50.314 49.740 65.595 1.00 0.00 C
ATOM 4550 ND2 ASN A 283 50.289 50.453 66.635 1.00 0.00 N
ATOM 4551 OD1 ASN A 283 50.287 48.471 65.722 1.00 0.00 O
ATOM 4552 H ASN A 283 52.507 50.808 65.592 1.00 0.00 H
ATOM 4553 HA ASN A 283 51.851 49.569 63.103 1.00 0.00 H
ATOM 4554 HB2 ASN A 283 50.170 51.501 64.460 1.00 0.00 H
ATOM 4555 HB3 ASN A 283 49.678 50.082 63.544 1.00 0.00 H
ATOM 4556 HD21 ASN A 283 50.308 49.923 67.495 1.00 0.00 H
ATOM 4557 HD22 ASN A 283 50.349 51.460 66.605 1.00 0.00 H
ATOM 4558 N GLU A 284 52.467 52.707 62.787 1.00 0.00 N
ATOM 4559 CA GLU A 284 52.762 53.771 61.800 1.00 0.00 C
ATOM 4560 C GLU A 284 54.040 53.535 60.945 1.00 0.00 C
ATOM 4561 O GLU A 284 53.928 53.674 59.761 1.00 0.00 O
ATOM 4562 CB GLU A 284 52.876 55.192 62.531 1.00 0.00 C
ATOM 4563 CG GLU A 284 51.539 55.519 63.204 1.00 0.00 C
ATOM 4564 CD GLU A 284 51.451 54.857 64.582 1.00 0.00 C
ATOM 4565 OE1 GLU A 284 50.382 54.235 64.834 1.00 0.00 O
ATOM 4566 OE2 GLU A 284 52.366 54.951 65.420 1.00 0.00 O1-
ATOM 4567 H GLU A 284 52.660 52.940 63.751 1.00 0.00 H
ATOM 4568 HA GLU A 284 51.963 53.821 61.060 1.00 0.00 H
ATOM 4569 HB2 GLU A 284 53.652 55.025 63.278 1.00 0.00 H
ATOM 4570 HB3 GLU A 284 53.273 55.885 61.788 1.00 0.00 H
ATOM 4571 HG2 GLU A 284 51.541 56.609 63.220 1.00 0.00 H
ATOM 4572 HG3 GLU A 284 50.769 55.241 62.485 1.00 0.00 H
ATOM 4573 N MET A 285 55.150 53.039 61.482 1.00 0.00 N
ATOM 4574 CA MET A 285 56.449 52.746 60.801 1.00 0.00 C
ATOM 4575 C MET A 285 56.353 52.095 59.443 1.00 0.00 C
ATOM 4576 O MET A 285 57.162 52.379 58.564 1.00 0.00 O
ATOM 4577 CB MET A 285 57.340 51.919 61.780 1.00 0.00 C
ATOM 4578 CG MET A 285 58.365 50.934 61.165 1.00 0.00 C
ATOM 4579 SD MET A 285 59.200 49.840 62.346 1.00 0.00 S
ATOM 4580 CE MET A 285 57.785 49.046 63.087 1.00 0.00 C
ATOM 4581 H MET A 285 55.168 52.792 62.461 1.00 0.00 H
ATOM 4582 HA MET A 285 56.887 53.705 60.526 1.00 0.00 H
ATOM 4583 HB2 MET A 285 57.877 52.598 62.443 1.00 0.00 H
ATOM 4584 HB3 MET A 285 56.581 51.419 62.382 1.00 0.00 H
ATOM 4585 HG2 MET A 285 57.888 50.245 60.468 1.00 0.00 H
ATOM 4586 HG3 MET A 285 59.073 51.550 60.609 1.00 0.00 H
ATOM 4587 HE1 MET A 285 57.057 48.625 62.393 1.00 0.00 H
ATOM 4588 HE2 MET A 285 58.076 48.270 63.794 1.00 0.00 H
ATOM 4589 HE3 MET A 285 57.275 49.833 63.644 1.00 0.00 H
ATOM 4590 N PRO A 286 55.374 51.226 59.143 1.00 0.00 N
ATOM 4591 CA PRO A 286 55.363 50.481 57.881 1.00 0.00 C
ATOM 4592 C PRO A 286 55.107 51.278 56.592 1.00 0.00 C
ATOM 4593 O PRO A 286 55.103 50.849 55.395 1.00 0.00 O
ATOM 4594 CB PRO A 286 54.329 49.375 57.944 1.00 0.00 C
ATOM 4595 CG PRO A 286 54.309 49.055 59.461 1.00 0.00 C
ATOM 4596 CD PRO A 286 54.594 50.420 60.048 1.00 0.00 C
ATOM 4597 HA PRO A 286 56.334 50.012 57.723 1.00 0.00 H
ATOM 4598 HB2 PRO A 286 53.352 49.776 57.676 1.00 0.00 H
ATOM 4599 HB3 PRO A 286 54.763 48.510 57.444 1.00 0.00 H
ATOM 4600 HG2 PRO A 286 53.326 48.726 59.798 1.00 0.00 H
ATOM 4601 HG3 PRO A 286 55.100 48.389 59.804 1.00 0.00 H
ATOM 4602 HD2 PRO A 286 53.654 50.919 60.282 1.00 0.00 H
ATOM 4603 HD3 PRO A 286 55.149 50.362 60.984 1.00 0.00 H
ATOM 4604 N ILE A 287 54.759 52.588 56.780 1.00 0.00 N
ATOM 4605 CA ILE A 287 54.682 53.585 55.642 1.00 0.00 C
ATOM 4606 C ILE A 287 56.039 53.762 54.982 1.00 0.00 C
ATOM 4607 O ILE A 287 56.147 54.242 53.846 1.00 0.00 O
ATOM 4608 CB ILE A 287 54.048 54.971 55.996 1.00 0.00 C
ATOM 4609 CG1 ILE A 287 54.984 55.677 56.961 1.00 0.00 C
ATOM 4610 CG2 ILE A 287 52.646 54.717 56.423 1.00 0.00 C
ATOM 4611 CD1 ILE A 287 54.346 56.986 57.575 1.00 0.00 C
ATOM 4612 H ILE A 287 54.592 52.951 57.708 1.00 0.00 H
ATOM 4613 HA ILE A 287 53.974 53.101 54.969 1.00 0.00 H
ATOM 4614 HB ILE A 287 53.970 55.554 55.078 1.00 0.00 H
ATOM 4615 HG12 ILE A 287 55.204 54.969 57.760 1.00 0.00 H
ATOM 4616 HG13 ILE A 287 55.810 56.055 56.357 1.00 0.00 H
ATOM 4617 HG21 ILE A 287 52.251 53.848 55.897 1.00 0.00 H
ATOM 4618 HG22 ILE A 287 52.550 54.500 57.487 1.00 0.00 H
ATOM 4619 HG23 ILE A 287 52.032 55.564 56.114 1.00 0.00 H
ATOM 4620 HD11 ILE A 287 54.248 57.723 56.778 1.00 0.00 H
ATOM 4621 HD12 ILE A 287 53.408 56.803 58.099 1.00 0.00 H
ATOM 4622 HD13 ILE A 287 55.064 57.391 58.289 1.00 0.00 H
ATOM 4623 N LEU A 288 57.157 53.419 55.624 1.00 0.00 N
ATOM 4624 CA LEU A 288 58.504 53.607 55.197 1.00 0.00 C
ATOM 4625 C LEU A 288 59.136 52.516 54.338 1.00 0.00 C
ATOM 4626 O LEU A 288 59.943 52.767 53.422 1.00 0.00 O
ATOM 4627 CB LEU A 288 59.455 53.917 56.360 1.00 0.00 C
ATOM 4628 CG LEU A 288 59.092 55.075 57.258 1.00 0.00 C
ATOM 4629 CD1 LEU A 288 60.247 55.386 58.263 1.00 0.00 C
ATOM 4630 CD2 LEU A 288 58.740 56.399 56.546 1.00 0.00 C
ATOM 4631 H LEU A 288 56.942 53.028 56.530 1.00 0.00 H
ATOM 4632 HA LEU A 288 58.552 54.511 54.591 1.00 0.00 H
ATOM 4633 HB2 LEU A 288 59.531 53.028 56.986 1.00 0.00 H
ATOM 4634 HB3 LEU A 288 60.465 53.957 55.952 1.00 0.00 H
ATOM 4635 HG LEU A 288 58.216 54.837 57.863 1.00 0.00 H
ATOM 4636 HD11 LEU A 288 59.905 56.144 58.967 1.00 0.00 H
ATOM 4637 HD12 LEU A 288 60.475 54.473 58.814 1.00 0.00 H
ATOM 4638 HD13 LEU A 288 61.049 55.766 57.630 1.00 0.00 H
ATOM 4639 HD21 LEU A 288 57.875 56.323 55.887 1.00 0.00 H
ATOM 4640 HD22 LEU A 288 58.448 57.162 57.268 1.00 0.00 H
ATOM 4641 HD23 LEU A 288 59.682 56.610 56.040 1.00 0.00 H
ATOM 4642 N PHE A 289 58.702 51.225 54.439 1.00 0.00 N
ATOM 4643 CA PHE A 289 59.207 50.018 53.709 1.00 0.00 C
ATOM 4644 C PHE A 289 59.262 50.060 52.162 1.00 0.00 C
ATOM 4645 O PHE A 289 60.311 49.610 51.593 1.00 0.00 O
ATOM 4646 CB PHE A 289 58.380 48.817 54.139 1.00 0.00 C
ATOM 4647 CG PHE A 289 58.280 48.489 55.651 1.00 0.00 C
ATOM 4648 CD1 PHE A 289 58.976 49.101 56.723 1.00 0.00 C
ATOM 4649 CD2 PHE A 289 57.437 47.422 55.956 1.00 0.00 C
ATOM 4650 CE1 PHE A 289 58.862 48.607 58.048 1.00 0.00 C
ATOM 4651 CE2 PHE A 289 57.347 47.001 57.308 1.00 0.00 C
ATOM 4652 CZ PHE A 289 58.085 47.508 58.371 1.00 0.00 C
ATOM 4653 H PHE A 289 57.845 51.111 54.961 1.00 0.00 H
ATOM 4654 HA PHE A 289 60.208 49.828 54.098 1.00 0.00 H
ATOM 4655 HB2 PHE A 289 57.365 48.888 53.747 1.00 0.00 H
ATOM 4656 HB3 PHE A 289 58.921 48.030 53.614 1.00 0.00 H
ATOM 4657 HD1 PHE A 289 59.699 49.883 56.544 1.00 0.00 H
ATOM 4658 HD2 PHE A 289 56.884 46.938 55.164 1.00 0.00 H
ATOM 4659 HE1 PHE A 289 59.454 49.136 58.780 1.00 0.00 H
ATOM 4660 HE2 PHE A 289 56.654 46.210 57.554 1.00 0.00 H
ATOM 4661 HZ PHE A 289 57.832 47.154 59.360 1.00 0.00 H
ATOM 4662 N PRO A 290 58.345 50.732 51.468 1.00 0.00 N
ATOM 4663 CA PRO A 290 58.478 50.788 49.954 1.00 0.00 C
ATOM 4664 C PRO A 290 59.584 51.749 49.408 1.00 0.00 C
ATOM 4665 O PRO A 290 59.819 51.800 48.198 1.00 0.00 O
ATOM 4666 CB PRO A 290 57.120 51.105 49.440 1.00 0.00 C
ATOM 4667 CG PRO A 290 56.428 51.925 50.627 1.00 0.00 C
ATOM 4668 CD PRO A 290 57.009 51.270 51.879 1.00 0.00 C
ATOM 4669 HA PRO A 290 58.673 49.760 49.646 1.00 0.00 H
ATOM 4670 HB2 PRO A 290 57.194 51.701 48.531 1.00 0.00 H
ATOM 4671 HB3 PRO A 290 56.494 50.218 49.343 1.00 0.00 H
ATOM 4672 HG2 PRO A 290 56.684 52.984 50.598 1.00 0.00 H
ATOM 4673 HG3 PRO A 290 55.347 51.787 50.645 1.00 0.00 H
ATOM 4674 HD2 PRO A 290 57.176 52.060 52.610 1.00 0.00 H
ATOM 4675 HD3 PRO A 290 56.419 50.476 52.337 1.00 0.00 H
ATOM 4676 N PHE A 291 60.124 52.581 50.257 1.00 0.00 N
ATOM 4677 CA PHE A 291 61.272 53.458 49.837 1.00 0.00 C
ATOM 4678 C PHE A 291 62.461 53.349 50.821 1.00 0.00 C
ATOM 4679 O PHE A 291 63.376 54.184 50.792 1.00 0.00 O
ATOM 4680 CB PHE A 291 60.872 54.924 49.655 1.00 0.00 C
ATOM 4681 CG PHE A 291 60.497 55.805 50.856 1.00 0.00 C
ATOM 4682 CD1 PHE A 291 59.349 55.529 51.652 1.00 0.00 C
ATOM 4683 CD2 PHE A 291 61.344 56.908 51.298 1.00 0.00 C
ATOM 4684 CE1 PHE A 291 58.961 56.386 52.729 1.00 0.00 C
ATOM 4685 CE2 PHE A 291 60.994 57.753 52.353 1.00 0.00 C
ATOM 4686 CZ PHE A 291 59.778 57.550 53.039 1.00 0.00 C
ATOM 4687 H PHE A 291 59.757 52.605 51.197 1.00 0.00 H
ATOM 4688 HA PHE A 291 61.661 52.957 48.950 1.00 0.00 H
ATOM 4689 HB2 PHE A 291 61.647 55.440 49.089 1.00 0.00 H
ATOM 4690 HB3 PHE A 291 59.972 54.850 49.044 1.00 0.00 H
ATOM 4691 HD1 PHE A 291 58.767 54.622 51.583 1.00 0.00 H
ATOM 4692 HD2 PHE A 291 62.242 57.172 50.759 1.00 0.00 H
ATOM 4693 HE1 PHE A 291 58.122 56.222 53.390 1.00 0.00 H
ATOM 4694 HE2 PHE A 291 61.659 58.568 52.595 1.00 0.00 H
ATOM 4695 HZ PHE A 291 59.511 58.226 53.838 1.00 0.00 H
ATOM 4696 N ALA A 292 62.463 52.316 51.597 1.00 0.00 N
ATOM 4697 CA ALA A 292 63.568 52.154 52.651 1.00 0.00 C
ATOM 4698 C ALA A 292 65.019 52.127 52.045 1.00 0.00 C
ATOM 4699 O ALA A 292 65.949 52.694 52.591 1.00 0.00 O
ATOM 4700 CB ALA A 292 63.303 50.861 53.401 1.00 0.00 C
ATOM 4701 H ALA A 292 61.744 51.632 51.408 1.00 0.00 H
ATOM 4702 HA ALA A 292 63.453 52.902 53.436 1.00 0.00 H
ATOM 4703 HB1 ALA A 292 62.311 50.976 53.838 1.00 0.00 H
ATOM 4704 HB2 ALA A 292 63.459 50.024 52.720 1.00 0.00 H
ATOM 4705 HB3 ALA A 292 64.048 50.682 54.175 1.00 0.00 H
ATOM 4706 N ALA A 293 65.237 51.669 50.735 1.00 0.00 N
ATOM 4707 CA ALA A 293 66.508 51.600 50.084 1.00 0.00 C
ATOM 4708 C ALA A 293 66.870 52.940 49.482 1.00 0.00 C
ATOM 4709 O ALA A 293 68.068 53.025 49.165 1.00 0.00 O
ATOM 4710 CB ALA A 293 66.418 50.617 48.940 1.00 0.00 C
ATOM 4711 H ALA A 293 64.453 51.295 50.219 1.00 0.00 H
ATOM 4712 HA ALA A 293 67.295 51.349 50.795 1.00 0.00 H
ATOM 4713 HB1 ALA A 293 67.420 50.649 48.512 1.00 0.00 H
ATOM 4714 HB2 ALA A 293 65.998 49.691 49.334 1.00 0.00 H
ATOM 4715 HB3 ALA A 293 65.721 50.985 48.187 1.00 0.00 H
ATOM 4716 N GLN A 294 65.938 53.888 49.379 1.00 0.00 N
ATOM 4717 CA GLN A 294 66.232 55.302 48.982 1.00 0.00 C
ATOM 4718 C GLN A 294 66.666 56.135 50.248 1.00 0.00 C
ATOM 4719 O GLN A 294 67.386 57.049 50.084 1.00 0.00 O
ATOM 4720 CB GLN A 294 65.085 55.834 48.102 1.00 0.00 C
ATOM 4721 CG GLN A 294 64.825 57.354 48.110 1.00 0.00 C
ATOM 4722 CD GLN A 294 65.910 58.221 47.373 1.00 0.00 C
ATOM 4723 NE2 GLN A 294 65.484 59.362 46.797 1.00 0.00 N
ATOM 4724 OE1 GLN A 294 67.079 57.852 47.333 1.00 0.00 O
ATOM 4725 H GLN A 294 64.988 53.786 49.709 1.00 0.00 H
ATOM 4726 HA GLN A 294 67.066 55.274 48.281 1.00 0.00 H
ATOM 4727 HB2 GLN A 294 65.288 55.528 47.075 1.00 0.00 H
ATOM 4728 HB3 GLN A 294 64.103 55.477 48.413 1.00 0.00 H
ATOM 4729 HG2 GLN A 294 63.904 57.553 47.563 1.00 0.00 H
ATOM 4730 HG3 GLN A 294 64.683 57.603 49.162 1.00 0.00 H
ATOM 4731 HE21 GLN A 294 66.172 60.060 46.551 1.00 0.00 H
ATOM 4732 HE22 GLN A 294 64.503 59.544 46.643 1.00 0.00 H
ATOM 4733 N ILE A 295 66.225 55.726 51.405 1.00 0.00 N
ATOM 4734 CA ILE A 295 66.480 56.406 52.714 1.00 0.00 C
ATOM 4735 C ILE A 295 67.913 56.256 53.132 1.00 0.00 C
ATOM 4736 O ILE A 295 68.357 55.154 53.511 1.00 0.00 O
ATOM 4737 CB ILE A 295 65.526 55.960 53.822 1.00 0.00 C
ATOM 4738 CG1 ILE A 295 64.136 56.423 53.578 1.00 0.00 C
ATOM 4739 CG2 ILE A 295 66.051 56.443 55.229 1.00 0.00 C
ATOM 4740 CD1 ILE A 295 63.090 55.859 54.470 1.00 0.00 C
ATOM 4741 H ILE A 295 65.547 54.977 51.401 1.00 0.00 H
ATOM 4742 HA ILE A 295 66.310 57.482 52.677 1.00 0.00 H
ATOM 4743 HB ILE A 295 65.580 54.872 53.778 1.00 0.00 H
ATOM 4744 HG12 ILE A 295 64.174 57.496 53.763 1.00 0.00 H
ATOM 4745 HG13 ILE A 295 63.800 56.208 52.563 1.00 0.00 H
ATOM 4746 HG21 ILE A 295 66.275 57.501 55.362 1.00 0.00 H
ATOM 4747 HG22 ILE A 295 65.312 56.113 55.959 1.00 0.00 H
ATOM 4748 HG23 ILE A 295 66.985 55.951 55.502 1.00 0.00 H
ATOM 4749 HD11 ILE A 295 63.171 54.773 54.421 1.00 0.00 H
ATOM 4750 HD12 ILE A 295 63.193 56.255 55.480 1.00 0.00 H
ATOM 4751 HD13 ILE A 295 62.159 56.160 53.990 1.00 0.00 H
ATOM 4752 N ARG A 296 68.642 57.391 53.143 1.00 0.00 N
ATOM 4753 CA ARG A 296 70.101 57.488 53.510 1.00 0.00 C
ATOM 4754 C ARG A 296 70.285 57.778 55.073 1.00 0.00 C
ATOM 4755 O ARG A 296 71.263 57.362 55.685 1.00 0.00 O
ATOM 4756 CB ARG A 296 70.661 58.690 52.735 1.00 0.00 C
ATOM 4757 CG ARG A 296 70.833 58.337 51.258 1.00 0.00 C
ATOM 4758 CD ARG A 296 71.340 59.612 50.580 1.00 0.00 C
ATOM 4759 NE ARG A 296 71.657 59.404 49.172 1.00 0.00 N
ATOM 4760 CZ ARG A 296 72.769 59.408 48.463 1.00 0.00 C
ATOM 4761 NH1 ARG A 296 73.909 59.233 49.004 1.00 0.00 N1+
ATOM 4762 NH2 ARG A 296 72.666 59.248 47.171 1.00 0.00 N
ATOM 4763 H ARG A 296 68.283 58.255 52.761 1.00 0.00 H
ATOM 4764 HA ARG A 296 70.593 56.570 53.190 1.00 0.00 H
ATOM 4765 HB2 ARG A 296 69.970 59.533 52.746 1.00 0.00 H
ATOM 4766 HB3 ARG A 296 71.630 59.025 53.104 1.00 0.00 H
ATOM 4767 HG2 ARG A 296 71.619 57.585 51.184 1.00 0.00 H
ATOM 4768 HG3 ARG A 296 69.956 57.877 50.802 1.00 0.00 H
ATOM 4769 HD2 ARG A 296 70.502 60.310 50.566 1.00 0.00 H
ATOM 4770 HD3 ARG A 296 72.202 60.090 51.045 1.00 0.00 H
ATOM 4771 HE ARG A 296 70.858 59.195 48.592 1.00 0.00 H
ATOM 4772 HH11 ARG A 296 73.866 58.939 49.969 1.00 0.00 H
ATOM 4773 HH12 ARG A 296 74.688 58.906 48.450 1.00 0.00 H
ATOM 4774 HH21 ARG A 296 71.801 59.239 46.650 1.00 0.00 H
ATOM 4775 HH22 ARG A 296 73.502 59.509 46.669 1.00 0.00 H
ATOM 4776 N LYS A 297 69.444 58.739 55.594 1.00 0.00 N
ATOM 4777 CA LYS A 297 69.473 59.130 57.016 1.00 0.00 C
ATOM 4778 C LYS A 297 68.119 58.926 57.784 1.00 0.00 C
ATOM 4779 O LYS A 297 67.082 59.362 57.300 1.00 0.00 O
ATOM 4780 CB LYS A 297 69.848 60.587 57.155 1.00 0.00 C
ATOM 4781 CG LYS A 297 69.851 61.145 58.557 1.00 0.00 C
ATOM 4782 CD LYS A 297 70.530 62.448 58.640 1.00 0.00 C
ATOM 4783 CE LYS A 297 70.797 62.832 60.064 1.00 0.00 C
ATOM 4784 NZ LYS A 297 69.683 63.512 60.662 1.00 0.00 N1+
ATOM 4785 H LYS A 297 68.973 59.360 54.951 1.00 0.00 H
ATOM 4786 HA LYS A 297 70.300 58.549 57.421 1.00 0.00 H
ATOM 4787 HB2 LYS A 297 70.792 60.825 56.666 1.00 0.00 H
ATOM 4788 HB3 LYS A 297 69.082 61.081 56.557 1.00 0.00 H
ATOM 4789 HG2 LYS A 297 68.827 61.320 58.887 1.00 0.00 H
ATOM 4790 HG3 LYS A 297 70.327 60.398 59.192 1.00 0.00 H
ATOM 4791 HD2 LYS A 297 71.516 62.345 58.188 1.00 0.00 H
ATOM 4792 HD3 LYS A 297 69.976 63.179 58.052 1.00 0.00 H
ATOM 4793 HE2 LYS A 297 70.980 61.971 60.706 1.00 0.00 H
ATOM 4794 HE3 LYS A 297 71.669 63.485 60.100 1.00 0.00 H
ATOM 4795 HZ1 LYS A 297 69.341 64.218 60.026 1.00 0.00 H
ATOM 4796 HZ2 LYS A 297 68.846 62.986 60.870 1.00 0.00 H
ATOM 4797 HZ3 LYS A 297 69.977 63.960 61.518 1.00 0.00 H
ATOM 4798 N LEU A 298 68.191 58.266 58.884 1.00 0.00 N
ATOM 4799 CA LEU A 298 67.148 58.179 59.903 1.00 0.00 C
ATOM 4800 C LEU A 298 67.481 58.675 61.296 1.00 0.00 C
ATOM 4801 O LEU A 298 68.523 58.337 61.921 1.00 0.00 O
ATOM 4802 CB LEU A 298 66.683 56.675 59.952 1.00 0.00 C
ATOM 4803 CG LEU A 298 66.146 56.113 58.650 1.00 0.00 C
ATOM 4804 CD1 LEU A 298 65.815 54.622 58.836 1.00 0.00 C
ATOM 4805 CD2 LEU A 298 64.821 56.888 58.315 1.00 0.00 C
ATOM 4806 H LEU A 298 69.090 57.852 59.087 1.00 0.00 H
ATOM 4807 HA LEU A 298 66.250 58.716 59.599 1.00 0.00 H
ATOM 4808 HB2 LEU A 298 67.575 56.099 60.197 1.00 0.00 H
ATOM 4809 HB3 LEU A 298 66.021 56.576 60.812 1.00 0.00 H
ATOM 4810 HG LEU A 298 66.865 56.278 57.848 1.00 0.00 H
ATOM 4811 HD11 LEU A 298 65.428 54.232 57.894 1.00 0.00 H
ATOM 4812 HD12 LEU A 298 66.715 54.068 59.104 1.00 0.00 H
ATOM 4813 HD13 LEU A 298 65.020 54.506 59.572 1.00 0.00 H
ATOM 4814 HD21 LEU A 298 65.072 57.805 57.782 1.00 0.00 H
ATOM 4815 HD22 LEU A 298 64.083 56.286 57.786 1.00 0.00 H
ATOM 4816 HD23 LEU A 298 64.303 57.282 59.188 1.00 0.00 H
ATOM 4817 N ASP A 299 66.593 59.483 61.824 1.00 0.00 N
ATOM 4818 CA ASP A 299 66.495 59.747 63.224 1.00 0.00 C
ATOM 4819 C ASP A 299 65.282 59.001 63.781 1.00 0.00 C
ATOM 4820 O ASP A 299 64.124 59.309 63.502 1.00 0.00 O
ATOM 4821 CB ASP A 299 66.332 61.235 63.597 1.00 0.00 C
ATOM 4822 CG ASP A 299 67.209 62.224 62.944 1.00 0.00 C
ATOM 4823 OD1 ASP A 299 67.005 63.473 62.957 1.00 0.00 O
ATOM 4824 OD2 ASP A 299 68.107 61.831 62.222 1.00 0.00 O1-
ATOM 4825 H ASP A 299 65.880 59.829 61.197 1.00 0.00 H
ATOM 4826 HA ASP A 299 67.443 59.390 63.628 1.00 0.00 H
ATOM 4827 HB2 ASP A 299 65.284 61.506 63.464 1.00 0.00 H
ATOM 4828 HB3 ASP A 299 66.570 61.371 64.651 1.00 0.00 H
ATOM 4829 N LEU A 300 65.643 57.860 64.509 1.00 0.00 N
ATOM 4830 CA LEU A 300 64.740 56.918 65.214 1.00 0.00 C
ATOM 4831 C LEU A 300 64.636 57.370 66.707 1.00 0.00 C
ATOM 4832 O LEU A 300 64.106 56.703 67.615 1.00 0.00 O
ATOM 4833 CB LEU A 300 65.248 55.463 64.993 1.00 0.00 C
ATOM 4834 CG LEU A 300 65.080 55.009 63.545 1.00 0.00 C
ATOM 4835 CD1 LEU A 300 65.290 53.447 63.363 1.00 0.00 C
ATOM 4836 CD2 LEU A 300 63.641 55.281 63.050 1.00 0.00 C
ATOM 4837 H LEU A 300 66.617 57.594 64.536 1.00 0.00 H
ATOM 4838 HA LEU A 300 63.716 56.938 64.839 1.00 0.00 H
ATOM 4839 HB2 LEU A 300 66.325 55.353 65.122 1.00 0.00 H
ATOM 4840 HB3 LEU A 300 64.697 54.845 65.702 1.00 0.00 H
ATOM 4841 HG LEU A 300 65.761 55.576 62.910 1.00 0.00 H
ATOM 4842 HD11 LEU A 300 65.110 53.239 62.309 1.00 0.00 H
ATOM 4843 HD12 LEU A 300 66.352 53.247 63.508 1.00 0.00 H
ATOM 4844 HD13 LEU A 300 64.603 52.791 63.897 1.00 0.00 H
ATOM 4845 HD21 LEU A 300 62.891 54.615 63.475 1.00 0.00 H
ATOM 4846 HD22 LEU A 300 63.328 56.325 63.051 1.00 0.00 H
ATOM 4847 HD23 LEU A 300 63.592 55.231 61.963 1.00 0.00 H
ATOM 4848 N LEU A 301 65.229 58.514 66.983 1.00 0.00 N
ATOM 4849 CA LEU A 301 65.518 58.987 68.363 1.00 0.00 C
ATOM 4850 C LEU A 301 64.212 59.215 69.077 1.00 0.00 C
ATOM 4851 O LEU A 301 64.000 58.557 70.126 1.00 0.00 O
ATOM 4852 CB LEU A 301 66.396 60.220 68.263 1.00 0.00 C
ATOM 4853 CG LEU A 301 67.225 60.592 69.582 1.00 0.00 C
ATOM 4854 CD1 LEU A 301 67.434 62.139 69.424 1.00 0.00 C
ATOM 4855 CD2 LEU A 301 66.531 60.294 70.931 1.00 0.00 C
ATOM 4856 H LEU A 301 65.743 58.962 66.238 1.00 0.00 H
ATOM 4857 HA LEU A 301 66.152 58.296 68.919 1.00 0.00 H
ATOM 4858 HB2 LEU A 301 67.034 60.060 67.394 1.00 0.00 H
ATOM 4859 HB3 LEU A 301 65.583 60.919 68.069 1.00 0.00 H
ATOM 4860 HG LEU A 301 68.196 60.109 69.470 1.00 0.00 H
ATOM 4861 HD11 LEU A 301 67.917 62.528 70.320 1.00 0.00 H
ATOM 4862 HD12 LEU A 301 67.964 62.296 68.485 1.00 0.00 H
ATOM 4863 HD13 LEU A 301 66.457 62.621 69.462 1.00 0.00 H
ATOM 4864 HD21 LEU A 301 65.480 60.569 71.015 1.00 0.00 H
ATOM 4865 HD22 LEU A 301 66.567 59.246 71.230 1.00 0.00 H
ATOM 4866 HD23 LEU A 301 67.013 60.860 71.729 1.00 0.00 H
ATOM 4867 N TYR A 302 63.351 59.976 68.418 1.00 0.00 N
ATOM 4868 CA TYR A 302 62.000 60.331 68.968 1.00 0.00 C
ATOM 4869 C TYR A 302 60.931 59.226 68.638 1.00 0.00 C
ATOM 4870 O TYR A 302 59.736 59.530 68.627 1.00 0.00 O
ATOM 4871 CB TYR A 302 61.652 61.766 68.595 1.00 0.00 C
ATOM 4872 CG TYR A 302 62.498 62.879 69.309 1.00 0.00 C
ATOM 4873 CD1 TYR A 302 62.201 63.292 70.629 1.00 0.00 C
ATOM 4874 CD2 TYR A 302 63.620 63.369 68.704 1.00 0.00 C
ATOM 4875 CE1 TYR A 302 62.949 64.280 71.276 1.00 0.00 C
ATOM 4876 CE2 TYR A 302 64.382 64.406 69.366 1.00 0.00 C
ATOM 4877 CZ TYR A 302 64.082 64.802 70.700 1.00 0.00 C
ATOM 4878 OH TYR A 302 64.861 65.667 71.347 1.00 0.00 O
ATOM 4879 H TYR A 302 63.559 60.197 67.454 1.00 0.00 H
ATOM 4880 HA TYR A 302 62.054 60.340 70.057 1.00 0.00 H
ATOM 4881 HB2 TYR A 302 61.647 61.896 67.512 1.00 0.00 H
ATOM 4882 HB3 TYR A 302 60.595 61.865 68.842 1.00 0.00 H
ATOM 4883 HD1 TYR A 302 61.357 62.796 71.086 1.00 0.00 H
ATOM 4884 HD2 TYR A 302 63.800 63.075 67.681 1.00 0.00 H
ATOM 4885 HE1 TYR A 302 62.645 64.598 72.263 1.00 0.00 H
ATOM 4886 HE2 TYR A 302 65.226 64.876 68.883 1.00 0.00 H
ATOM 4887 HH TYR A 302 64.380 66.080 72.068 1.00 0.00 H
ATOM 4888 N ALA A 303 61.240 58.020 68.189 1.00 0.00 N
ATOM 4889 CA ALA A 303 60.234 57.078 67.797 1.00 0.00 C
ATOM 4890 C ALA A 303 59.757 56.218 68.982 1.00 0.00 C
ATOM 4891 O ALA A 303 60.420 56.072 70.018 1.00 0.00 O
ATOM 4892 CB ALA A 303 60.894 56.196 66.742 1.00 0.00 C
ATOM 4893 H ALA A 303 62.224 57.795 68.239 1.00 0.00 H
ATOM 4894 HA ALA A 303 59.377 57.527 67.294 1.00 0.00 H
ATOM 4895 HB1 ALA A 303 61.636 55.542 67.198 1.00 0.00 H
ATOM 4896 HB2 ALA A 303 60.088 55.611 66.299 1.00 0.00 H
ATOM 4897 HB3 ALA A 303 61.359 56.714 65.903 1.00 0.00 H
ATOM 4898 N LEU A 304 58.629 55.584 68.846 1.00 0.00 N
ATOM 4899 CA LEU A 304 57.997 54.695 69.842 1.00 0.00 C
ATOM 4900 C LEU A 304 58.183 53.205 69.532 1.00 0.00 C
ATOM 4901 O LEU A 304 57.250 52.388 69.572 1.00 0.00 O
ATOM 4902 CB LEU A 304 56.587 55.108 70.117 1.00 0.00 C
ATOM 4903 CG LEU A 304 56.305 56.522 70.609 1.00 0.00 C
ATOM 4904 CD1 LEU A 304 54.803 56.646 71.005 1.00 0.00 C
ATOM 4905 CD2 LEU A 304 57.084 56.983 71.810 1.00 0.00 C
ATOM 4906 H LEU A 304 58.186 55.577 67.938 1.00 0.00 H
ATOM 4907 HA LEU A 304 58.533 54.704 70.791 1.00 0.00 H
ATOM 4908 HB2 LEU A 304 55.981 54.899 69.236 1.00 0.00 H
ATOM 4909 HB3 LEU A 304 56.148 54.493 70.902 1.00 0.00 H
ATOM 4910 HG LEU A 304 56.431 57.189 69.756 1.00 0.00 H
ATOM 4911 HD11 LEU A 304 54.266 56.637 70.056 1.00 0.00 H
ATOM 4912 HD12 LEU A 304 54.511 55.804 71.632 1.00 0.00 H
ATOM 4913 HD13 LEU A 304 54.621 57.649 71.392 1.00 0.00 H
ATOM 4914 HD21 LEU A 304 56.815 56.300 72.616 1.00 0.00 H
ATOM 4915 HD22 LEU A 304 58.147 56.920 71.578 1.00 0.00 H
ATOM 4916 HD23 LEU A 304 56.851 58.004 72.112 1.00 0.00 H
ATOM 4917 N LEU A 305 59.458 52.795 69.327 1.00 0.00 N
ATOM 4918 CA LEU A 305 59.829 51.427 68.955 1.00 0.00 C
ATOM 4919 C LEU A 305 60.593 50.638 69.954 1.00 0.00 C
ATOM 4920 O LEU A 305 61.651 51.070 70.376 1.00 0.00 O
ATOM 4921 CB LEU A 305 60.619 51.605 67.625 1.00 0.00 C
ATOM 4922 CG LEU A 305 59.969 52.377 66.433 1.00 0.00 C
ATOM 4923 CD1 LEU A 305 60.841 52.474 65.271 1.00 0.00 C
ATOM 4924 CD2 LEU A 305 58.766 51.592 66.044 1.00 0.00 C
ATOM 4925 H LEU A 305 60.193 53.466 69.500 1.00 0.00 H
ATOM 4926 HA LEU A 305 58.981 50.774 68.745 1.00 0.00 H
ATOM 4927 HB2 LEU A 305 61.566 52.073 67.891 1.00 0.00 H
ATOM 4928 HB3 LEU A 305 60.950 50.606 67.341 1.00 0.00 H
ATOM 4929 HG LEU A 305 59.715 53.402 66.704 1.00 0.00 H
ATOM 4930 HD11 LEU A 305 60.279 52.604 64.346 1.00 0.00 H
ATOM 4931 HD12 LEU A 305 61.524 53.292 65.497 1.00 0.00 H
ATOM 4932 HD13 LEU A 305 61.469 51.586 65.204 1.00 0.00 H
ATOM 4933 HD21 LEU A 305 59.028 50.576 65.748 1.00 0.00 H
ATOM 4934 HD22 LEU A 305 58.143 51.509 66.934 1.00 0.00 H
ATOM 4935 HD23 LEU A 305 58.223 52.200 65.321 1.00 0.00 H
ATOM 4936 N GLU A 306 60.049 49.495 70.262 1.00 0.00 N
ATOM 4937 CA GLU A 306 60.877 48.516 70.998 1.00 0.00 C
ATOM 4938 C GLU A 306 61.955 47.812 70.090 1.00 0.00 C
ATOM 4939 O GLU A 306 62.032 48.050 68.869 1.00 0.00 O
ATOM 4940 CB GLU A 306 59.988 47.498 71.758 1.00 0.00 C
ATOM 4941 CG GLU A 306 59.248 48.129 73.010 1.00 0.00 C
ATOM 4942 CD GLU A 306 58.008 48.951 72.683 1.00 0.00 C
ATOM 4943 OE1 GLU A 306 58.191 50.097 72.304 1.00 0.00 O
ATOM 4944 OE2 GLU A 306 56.936 48.352 72.667 1.00 0.00 O1-
ATOM 4945 H GLU A 306 59.150 49.256 69.869 1.00 0.00 H
ATOM 4946 HA GLU A 306 61.535 49.034 71.695 1.00 0.00 H
ATOM 4947 HB2 GLU A 306 59.270 46.984 71.119 1.00 0.00 H
ATOM 4948 HB3 GLU A 306 60.716 46.793 72.161 1.00 0.00 H
ATOM 4949 HG2 GLU A 306 58.943 47.298 73.647 1.00 0.00 H
ATOM 4950 HG3 GLU A 306 60.024 48.667 73.556 1.00 0.00 H
ATOM 4951 N THR A 307 62.636 46.754 70.601 1.00 0.00 N
ATOM 4952 CA THR A 307 63.856 46.341 69.814 1.00 0.00 C
ATOM 4953 C THR A 307 63.576 45.557 68.582 1.00 0.00 C
ATOM 4954 O THR A 307 64.161 45.708 67.502 1.00 0.00 O
ATOM 4955 CB THR A 307 64.813 45.506 70.699 1.00 0.00 C
ATOM 4956 CG2 THR A 307 66.140 45.375 70.036 1.00 0.00 C
ATOM 4957 OG1 THR A 307 65.053 45.934 72.008 1.00 0.00 O
ATOM 4958 H THR A 307 62.534 46.573 71.589 1.00 0.00 H
ATOM 4959 HA THR A 307 64.467 47.201 69.542 1.00 0.00 H
ATOM 4960 HB THR A 307 64.520 44.459 70.775 1.00 0.00 H
ATOM 4961 HG1 THR A 307 64.206 45.864 72.456 1.00 0.00 H
ATOM 4962 HG21 THR A 307 66.892 45.153 70.794 1.00 0.00 H
ATOM 4963 HG22 THR A 307 66.124 44.546 69.329 1.00 0.00 H
ATOM 4964 HG23 THR A 307 66.573 46.309 69.678 1.00 0.00 H
ATOM 4965 N GLU A 308 62.577 44.660 68.674 1.00 0.00 N
ATOM 4966 CA GLU A 308 62.011 43.875 67.613 1.00 0.00 C
ATOM 4967 C GLU A 308 61.360 44.786 66.582 1.00 0.00 C
ATOM 4968 O GLU A 308 61.392 44.533 65.360 1.00 0.00 O
ATOM 4969 CB GLU A 308 60.943 42.897 68.138 1.00 0.00 C
ATOM 4970 CG GLU A 308 60.326 41.950 67.109 1.00 0.00 C
ATOM 4971 CD GLU A 308 61.303 40.914 66.683 1.00 0.00 C
ATOM 4972 OE1 GLU A 308 61.781 40.873 65.542 1.00 0.00 O
ATOM 4973 OE2 GLU A 308 61.619 39.977 67.401 1.00 0.00 O1-
ATOM 4974 H GLU A 308 62.061 44.739 69.539 1.00 0.00 H
ATOM 4975 HA GLU A 308 62.794 43.273 67.152 1.00 0.00 H
ATOM 4976 HB2 GLU A 308 61.427 42.328 68.932 1.00 0.00 H
ATOM 4977 HB3 GLU A 308 60.107 43.413 68.610 1.00 0.00 H
ATOM 4978 HG2 GLU A 308 59.432 41.439 67.469 1.00 0.00 H
ATOM 4979 HG3 GLU A 308 60.089 42.461 66.176 1.00 0.00 H
ATOM 4980 N ASP A 309 60.856 45.962 67.053 1.00 0.00 N
ATOM 4981 CA ASP A 309 60.233 46.950 66.211 1.00 0.00 C
ATOM 4982 C ASP A 309 61.264 47.739 65.397 1.00 0.00 C
ATOM 4983 O ASP A 309 61.171 47.822 64.158 1.00 0.00 O
ATOM 4984 CB ASP A 309 59.213 47.761 67.010 1.00 0.00 C
ATOM 4985 CG ASP A 309 58.197 46.790 67.715 1.00 0.00 C
ATOM 4986 OD1 ASP A 309 57.420 46.062 66.999 1.00 0.00 O
ATOM 4987 OD2 ASP A 309 58.268 46.642 68.941 1.00 0.00 O1-
ATOM 4988 H ASP A 309 60.978 46.219 68.022 1.00 0.00 H
ATOM 4989 HA ASP A 309 59.587 46.401 65.525 1.00 0.00 H
ATOM 4990 HB2 ASP A 309 59.751 48.356 67.749 1.00 0.00 H
ATOM 4991 HB3 ASP A 309 58.585 48.413 66.404 1.00 0.00 H
ATOM 4992 N HIE A 310 62.252 48.212 66.001 1.00 0.00 N
ATOM 4993 CA HIE A 310 63.476 48.765 65.416 1.00 0.00 C
ATOM 4994 C HIE A 310 64.058 47.895 64.356 1.00 0.00 C
ATOM 4995 O HIE A 310 64.393 48.259 63.212 1.00 0.00 O
ATOM 4996 CB HIE A 310 64.427 49.154 66.501 1.00 0.00 C
ATOM 4997 CG HIE A 310 65.764 49.759 65.974 1.00 0.00 C
ATOM 4998 CD2 HIE A 310 66.802 48.906 65.592 1.00 0.00 C
ATOM 4999 ND1 HIE A 310 66.214 51.108 65.804 1.00 0.00 N
ATOM 5000 CE1 HIE A 310 67.407 50.982 65.182 1.00 0.00 C
ATOM 5001 NE2 HIE A 310 67.869 49.693 65.111 1.00 0.00 N
ATOM 5002 H HIE A 310 62.385 48.006 66.981 1.00 0.00 H
ATOM 5003 HA HIE A 310 63.092 49.665 64.935 1.00 0.00 H
ATOM 5004 HB2 HIE A 310 63.911 49.919 67.081 1.00 0.00 H
ATOM 5005 HB3 HIE A 310 64.598 48.323 67.185 1.00 0.00 H
ATOM 5006 HD2 HIE A 310 66.758 47.827 65.551 1.00 0.00 H
ATOM 5007 HE1 HIE A 310 68.015 51.833 64.911 1.00 0.00 H
ATOM 5008 HE2 HIE A 310 68.819 49.421 64.902 1.00 0.00 H
ATOM 5009 N CYS A 311 64.234 46.605 64.754 1.00 0.00 N
ATOM 5010 CA CYS A 311 65.014 45.809 63.896 1.00 0.00 C
ATOM 5011 C CYS A 311 64.216 45.454 62.636 1.00 0.00 C
ATOM 5012 O CYS A 311 64.802 45.327 61.566 1.00 0.00 O
ATOM 5013 CB CYS A 311 65.599 44.556 64.581 1.00 0.00 C
ATOM 5014 SG CYS A 311 66.770 45.051 65.891 1.00 0.00 S
ATOM 5015 H CYS A 311 64.051 46.416 65.729 1.00 0.00 H
ATOM 5016 HA CYS A 311 65.837 46.400 63.493 1.00 0.00 H
ATOM 5017 HB2 CYS A 311 64.849 43.966 65.108 1.00 0.00 H
ATOM 5018 HB3 CYS A 311 66.085 44.090 63.724 1.00 0.00 H
ATOM 5019 HG CYS A 311 65.933 45.591 66.781 1.00 0.00 H
ATOM 5020 N THR A 312 62.863 45.284 62.727 1.00 0.00 N
ATOM 5021 CA THR A 312 61.950 45.218 61.618 1.00 0.00 C
ATOM 5022 C THR A 312 62.177 46.273 60.547 1.00 0.00 C
ATOM 5023 O THR A 312 62.269 45.961 59.355 1.00 0.00 O
ATOM 5024 CB THR A 312 60.540 45.293 62.096 1.00 0.00 C
ATOM 5025 CG2 THR A 312 59.511 45.601 60.990 1.00 0.00 C
ATOM 5026 OG1 THR A 312 60.219 44.098 62.779 1.00 0.00 O
ATOM 5027 H THR A 312 62.515 45.304 63.675 1.00 0.00 H
ATOM 5028 HA THR A 312 62.020 44.241 61.141 1.00 0.00 H
ATOM 5029 HB THR A 312 60.391 46.045 62.870 1.00 0.00 H
ATOM 5030 HG1 THR A 312 60.776 43.990 63.553 1.00 0.00 H
ATOM 5031 HG21 THR A 312 58.498 45.404 61.340 1.00 0.00 H
ATOM 5032 HG22 THR A 312 59.477 46.649 60.693 1.00 0.00 H
ATOM 5033 HG23 THR A 312 59.668 45.032 60.073 1.00 0.00 H
ATOM 5034 N LEU A 313 62.298 47.520 60.978 1.00 0.00 N
ATOM 5035 CA LEU A 313 62.575 48.679 59.996 1.00 0.00 C
ATOM 5036 C LEU A 313 63.981 48.542 59.456 1.00 0.00 C
ATOM 5037 O LEU A 313 64.198 48.466 58.236 1.00 0.00 O
ATOM 5038 CB LEU A 313 62.335 50.044 60.713 1.00 0.00 C
ATOM 5039 CG LEU A 313 62.884 51.372 59.989 1.00 0.00 C
ATOM 5040 CD1 LEU A 313 62.402 51.310 58.448 1.00 0.00 C
ATOM 5041 CD2 LEU A 313 62.345 52.682 60.647 1.00 0.00 C
ATOM 5042 H LEU A 313 62.446 47.648 61.969 1.00 0.00 H
ATOM 5043 HA LEU A 313 61.904 48.487 59.159 1.00 0.00 H
ATOM 5044 HB2 LEU A 313 61.250 50.140 60.754 1.00 0.00 H
ATOM 5045 HB3 LEU A 313 62.779 49.985 61.707 1.00 0.00 H
ATOM 5046 HG LEU A 313 63.969 51.271 59.986 1.00 0.00 H
ATOM 5047 HD11 LEU A 313 61.347 51.548 58.312 1.00 0.00 H
ATOM 5048 HD12 LEU A 313 62.999 52.122 58.032 1.00 0.00 H
ATOM 5049 HD13 LEU A 313 62.719 50.437 57.876 1.00 0.00 H
ATOM 5050 HD21 LEU A 313 62.534 52.672 61.720 1.00 0.00 H
ATOM 5051 HD22 LEU A 313 62.909 53.562 60.337 1.00 0.00 H
ATOM 5052 HD23 LEU A 313 61.262 52.728 60.539 1.00 0.00 H
ATOM 5053 N ILE A 314 64.995 48.375 60.328 1.00 0.00 N
ATOM 5054 CA ILE A 314 66.389 48.521 59.884 1.00 0.00 C
ATOM 5055 C ILE A 314 67.022 47.370 59.111 1.00 0.00 C
ATOM 5056 O ILE A 314 67.775 47.556 58.131 1.00 0.00 O
ATOM 5057 CB ILE A 314 67.254 49.024 61.033 1.00 0.00 C
ATOM 5058 CG1 ILE A 314 66.977 50.439 61.512 1.00 0.00 C
ATOM 5059 CG2 ILE A 314 68.819 48.874 60.803 1.00 0.00 C
ATOM 5060 CD1 ILE A 314 67.097 51.557 60.480 1.00 0.00 C
ATOM 5061 H ILE A 314 64.766 48.214 61.299 1.00 0.00 H
ATOM 5062 HA ILE A 314 66.393 49.357 59.185 1.00 0.00 H
ATOM 5063 HB ILE A 314 67.026 48.443 61.926 1.00 0.00 H
ATOM 5064 HG12 ILE A 314 65.968 50.375 61.919 1.00 0.00 H
ATOM 5065 HG13 ILE A 314 67.469 50.720 62.443 1.00 0.00 H
ATOM 5066 HG21 ILE A 314 69.393 49.166 61.683 1.00 0.00 H
ATOM 5067 HG22 ILE A 314 69.043 47.820 60.640 1.00 0.00 H
ATOM 5068 HG23 ILE A 314 69.125 49.428 59.916 1.00 0.00 H
ATOM 5069 HD11 ILE A 314 66.730 52.452 60.983 1.00 0.00 H
ATOM 5070 HD12 ILE A 314 68.127 51.675 60.145 1.00 0.00 H
ATOM 5071 HD13 ILE A 314 66.382 51.356 59.682 1.00 0.00 H
ATOM 5072 N GLN A 315 66.560 46.129 59.316 1.00 0.00 N
ATOM 5073 CA GLN A 315 66.936 45.000 58.480 1.00 0.00 C
ATOM 5074 C GLN A 315 66.470 45.214 57.023 1.00 0.00 C
ATOM 5075 O GLN A 315 66.785 44.385 56.243 1.00 0.00 O
ATOM 5076 CB GLN A 315 66.327 43.722 59.059 1.00 0.00 C
ATOM 5077 CG GLN A 315 64.824 43.538 58.771 1.00 0.00 C
ATOM 5078 CD GLN A 315 64.224 42.363 59.539 1.00 0.00 C
ATOM 5079 NE2 GLN A 315 62.915 42.322 59.829 1.00 0.00 N
ATOM 5080 OE1 GLN A 315 64.892 41.442 59.952 1.00 0.00 O
ATOM 5081 H GLN A 315 66.012 46.014 60.157 1.00 0.00 H
ATOM 5082 HA GLN A 315 68.025 44.951 58.490 1.00 0.00 H
ATOM 5083 HB2 GLN A 315 66.860 42.818 58.764 1.00 0.00 H
ATOM 5084 HB3 GLN A 315 66.372 43.800 60.146 1.00 0.00 H
ATOM 5085 HG2 GLN A 315 64.297 44.460 59.015 1.00 0.00 H
ATOM 5086 HG3 GLN A 315 64.686 43.258 57.727 1.00 0.00 H
ATOM 5087 HE21 GLN A 315 62.480 41.548 60.311 1.00 0.00 H
ATOM 5088 HE22 GLN A 315 62.338 43.065 59.463 1.00 0.00 H
ATOM 5089 N LYS A 316 65.683 46.276 56.623 1.00 0.00 N
ATOM 5090 CA LYS A 316 65.248 46.648 55.241 1.00 0.00 C
ATOM 5091 C LYS A 316 66.123 47.620 54.462 1.00 0.00 C
ATOM 5092 O LYS A 316 65.814 47.751 53.289 1.00 0.00 O
ATOM 5093 CB LYS A 316 63.798 47.102 55.279 1.00 0.00 C
ATOM 5094 CG LYS A 316 62.889 45.983 55.834 1.00 0.00 C
ATOM 5095 CD LYS A 316 61.430 46.406 55.804 1.00 0.00 C
ATOM 5096 CE LYS A 316 60.527 45.324 56.394 1.00 0.00 C
ATOM 5097 NZ LYS A 316 59.992 44.332 55.362 1.00 0.00 N1+
ATOM 5098 H LYS A 316 65.314 46.856 57.363 1.00 0.00 H
ATOM 5099 HA LYS A 316 65.210 45.714 54.681 1.00 0.00 H
ATOM 5100 HB2 LYS A 316 63.754 47.960 55.951 1.00 0.00 H
ATOM 5101 HB3 LYS A 316 63.345 47.297 54.306 1.00 0.00 H
ATOM 5102 HG2 LYS A 316 63.082 45.062 55.284 1.00 0.00 H
ATOM 5103 HG3 LYS A 316 63.246 45.796 56.846 1.00 0.00 H
ATOM 5104 HD2 LYS A 316 61.342 47.326 56.380 1.00 0.00 H
ATOM 5105 HD3 LYS A 316 61.184 46.639 54.768 1.00 0.00 H
ATOM 5106 HE2 LYS A 316 61.179 44.853 57.130 1.00 0.00 H
ATOM 5107 HE3 LYS A 316 59.670 45.757 56.912 1.00 0.00 H
ATOM 5108 HZ1 LYS A 316 59.239 44.720 54.812 1.00 0.00 H
ATOM 5109 HZ2 LYS A 316 60.731 43.848 54.874 1.00 0.00 H
ATOM 5110 HZ3 LYS A 316 59.566 43.614 55.931 1.00 0.00 H
ATOM 5111 N CYS A 317 67.106 48.305 55.085 1.00 0.00 N
ATOM 5112 CA CYS A 317 67.657 49.631 54.611 1.00 0.00 C
ATOM 5113 C CYS A 317 69.136 49.501 54.040 1.00 0.00 C
ATOM 5114 O CYS A 317 70.146 49.659 54.795 1.00 0.00 O
ATOM 5115 CB CYS A 317 67.475 50.600 55.730 1.00 0.00 C
ATOM 5116 SG CYS A 317 65.767 50.707 56.243 1.00 0.00 S
ATOM 5117 H CYS A 317 67.403 48.040 56.014 1.00 0.00 H
ATOM 5118 HA CYS A 317 67.062 50.037 53.793 1.00 0.00 H
ATOM 5119 HB2 CYS A 317 68.082 50.298 56.584 1.00 0.00 H
ATOM 5120 HB3 CYS A 317 67.872 51.535 55.335 1.00 0.00 H
ATOM 5121 HG CYS A 317 65.695 49.631 57.032 1.00 0.00 H
ATOM 5122 N PRO A 318 69.297 49.085 52.773 1.00 0.00 N
ATOM 5123 CA PRO A 318 70.618 48.840 52.145 1.00 0.00 C
ATOM 5124 C PRO A 318 71.550 49.987 51.825 1.00 0.00 C
ATOM 5125 O PRO A 318 72.771 49.774 51.556 1.00 0.00 O
ATOM 5126 CB PRO A 318 70.227 47.912 50.896 1.00 0.00 C
ATOM 5127 CG PRO A 318 68.870 48.493 50.558 1.00 0.00 C
ATOM 5128 CD PRO A 318 68.191 48.492 51.939 1.00 0.00 C
ATOM 5129 HA PRO A 318 71.206 48.256 52.853 1.00 0.00 H
ATOM 5130 HB2 PRO A 318 70.882 47.883 50.025 1.00 0.00 H
ATOM 5131 HB3 PRO A 318 70.279 46.891 51.275 1.00 0.00 H
ATOM 5132 HG2 PRO A 318 68.774 49.459 50.063 1.00 0.00 H
ATOM 5133 HG3 PRO A 318 68.301 47.724 50.036 1.00 0.00 H
ATOM 5134 HD2 PRO A 318 67.296 49.115 51.975 1.00 0.00 H
ATOM 5135 HD3 PRO A 318 67.927 47.471 52.215 1.00 0.00 H
ATOM 5136 N ASN A 319 71.112 51.288 51.875 1.00 0.00 N
ATOM 5137 CA ASN A 319 71.910 52.527 51.678 1.00 0.00 C
ATOM 5138 C ASN A 319 71.929 53.464 52.911 1.00 0.00 C
ATOM 5139 O ASN A 319 71.945 54.703 52.837 1.00 0.00 O
ATOM 5140 CB ASN A 319 71.464 53.117 50.382 1.00 0.00 C
ATOM 5141 CG ASN A 319 71.633 52.217 49.179 1.00 0.00 C
ATOM 5142 ND2 ASN A 319 70.507 51.919 48.611 1.00 0.00 N
ATOM 5143 OD1 ASN A 319 72.737 51.827 48.895 1.00 0.00 O
ATOM 5144 H ASN A 319 70.165 51.442 52.192 1.00 0.00 H
ATOM 5145 HA ASN A 319 72.958 52.240 51.596 1.00 0.00 H
ATOM 5146 HB2 ASN A 319 70.421 53.434 50.359 1.00 0.00 H
ATOM 5147 HB3 ASN A 319 72.129 53.923 50.071 1.00 0.00 H
ATOM 5148 HD21 ASN A 319 70.418 51.353 47.779 1.00 0.00 H
ATOM 5149 HD22 ASN A 319 69.649 52.286 48.997 1.00 0.00 H
ATOM 5150 N LEU A 320 71.612 52.896 54.092 1.00 0.00 N
ATOM 5151 CA LEU A 320 71.558 53.696 55.327 1.00 0.00 C
ATOM 5152 C LEU A 320 73.006 54.197 55.716 1.00 0.00 C
ATOM 5153 O LEU A 320 73.840 53.353 55.992 1.00 0.00 O
ATOM 5154 CB LEU A 320 70.892 52.972 56.524 1.00 0.00 C
ATOM 5155 CG LEU A 320 70.666 53.876 57.743 1.00 0.00 C
ATOM 5156 CD1 LEU A 320 69.456 54.745 57.542 1.00 0.00 C
ATOM 5157 CD2 LEU A 320 70.444 52.901 58.856 1.00 0.00 C
ATOM 5158 H LEU A 320 71.438 51.901 54.088 1.00 0.00 H
ATOM 5159 HA LEU A 320 71.034 54.612 55.055 1.00 0.00 H
ATOM 5160 HB2 LEU A 320 69.963 52.553 56.138 1.00 0.00 H
ATOM 5161 HB3 LEU A 320 71.497 52.102 56.779 1.00 0.00 H
ATOM 5162 HG LEU A 320 71.514 54.537 57.923 1.00 0.00 H
ATOM 5163 HD11 LEU A 320 69.377 55.500 58.324 1.00 0.00 H
ATOM 5164 HD12 LEU A 320 69.686 55.257 56.607 1.00 0.00 H
ATOM 5165 HD13 LEU A 320 68.529 54.178 57.616 1.00 0.00 H
ATOM 5166 HD21 LEU A 320 69.601 52.211 58.807 1.00 0.00 H
ATOM 5167 HD22 LEU A 320 71.297 52.234 58.976 1.00 0.00 H
ATOM 5168 HD23 LEU A 320 70.358 53.471 59.781 1.00 0.00 H
ATOM 5169 N GLU A 321 73.256 55.511 55.604 1.00 0.00 N
ATOM 5170 CA GLU A 321 74.559 56.172 55.885 1.00 0.00 C
ATOM 5171 C GLU A 321 74.738 56.663 57.315 1.00 0.00 C
ATOM 5172 O GLU A 321 75.834 56.493 57.882 1.00 0.00 O
ATOM 5173 CB GLU A 321 74.803 57.362 54.935 1.00 0.00 C
ATOM 5174 CG GLU A 321 75.078 56.999 53.458 1.00 0.00 C
ATOM 5175 CD GLU A 321 74.818 58.183 52.525 1.00 0.00 C
ATOM 5176 OE1 GLU A 321 74.681 59.276 53.076 1.00 0.00 O
ATOM 5177 OE2 GLU A 321 74.757 57.989 51.291 1.00 0.00 O1-
ATOM 5178 H GLU A 321 72.481 56.147 55.482 1.00 0.00 H
ATOM 5179 HA GLU A 321 75.385 55.477 55.738 1.00 0.00 H
ATOM 5180 HB2 GLU A 321 73.954 58.030 55.083 1.00 0.00 H
ATOM 5181 HB3 GLU A 321 75.728 57.789 55.320 1.00 0.00 H
ATOM 5182 HG2 GLU A 321 76.133 56.722 53.466 1.00 0.00 H
ATOM 5183 HG3 GLU A 321 74.424 56.206 53.094 1.00 0.00 H
ATOM 5184 N VAL A 322 73.679 57.232 57.909 1.00 0.00 N
ATOM 5185 CA VAL A 322 73.609 57.950 59.224 1.00 0.00 C
ATOM 5186 C VAL A 322 72.341 57.531 59.895 1.00 0.00 C
ATOM 5187 O VAL A 322 71.238 57.626 59.412 1.00 0.00 O
ATOM 5188 CB VAL A 322 73.532 59.483 59.103 1.00 0.00 C
ATOM 5189 CG1 VAL A 322 73.477 60.243 60.414 1.00 0.00 C
ATOM 5190 CG2 VAL A 322 74.682 60.107 58.303 1.00 0.00 C
ATOM 5191 H VAL A 322 72.820 57.231 57.378 1.00 0.00 H
ATOM 5192 HA VAL A 322 74.434 57.653 59.872 1.00 0.00 H
ATOM 5193 HB VAL A 322 72.658 59.709 58.493 1.00 0.00 H
ATOM 5194 HG11 VAL A 322 74.353 59.944 60.989 1.00 0.00 H
ATOM 5195 HG12 VAL A 322 73.564 61.315 60.232 1.00 0.00 H
ATOM 5196 HG13 VAL A 322 72.555 59.937 60.908 1.00 0.00 H
ATOM 5197 HG21 VAL A 322 74.664 61.176 58.093 1.00 0.00 H
ATOM 5198 HG22 VAL A 322 75.671 59.936 58.730 1.00 0.00 H
ATOM 5199 HG23 VAL A 322 74.691 59.627 57.324 1.00 0.00 H
ATOM 5200 N LEU A 323 72.504 57.118 61.141 1.00 0.00 N
ATOM 5201 CA LEU A 323 71.430 56.672 62.000 1.00 0.00 C
ATOM 5202 C LEU A 323 71.701 57.268 63.372 1.00 0.00 C
ATOM 5203 O LEU A 323 72.785 57.672 63.782 1.00 0.00 O
ATOM 5204 CB LEU A 323 71.515 55.188 62.064 1.00 0.00 C
ATOM 5205 CG LEU A 323 70.466 54.343 62.824 1.00 0.00 C
ATOM 5206 CD1 LEU A 323 69.010 54.453 62.329 1.00 0.00 C
ATOM 5207 CD2 LEU A 323 70.920 52.891 62.873 1.00 0.00 C
ATOM 5208 H LEU A 323 73.449 57.229 61.480 1.00 0.00 H
ATOM 5209 HA LEU A 323 70.482 57.041 61.609 1.00 0.00 H
ATOM 5210 HB2 LEU A 323 71.583 54.887 61.019 1.00 0.00 H
ATOM 5211 HB3 LEU A 323 72.453 54.967 62.574 1.00 0.00 H
ATOM 5212 HG LEU A 323 70.534 54.638 63.871 1.00 0.00 H
ATOM 5213 HD11 LEU A 323 68.584 55.390 62.686 1.00 0.00 H
ATOM 5214 HD12 LEU A 323 69.029 54.551 61.244 1.00 0.00 H
ATOM 5215 HD13 LEU A 323 68.470 53.634 62.804 1.00 0.00 H
ATOM 5216 HD21 LEU A 323 71.996 52.778 63.007 1.00 0.00 H
ATOM 5217 HD22 LEU A 323 70.375 52.372 63.661 1.00 0.00 H
ATOM 5218 HD23 LEU A 323 70.648 52.450 61.914 1.00 0.00 H
ATOM 5219 N GLU A 324 70.611 57.374 64.142 1.00 0.00 N
ATOM 5220 CA GLU A 324 70.484 57.923 65.519 1.00 0.00 C
ATOM 5221 C GLU A 324 69.169 57.483 66.235 1.00 0.00 C
ATOM 5222 O GLU A 324 68.067 57.380 65.707 1.00 0.00 O
ATOM 5223 CB GLU A 324 70.529 59.436 65.517 1.00 0.00 C
ATOM 5224 CG GLU A 324 70.447 60.122 66.846 1.00 0.00 C
ATOM 5225 CD GLU A 324 71.003 61.603 66.948 1.00 0.00 C
ATOM 5226 OE1 GLU A 324 71.850 62.093 66.169 1.00 0.00 O
ATOM 5227 OE2 GLU A 324 70.524 62.257 67.903 1.00 0.00 O1-
ATOM 5228 H GLU A 324 69.735 57.109 63.717 1.00 0.00 H
ATOM 5229 HA GLU A 324 71.267 57.513 66.156 1.00 0.00 H
ATOM 5230 HB2 GLU A 324 71.448 59.691 64.990 1.00 0.00 H
ATOM 5231 HB3 GLU A 324 69.775 59.851 64.848 1.00 0.00 H
ATOM 5232 HG2 GLU A 324 69.474 60.006 67.325 1.00 0.00 H
ATOM 5233 HG3 GLU A 324 71.072 59.516 67.502 1.00 0.00 H
ATOM 5234 N THR A 325 69.330 57.146 67.508 1.00 0.00 N
ATOM 5235 CA THR A 325 68.381 56.279 68.315 1.00 0.00 C
ATOM 5236 C THR A 325 68.581 56.603 69.770 1.00 0.00 C
ATOM 5237 O THR A 325 69.584 57.039 70.272 1.00 0.00 O
ATOM 5238 CB THR A 325 68.690 54.771 68.055 1.00 0.00 C
ATOM 5239 CG2 THR A 325 68.764 54.249 66.651 1.00 0.00 C
ATOM 5240 OG1 THR A 325 70.001 54.440 68.475 1.00 0.00 O
ATOM 5241 H THR A 325 70.259 57.269 67.885 1.00 0.00 H
ATOM 5242 HA THR A 325 67.348 56.448 68.011 1.00 0.00 H
ATOM 5243 HB THR A 325 67.923 54.227 68.606 1.00 0.00 H
ATOM 5244 HG1 THR A 325 69.942 54.286 69.421 1.00 0.00 H
ATOM 5245 HG21 THR A 325 68.800 53.160 66.665 1.00 0.00 H
ATOM 5246 HG22 THR A 325 67.916 54.608 66.068 1.00 0.00 H
ATOM 5247 HG23 THR A 325 69.648 54.594 66.115 1.00 0.00 H
ATOM 5248 N ARG A 326 67.690 56.028 70.614 1.00 0.00 N
ATOM 5249 CA ARG A 326 68.006 55.718 72.049 1.00 0.00 C
ATOM 5250 C ARG A 326 68.686 54.418 72.111 1.00 0.00 C
ATOM 5251 O ARG A 326 68.682 53.630 71.163 1.00 0.00 O
ATOM 5252 CB ARG A 326 66.783 55.719 72.986 1.00 0.00 C
ATOM 5253 CG ARG A 326 65.979 57.042 73.026 1.00 0.00 C
ATOM 5254 CD ARG A 326 64.695 57.073 73.872 1.00 0.00 C
ATOM 5255 NE ARG A 326 63.790 55.940 73.547 1.00 0.00 N
ATOM 5256 CZ ARG A 326 63.027 55.765 72.514 1.00 0.00 C
ATOM 5257 NH1 ARG A 326 62.889 56.585 71.547 1.00 0.00 N1+
ATOM 5258 NH2 ARG A 326 62.232 54.735 72.459 1.00 0.00 N
ATOM 5259 H ARG A 326 66.844 55.620 70.244 1.00 0.00 H
ATOM 5260 HA ARG A 326 68.757 56.443 72.363 1.00 0.00 H
ATOM 5261 HB2 ARG A 326 66.091 54.936 72.678 1.00 0.00 H
ATOM 5262 HB3 ARG A 326 67.170 55.443 73.967 1.00 0.00 H
ATOM 5263 HG2 ARG A 326 66.547 57.937 73.278 1.00 0.00 H
ATOM 5264 HG3 ARG A 326 65.745 57.237 71.979 1.00 0.00 H
ATOM 5265 HD2 ARG A 326 64.994 57.021 74.918 1.00 0.00 H
ATOM 5266 HD3 ARG A 326 64.222 58.047 73.745 1.00 0.00 H
ATOM 5267 HE ARG A 326 63.745 55.312 74.337 1.00 0.00 H
ATOM 5268 HH11 ARG A 326 63.549 57.306 71.292 1.00 0.00 H
ATOM 5269 HH12 ARG A 326 62.187 56.325 70.869 1.00 0.00 H
ATOM 5270 HH21 ARG A 326 62.290 54.051 73.200 1.00 0.00 H
ATOM 5271 HH22 ARG A 326 61.958 54.533 71.508 1.00 0.00 H
ATOM 5272 N ASN A 327 69.271 54.053 73.224 1.00 0.00 N
ATOM 5273 CA ASN A 327 70.087 52.866 73.459 1.00 0.00 C
ATOM 5274 C ASN A 327 69.257 51.559 73.476 1.00 0.00 C
ATOM 5275 O ASN A 327 69.828 50.500 73.155 1.00 0.00 O
ATOM 5276 CB ASN A 327 70.884 52.971 74.797 1.00 0.00 C
ATOM 5277 CG ASN A 327 69.933 53.189 75.984 1.00 0.00 C
ATOM 5278 ND2 ASN A 327 70.536 53.253 77.186 1.00 0.00 N
ATOM 5279 OD1 ASN A 327 68.719 53.228 75.986 1.00 0.00 O
ATOM 5280 H ASN A 327 69.446 54.634 74.032 1.00 0.00 H
ATOM 5281 HA ASN A 327 70.873 52.709 72.720 1.00 0.00 H
ATOM 5282 HB2 ASN A 327 71.364 52.003 74.938 1.00 0.00 H
ATOM 5283 HB3 ASN A 327 71.603 53.781 74.681 1.00 0.00 H
ATOM 5284 HD21 ASN A 327 69.953 53.531 77.962 1.00 0.00 H
ATOM 5285 HD22 ASN A 327 71.514 53.064 77.351 1.00 0.00 H
ATOM 5286 N VAL A 328 67.907 51.663 73.529 1.00 0.00 N
ATOM 5287 CA VAL A 328 66.911 50.684 73.035 1.00 0.00 C
ATOM 5288 C VAL A 328 67.093 50.229 71.552 1.00 0.00 C
ATOM 5289 O VAL A 328 66.250 49.539 70.983 1.00 0.00 O
ATOM 5290 CB VAL A 328 65.475 51.147 73.333 1.00 0.00 C
ATOM 5291 CG1 VAL A 328 64.984 52.268 72.356 1.00 0.00 C
ATOM 5292 CG2 VAL A 328 64.515 49.954 73.434 1.00 0.00 C
ATOM 5293 H VAL A 328 67.524 52.496 73.955 1.00 0.00 H
ATOM 5294 HA VAL A 328 67.063 49.894 73.771 1.00 0.00 H
ATOM 5295 HB VAL A 328 65.593 51.552 74.338 1.00 0.00 H
ATOM 5296 HG11 VAL A 328 65.830 52.937 72.196 1.00 0.00 H
ATOM 5297 HG12 VAL A 328 64.706 51.850 71.388 1.00 0.00 H
ATOM 5298 HG13 VAL A 328 64.144 52.853 72.731 1.00 0.00 H
ATOM 5299 HG21 VAL A 328 63.581 50.414 73.756 1.00 0.00 H
ATOM 5300 HG22 VAL A 328 64.174 49.588 72.466 1.00 0.00 H
ATOM 5301 HG23 VAL A 328 64.883 49.149 74.071 1.00 0.00 H
ATOM 5302 N ILE A 329 68.268 50.485 70.897 1.00 0.00 N
ATOM 5303 CA ILE A 329 68.686 49.700 69.691 1.00 0.00 C
ATOM 5304 C ILE A 329 69.094 48.306 70.253 1.00 0.00 C
ATOM 5305 O ILE A 329 68.908 47.307 69.541 1.00 0.00 O
ATOM 5306 CB ILE A 329 69.761 50.581 68.924 1.00 0.00 C
ATOM 5307 CG1 ILE A 329 70.264 49.747 67.711 1.00 0.00 C
ATOM 5308 CG2 ILE A 329 71.002 50.861 69.760 1.00 0.00 C
ATOM 5309 CD1 ILE A 329 70.930 50.661 66.703 1.00 0.00 C
ATOM 5310 H ILE A 329 69.013 50.979 71.368 1.00 0.00 H
ATOM 5311 HA ILE A 329 67.815 49.599 69.044 1.00 0.00 H
ATOM 5312 HB ILE A 329 69.304 51.513 68.593 1.00 0.00 H
ATOM 5313 HG12 ILE A 329 71.008 49.015 68.025 1.00 0.00 H
ATOM 5314 HG13 ILE A 329 69.426 49.256 67.217 1.00 0.00 H
ATOM 5315 HG21 ILE A 329 70.696 51.379 70.669 1.00 0.00 H
ATOM 5316 HG22 ILE A 329 71.493 49.939 70.069 1.00 0.00 H
ATOM 5317 HG23 ILE A 329 71.789 51.451 69.291 1.00 0.00 H
ATOM 5318 HD11 ILE A 329 71.702 51.249 67.199 1.00 0.00 H
ATOM 5319 HD12 ILE A 329 71.440 50.113 65.910 1.00 0.00 H
ATOM 5320 HD13 ILE A 329 70.148 51.224 66.194 1.00 0.00 H
ATOM 5321 N GLY A 330 69.591 48.092 71.495 1.00 0.00 N
ATOM 5322 CA GLY A 330 69.918 46.744 72.032 1.00 0.00 C
ATOM 5323 C GLY A 330 71.236 46.130 71.489 1.00 0.00 C
ATOM 5324 O GLY A 330 71.862 46.667 70.524 1.00 0.00 O
ATOM 5325 H GLY A 330 69.764 48.885 72.096 1.00 0.00 H
ATOM 5326 HA2 GLY A 330 70.135 46.770 73.100 1.00 0.00 H
ATOM 5327 HA3 GLY A 330 69.085 46.060 71.869 1.00 0.00 H
ATOM 5328 N ASP A 331 71.672 45.029 72.129 1.00 0.00 N
ATOM 5329 CA ASP A 331 72.664 44.172 71.527 1.00 0.00 C
ATOM 5330 C ASP A 331 72.251 43.615 70.153 1.00 0.00 C
ATOM 5331 O ASP A 331 73.022 43.731 69.188 1.00 0.00 O
ATOM 5332 CB ASP A 331 72.977 42.925 72.425 1.00 0.00 C
ATOM 5333 CG ASP A 331 74.002 43.216 73.524 1.00 0.00 C
ATOM 5334 OD1 ASP A 331 74.052 42.535 74.587 1.00 0.00 O
ATOM 5335 OD2 ASP A 331 74.932 43.989 73.328 1.00 0.00 O1-
ATOM 5336 H ASP A 331 70.961 44.631 72.725 1.00 0.00 H
ATOM 5337 HA ASP A 331 73.513 44.788 71.232 1.00 0.00 H
ATOM 5338 HB2 ASP A 331 72.042 42.732 72.951 1.00 0.00 H
ATOM 5339 HB3 ASP A 331 73.184 41.984 71.915 1.00 0.00 H
ATOM 5340 N ARG A 332 71.020 43.147 69.942 1.00 0.00 N
ATOM 5341 CA ARG A 332 70.435 42.722 68.632 1.00 0.00 C
ATOM 5342 C ARG A 332 70.439 43.751 67.605 1.00 0.00 C
ATOM 5343 O ARG A 332 70.816 43.430 66.436 1.00 0.00 O
ATOM 5344 CB ARG A 332 68.994 42.133 68.789 1.00 0.00 C
ATOM 5345 CG ARG A 332 68.369 41.521 67.576 1.00 0.00 C
ATOM 5346 CD ARG A 332 67.355 40.380 67.893 1.00 0.00 C
ATOM 5347 NE ARG A 332 66.138 40.748 68.579 1.00 0.00 N
ATOM 5348 CZ ARG A 332 64.903 40.661 68.125 1.00 0.00 C
ATOM 5349 NH1 ARG A 332 64.507 40.294 66.951 1.00 0.00 N1+
ATOM 5350 NH2 ARG A 332 63.881 40.814 68.849 1.00 0.00 N
ATOM 5351 H ARG A 332 70.361 43.242 70.701 1.00 0.00 H
ATOM 5352 HA ARG A 332 71.083 41.944 68.228 1.00 0.00 H
ATOM 5353 HB2 ARG A 332 69.131 41.424 69.606 1.00 0.00 H
ATOM 5354 HB3 ARG A 332 68.359 42.939 69.156 1.00 0.00 H
ATOM 5355 HG2 ARG A 332 67.880 42.294 66.983 1.00 0.00 H
ATOM 5356 HG3 ARG A 332 69.192 41.152 66.964 1.00 0.00 H
ATOM 5357 HD2 ARG A 332 67.082 39.728 67.063 1.00 0.00 H
ATOM 5358 HD3 ARG A 332 67.918 39.719 68.552 1.00 0.00 H
ATOM 5359 HE ARG A 332 66.157 41.126 69.515 1.00 0.00 H
ATOM 5360 HH11 ARG A 332 65.176 40.244 66.196 1.00 0.00 H
ATOM 5361 HH12 ARG A 332 63.517 40.303 66.750 1.00 0.00 H
ATOM 5362 HH21 ARG A 332 64.056 41.020 69.822 1.00 0.00 H
ATOM 5363 HH22 ARG A 332 62.942 40.602 68.543 1.00 0.00 H
ATOM 5364 N GLY A 333 70.156 45.000 67.917 1.00 0.00 N
ATOM 5365 CA GLY A 333 70.065 46.030 66.958 1.00 0.00 C
ATOM 5366 C GLY A 333 71.362 46.728 66.601 1.00 0.00 C
ATOM 5367 O GLY A 333 71.367 47.484 65.615 1.00 0.00 O
ATOM 5368 H GLY A 333 69.944 45.256 68.871 1.00 0.00 H
ATOM 5369 HA2 GLY A 333 69.660 45.631 66.028 1.00 0.00 H
ATOM 5370 HA3 GLY A 333 69.261 46.681 67.302 1.00 0.00 H
ATOM 5371 N LEU A 334 72.491 46.427 67.303 1.00 0.00 N
ATOM 5372 CA LEU A 334 73.887 46.581 66.835 1.00 0.00 C
ATOM 5373 C LEU A 334 74.305 45.377 65.910 1.00 0.00 C
ATOM 5374 O LEU A 334 74.955 45.531 64.859 1.00 0.00 O
ATOM 5375 CB LEU A 334 74.854 46.656 68.028 1.00 0.00 C
ATOM 5376 CG LEU A 334 74.937 48.026 68.811 1.00 0.00 C
ATOM 5377 CD1 LEU A 334 76.254 48.073 69.555 1.00 0.00 C
ATOM 5378 CD2 LEU A 334 74.720 49.282 67.963 1.00 0.00 C
ATOM 5379 H LEU A 334 72.420 46.080 68.248 1.00 0.00 H
ATOM 5380 HA LEU A 334 73.948 47.424 66.147 1.00 0.00 H
ATOM 5381 HB2 LEU A 334 74.826 45.771 68.663 1.00 0.00 H
ATOM 5382 HB3 LEU A 334 75.779 46.589 67.456 1.00 0.00 H
ATOM 5383 HG LEU A 334 74.086 48.171 69.477 1.00 0.00 H
ATOM 5384 HD11 LEU A 334 76.476 49.017 70.052 1.00 0.00 H
ATOM 5385 HD12 LEU A 334 76.145 47.343 70.358 1.00 0.00 H
ATOM 5386 HD13 LEU A 334 77.073 47.905 68.856 1.00 0.00 H
ATOM 5387 HD21 LEU A 334 73.808 49.190 67.372 1.00 0.00 H
ATOM 5388 HD22 LEU A 334 74.589 50.151 68.607 1.00 0.00 H
ATOM 5389 HD23 LEU A 334 75.537 49.298 67.242 1.00 0.00 H
ATOM 5390 N GLU A 335 73.837 44.177 66.208 1.00 0.00 N
ATOM 5391 CA GLU A 335 74.125 43.063 65.279 1.00 0.00 C
ATOM 5392 C GLU A 335 73.372 43.195 63.903 1.00 0.00 C
ATOM 5393 O GLU A 335 73.882 42.915 62.828 1.00 0.00 O
ATOM 5394 CB GLU A 335 73.900 41.699 65.962 1.00 0.00 C
ATOM 5395 CG GLU A 335 74.249 40.486 65.131 1.00 0.00 C
ATOM 5396 CD GLU A 335 74.090 39.281 65.964 1.00 0.00 C
ATOM 5397 OE1 GLU A 335 73.744 38.282 65.377 1.00 0.00 O
ATOM 5398 OE2 GLU A 335 74.148 39.347 67.227 1.00 0.00 O1-
ATOM 5399 H GLU A 335 73.297 44.029 67.049 1.00 0.00 H
ATOM 5400 HA GLU A 335 75.192 43.104 65.060 1.00 0.00 H
ATOM 5401 HB2 GLU A 335 74.519 41.713 66.859 1.00 0.00 H
ATOM 5402 HB3 GLU A 335 72.832 41.701 66.183 1.00 0.00 H
ATOM 5403 HG2 GLU A 335 73.667 40.410 64.213 1.00 0.00 H
ATOM 5404 HG3 GLU A 335 75.320 40.515 64.929 1.00 0.00 H
ATOM 5405 N VAL A 336 72.151 43.700 63.933 1.00 0.00 N
ATOM 5406 CA VAL A 336 71.247 43.961 62.738 1.00 0.00 C
ATOM 5407 C VAL A 336 71.861 45.009 61.815 1.00 0.00 C
ATOM 5408 O VAL A 336 71.723 44.878 60.619 1.00 0.00 O
ATOM 5409 CB VAL A 336 69.793 44.289 63.180 1.00 0.00 C
ATOM 5410 CG1 VAL A 336 68.932 45.171 62.274 1.00 0.00 C
ATOM 5411 CG2 VAL A 336 69.050 42.972 63.538 1.00 0.00 C
ATOM 5412 H VAL A 336 71.733 43.801 64.847 1.00 0.00 H
ATOM 5413 HA VAL A 336 71.123 43.010 62.220 1.00 0.00 H
ATOM 5414 HB VAL A 336 69.954 44.917 64.056 1.00 0.00 H
ATOM 5415 HG11 VAL A 336 68.834 44.817 61.248 1.00 0.00 H
ATOM 5416 HG12 VAL A 336 67.889 45.258 62.578 1.00 0.00 H
ATOM 5417 HG13 VAL A 336 69.363 46.160 62.122 1.00 0.00 H
ATOM 5418 HG21 VAL A 336 69.677 42.437 64.251 1.00 0.00 H
ATOM 5419 HG22 VAL A 336 68.143 43.112 64.126 1.00 0.00 H
ATOM 5420 HG23 VAL A 336 68.783 42.355 62.679 1.00 0.00 H
ATOM 5421 N LEU A 337 72.637 45.965 62.357 1.00 0.00 N
ATOM 5422 CA LEU A 337 73.491 46.801 61.486 1.00 0.00 C
ATOM 5423 C LEU A 337 74.529 45.988 60.738 1.00 0.00 C
ATOM 5424 O LEU A 337 74.649 46.181 59.578 1.00 0.00 O
ATOM 5425 CB LEU A 337 74.061 47.977 62.264 1.00 0.00 C
ATOM 5426 CG LEU A 337 72.978 48.938 62.715 1.00 0.00 C
ATOM 5427 CD1 LEU A 337 73.795 49.986 63.616 1.00 0.00 C
ATOM 5428 CD2 LEU A 337 72.301 49.772 61.619 1.00 0.00 C
ATOM 5429 H LEU A 337 72.841 45.983 63.346 1.00 0.00 H
ATOM 5430 HA LEU A 337 72.836 47.261 60.746 1.00 0.00 H
ATOM 5431 HB2 LEU A 337 74.607 47.551 63.106 1.00 0.00 H
ATOM 5432 HB3 LEU A 337 74.875 48.443 61.710 1.00 0.00 H
ATOM 5433 HG LEU A 337 72.221 48.404 63.290 1.00 0.00 H
ATOM 5434 HD11 LEU A 337 73.282 50.946 63.687 1.00 0.00 H
ATOM 5435 HD12 LEU A 337 73.932 49.597 64.625 1.00 0.00 H
ATOM 5436 HD13 LEU A 337 74.809 50.134 63.247 1.00 0.00 H
ATOM 5437 HD21 LEU A 337 71.698 49.072 61.040 1.00 0.00 H
ATOM 5438 HD22 LEU A 337 71.683 50.451 62.207 1.00 0.00 H
ATOM 5439 HD23 LEU A 337 73.075 50.325 61.086 1.00 0.00 H
ATOM 5440 N ALA A 338 75.341 45.157 61.380 1.00 0.00 N
ATOM 5441 CA ALA A 338 76.338 44.300 60.689 1.00 0.00 C
ATOM 5442 C ALA A 338 75.657 43.405 59.619 1.00 0.00 C
ATOM 5443 O ALA A 338 76.298 43.101 58.629 1.00 0.00 O
ATOM 5444 CB ALA A 338 77.181 43.629 61.734 1.00 0.00 C
ATOM 5445 H ALA A 338 75.252 45.023 62.377 1.00 0.00 H
ATOM 5446 HA ALA A 338 77.004 44.947 60.118 1.00 0.00 H
ATOM 5447 HB1 ALA A 338 76.589 43.081 62.466 1.00 0.00 H
ATOM 5448 HB2 ALA A 338 77.782 42.857 61.253 1.00 0.00 H
ATOM 5449 HB3 ALA A 338 77.893 44.278 62.243 1.00 0.00 H
ATOM 5450 N GLN A 339 74.414 42.923 59.822 1.00 0.00 N
ATOM 5451 CA GLN A 339 73.744 41.930 59.015 1.00 0.00 C
ATOM 5452 C GLN A 339 73.082 42.524 57.751 1.00 0.00 C
ATOM 5453 O GLN A 339 73.078 41.943 56.704 1.00 0.00 O
ATOM 5454 CB GLN A 339 72.620 41.223 59.775 1.00 0.00 C
ATOM 5455 CG GLN A 339 73.164 40.073 60.634 1.00 0.00 C
ATOM 5456 CD GLN A 339 72.100 39.589 61.572 1.00 0.00 C
ATOM 5457 NE2 GLN A 339 71.667 40.570 62.396 1.00 0.00 N
ATOM 5458 OE1 GLN A 339 71.606 38.479 61.593 1.00 0.00 O
ATOM 5459 H GLN A 339 74.046 43.083 60.748 1.00 0.00 H
ATOM 5460 HA GLN A 339 74.434 41.167 58.653 1.00 0.00 H
ATOM 5461 HB2 GLN A 339 72.074 41.981 60.336 1.00 0.00 H
ATOM 5462 HB3 GLN A 339 71.970 40.833 58.991 1.00 0.00 H
ATOM 5463 HG2 GLN A 339 73.608 39.294 60.015 1.00 0.00 H
ATOM 5464 HG3 GLN A 339 73.998 40.352 61.277 1.00 0.00 H
ATOM 5465 HE21 GLN A 339 70.957 40.287 63.057 1.00 0.00 H
ATOM 5466 HE22 GLN A 339 72.304 41.342 62.528 1.00 0.00 H
ATOM 5467 N TYR A 340 72.574 43.771 57.916 1.00 0.00 N
ATOM 5468 CA TYR A 340 71.789 44.454 56.870 1.00 0.00 C
ATOM 5469 C TYR A 340 72.286 45.850 56.421 1.00 0.00 C
ATOM 5470 O TYR A 340 71.858 46.325 55.391 1.00 0.00 O
ATOM 5471 CB TYR A 340 70.426 44.472 57.404 1.00 0.00 C
ATOM 5472 CG TYR A 340 69.845 43.092 57.729 1.00 0.00 C
ATOM 5473 CD1 TYR A 340 69.739 42.153 56.651 1.00 0.00 C
ATOM 5474 CD2 TYR A 340 69.542 42.742 59.049 1.00 0.00 C
ATOM 5475 CE1 TYR A 340 69.161 40.904 56.929 1.00 0.00 C
ATOM 5476 CE2 TYR A 340 69.079 41.466 59.309 1.00 0.00 C
ATOM 5477 CZ TYR A 340 68.871 40.514 58.230 1.00 0.00 C
ATOM 5478 OH TYR A 340 68.458 39.245 58.491 1.00 0.00 O
ATOM 5479 H TYR A 340 72.791 44.312 58.740 1.00 0.00 H
ATOM 5480 HA TYR A 340 71.628 43.938 55.923 1.00 0.00 H
ATOM 5481 HB2 TYR A 340 70.416 45.090 58.302 1.00 0.00 H
ATOM 5482 HB3 TYR A 340 69.869 45.013 56.638 1.00 0.00 H
ATOM 5483 HD1 TYR A 340 69.948 42.507 55.652 1.00 0.00 H
ATOM 5484 HD2 TYR A 340 69.857 43.437 59.814 1.00 0.00 H
ATOM 5485 HE1 TYR A 340 69.025 40.206 56.116 1.00 0.00 H
ATOM 5486 HE2 TYR A 340 68.824 41.188 60.321 1.00 0.00 H
ATOM 5487 HH TYR A 340 68.598 39.044 59.420 1.00 0.00 H
ATOM 5488 N CYS A 341 73.159 46.518 57.181 1.00 0.00 N
ATOM 5489 CA CYS A 341 73.559 47.958 57.037 1.00 0.00 C
ATOM 5490 C CYS A 341 75.110 48.158 57.062 1.00 0.00 C
ATOM 5491 O CYS A 341 75.656 49.084 57.632 1.00 0.00 O
ATOM 5492 CB CYS A 341 72.776 48.877 58.045 1.00 0.00 C
ATOM 5493 SG CYS A 341 71.052 48.699 57.789 1.00 0.00 S
ATOM 5494 H CYS A 341 73.510 46.073 58.017 1.00 0.00 H
ATOM 5495 HA CYS A 341 73.263 48.235 56.026 1.00 0.00 H
ATOM 5496 HB2 CYS A 341 73.117 48.491 59.005 1.00 0.00 H
ATOM 5497 HB3 CYS A 341 73.016 49.930 57.892 1.00 0.00 H
ATOM 5498 HG CYS A 341 70.873 49.273 56.596 1.00 0.00 H
ATOM 5499 N LYS A 342 75.832 47.268 56.426 1.00 0.00 N
ATOM 5500 CA LYS A 342 77.354 47.311 56.439 1.00 0.00 C
ATOM 5501 C LYS A 342 77.948 48.669 55.956 1.00 0.00 C
ATOM 5502 O LYS A 342 79.054 48.979 56.325 1.00 0.00 O
ATOM 5503 CB LYS A 342 77.992 46.184 55.547 1.00 0.00 C
ATOM 5504 CG LYS A 342 77.670 44.784 56.051 1.00 0.00 C
ATOM 5505 CD LYS A 342 78.241 43.784 55.095 1.00 0.00 C
ATOM 5506 CE LYS A 342 77.491 42.527 55.432 1.00 0.00 C
ATOM 5507 NZ LYS A 342 77.766 41.556 54.385 1.00 0.00 N1+
ATOM 5508 H LYS A 342 75.352 46.645 55.792 1.00 0.00 H
ATOM 5509 HA LYS A 342 77.740 47.157 57.447 1.00 0.00 H
ATOM 5510 HB2 LYS A 342 77.654 46.328 54.521 1.00 0.00 H
ATOM 5511 HB3 LYS A 342 79.076 46.297 55.517 1.00 0.00 H
ATOM 5512 HG2 LYS A 342 78.030 44.624 57.067 1.00 0.00 H
ATOM 5513 HG3 LYS A 342 76.586 44.662 56.062 1.00 0.00 H
ATOM 5514 HD2 LYS A 342 77.954 44.011 54.068 1.00 0.00 H
ATOM 5515 HD3 LYS A 342 79.303 43.576 55.223 1.00 0.00 H
ATOM 5516 HE2 LYS A 342 77.865 42.198 56.402 1.00 0.00 H
ATOM 5517 HE3 LYS A 342 76.426 42.744 55.517 1.00 0.00 H
ATOM 5518 HZ1 LYS A 342 77.424 40.638 54.632 1.00 0.00 H
ATOM 5519 HZ2 LYS A 342 77.604 41.869 53.439 1.00 0.00 H
ATOM 5520 HZ3 LYS A 342 78.768 41.433 54.375 1.00 0.00 H
ATOM 5521 N GLN A 343 77.236 49.498 55.204 1.00 0.00 N
ATOM 5522 CA GLN A 343 77.683 50.800 54.634 1.00 0.00 C
ATOM 5523 C GLN A 343 77.450 51.999 55.641 1.00 0.00 C
ATOM 5524 O GLN A 343 77.481 53.148 55.234 1.00 0.00 O
ATOM 5525 CB GLN A 343 76.894 51.004 53.343 1.00 0.00 C
ATOM 5526 CG GLN A 343 75.401 51.467 53.463 1.00 0.00 C
ATOM 5527 CD GLN A 343 74.511 50.331 54.064 1.00 0.00 C
ATOM 5528 NE2 GLN A 343 73.708 50.602 55.056 1.00 0.00 N
ATOM 5529 OE1 GLN A 343 74.690 49.201 53.649 1.00 0.00 O
ATOM 5530 H GLN A 343 76.299 49.121 55.171 1.00 0.00 H
ATOM 5531 HA GLN A 343 78.760 50.825 54.468 1.00 0.00 H
ATOM 5532 HB2 GLN A 343 77.308 51.725 52.638 1.00 0.00 H
ATOM 5533 HB3 GLN A 343 76.941 50.086 52.757 1.00 0.00 H
ATOM 5534 HG2 GLN A 343 75.248 52.431 53.949 1.00 0.00 H
ATOM 5535 HG3 GLN A 343 75.085 51.744 52.457 1.00 0.00 H
ATOM 5536 HE21 GLN A 343 72.913 49.978 55.062 1.00 0.00 H
ATOM 5537 HE22 GLN A 343 73.659 51.586 55.277 1.00 0.00 H
ATOM 5538 N LEU A 344 77.073 51.756 56.859 1.00 0.00 N
ATOM 5539 CA LEU A 344 76.879 52.807 57.871 1.00 0.00 C
ATOM 5540 C LEU A 344 78.170 53.699 58.117 1.00 0.00 C
ATOM 5541 O LEU A 344 79.194 53.183 58.557 1.00 0.00 O
ATOM 5542 CB LEU A 344 76.287 52.201 59.195 1.00 0.00 C
ATOM 5543 CG LEU A 344 75.651 53.312 60.132 1.00 0.00 C
ATOM 5544 CD1 LEU A 344 74.332 53.887 59.548 1.00 0.00 C
ATOM 5545 CD2 LEU A 344 75.313 52.705 61.435 1.00 0.00 C
ATOM 5546 H LEU A 344 77.210 50.824 57.221 1.00 0.00 H
ATOM 5547 HA LEU A 344 76.210 53.574 57.480 1.00 0.00 H
ATOM 5548 HB2 LEU A 344 75.472 51.542 58.898 1.00 0.00 H
ATOM 5549 HB3 LEU A 344 77.064 51.626 59.700 1.00 0.00 H
ATOM 5550 HG LEU A 344 76.290 54.190 60.229 1.00 0.00 H
ATOM 5551 HD11 LEU A 344 73.692 53.093 59.163 1.00 0.00 H
ATOM 5552 HD12 LEU A 344 73.785 54.548 60.221 1.00 0.00 H
ATOM 5553 HD13 LEU A 344 74.604 54.448 58.654 1.00 0.00 H
ATOM 5554 HD21 LEU A 344 76.131 52.165 61.912 1.00 0.00 H
ATOM 5555 HD22 LEU A 344 74.871 53.513 62.019 1.00 0.00 H
ATOM 5556 HD23 LEU A 344 74.462 52.031 61.336 1.00 0.00 H
ATOM 5557 N LYS A 345 78.139 55.011 57.803 1.00 0.00 N
ATOM 5558 CA LYS A 345 79.102 56.014 58.074 1.00 0.00 C
ATOM 5559 C LYS A 345 78.972 56.473 59.524 1.00 0.00 C
ATOM 5560 O LYS A 345 79.976 56.773 60.108 1.00 0.00 O
ATOM 5561 CB LYS A 345 78.869 57.242 57.173 1.00 0.00 C
ATOM 5562 CG LYS A 345 78.969 56.883 55.690 1.00 0.00 C
ATOM 5563 CD LYS A 345 78.890 58.161 54.908 1.00 0.00 C
ATOM 5564 CE LYS A 345 79.408 57.878 53.438 1.00 0.00 C
ATOM 5565 NZ LYS A 345 80.815 57.464 53.374 1.00 0.00 N1+
ATOM 5566 H LYS A 345 77.225 55.293 57.479 1.00 0.00 H
ATOM 5567 HA LYS A 345 80.100 55.579 58.021 1.00 0.00 H
ATOM 5568 HB2 LYS A 345 77.856 57.630 57.284 1.00 0.00 H
ATOM 5569 HB3 LYS A 345 79.638 57.970 57.428 1.00 0.00 H
ATOM 5570 HG2 LYS A 345 79.849 56.311 55.394 1.00 0.00 H
ATOM 5571 HG3 LYS A 345 78.089 56.306 55.408 1.00 0.00 H
ATOM 5572 HD2 LYS A 345 77.875 58.550 54.816 1.00 0.00 H
ATOM 5573 HD3 LYS A 345 79.659 58.830 55.294 1.00 0.00 H
ATOM 5574 HE2 LYS A 345 78.790 57.171 52.883 1.00 0.00 H
ATOM 5575 HE3 LYS A 345 79.308 58.858 52.971 1.00 0.00 H
ATOM 5576 HZ1 LYS A 345 81.211 57.366 52.450 1.00 0.00 H
ATOM 5577 HZ2 LYS A 345 81.442 58.095 53.853 1.00 0.00 H
ATOM 5578 HZ3 LYS A 345 81.015 56.615 53.884 1.00 0.00 H
ATOM 5579 N ARG A 346 77.787 56.668 60.068 1.00 0.00 N
ATOM 5580 CA ARG A 346 77.529 57.336 61.361 1.00 0.00 C
ATOM 5581 C ARG A 346 76.587 56.717 62.338 1.00 0.00 C
ATOM 5582 O ARG A 346 75.592 56.093 61.894 1.00 0.00 O
ATOM 5583 CB ARG A 346 77.244 58.831 61.229 1.00 0.00 C
ATOM 5584 CG ARG A 346 78.268 59.758 60.481 1.00 0.00 C
ATOM 5585 CD ARG A 346 78.165 61.275 60.816 1.00 0.00 C
ATOM 5586 NE ARG A 346 79.459 61.862 60.877 1.00 0.00 N
ATOM 5587 CZ ARG A 346 79.917 62.936 61.464 1.00 0.00 C
ATOM 5588 NH1 ARG A 346 79.061 63.777 61.961 1.00 0.00 N1+
ATOM 5589 NH2 ARG A 346 81.174 63.079 61.862 1.00 0.00 N
ATOM 5590 H ARG A 346 77.006 56.253 59.580 1.00 0.00 H
ATOM 5591 HA ARG A 346 78.456 57.243 61.927 1.00 0.00 H
ATOM 5592 HB2 ARG A 346 76.220 59.015 60.906 1.00 0.00 H
ATOM 5593 HB3 ARG A 346 77.341 59.292 62.211 1.00 0.00 H
ATOM 5594 HG2 ARG A 346 79.309 59.486 60.653 1.00 0.00 H
ATOM 5595 HG3 ARG A 346 78.063 59.660 59.415 1.00 0.00 H
ATOM 5596 HD2 ARG A 346 77.611 61.708 59.982 1.00 0.00 H
ATOM 5597 HD3 ARG A 346 77.576 61.489 61.707 1.00 0.00 H
ATOM 5598 HE ARG A 346 80.142 61.280 60.413 1.00 0.00 H
ATOM 5599 HH11 ARG A 346 78.146 63.653 61.552 1.00 0.00 H
ATOM 5600 HH12 ARG A 346 79.372 64.726 62.112 1.00 0.00 H
ATOM 5601 HH21 ARG A 346 81.889 62.461 61.505 1.00 0.00 H
ATOM 5602 HH22 ARG A 346 81.481 64.003 62.129 1.00 0.00 H
ATOM 5603 N LEU A 347 76.770 56.850 63.640 1.00 0.00 N
ATOM 5604 CA LEU A 347 75.899 56.279 64.636 1.00 0.00 C
ATOM 5605 C LEU A 347 75.891 57.121 65.862 1.00 0.00 C
ATOM 5606 O LEU A 347 76.883 57.244 66.575 1.00 0.00 O
ATOM 5607 CB LEU A 347 76.213 54.754 64.893 1.00 0.00 C
ATOM 5608 CG LEU A 347 75.349 54.114 66.047 1.00 0.00 C
ATOM 5609 CD1 LEU A 347 73.903 53.977 65.450 1.00 0.00 C
ATOM 5610 CD2 LEU A 347 75.853 52.765 66.419 1.00 0.00 C
ATOM 5611 H LEU A 347 77.592 57.355 63.940 1.00 0.00 H
ATOM 5612 HA LEU A 347 74.861 56.270 64.302 1.00 0.00 H
ATOM 5613 HB2 LEU A 347 76.192 54.239 63.932 1.00 0.00 H
ATOM 5614 HB3 LEU A 347 77.267 54.728 65.168 1.00 0.00 H
ATOM 5615 HG LEU A 347 75.392 54.749 66.931 1.00 0.00 H
ATOM 5616 HD11 LEU A 347 73.743 53.323 64.592 1.00 0.00 H
ATOM 5617 HD12 LEU A 347 73.220 53.579 66.201 1.00 0.00 H
ATOM 5618 HD13 LEU A 347 73.522 54.984 65.282 1.00 0.00 H
ATOM 5619 HD21 LEU A 347 75.808 52.176 65.503 1.00 0.00 H
ATOM 5620 HD22 LEU A 347 76.904 52.901 66.674 1.00 0.00 H
ATOM 5621 HD23 LEU A 347 75.274 52.303 67.219 1.00 0.00 H
ATOM 5622 N ARG A 348 74.821 57.707 66.290 1.00 0.00 N
ATOM 5623 CA ARG A 348 74.615 58.295 67.586 1.00 0.00 C
ATOM 5624 C ARG A 348 73.669 57.444 68.464 1.00 0.00 C
ATOM 5625 O ARG A 348 72.839 56.784 67.934 1.00 0.00 O
ATOM 5626 CB ARG A 348 74.008 59.738 67.359 1.00 0.00 C
ATOM 5627 CG ARG A 348 75.261 60.648 67.278 1.00 0.00 C
ATOM 5628 CD ARG A 348 74.952 62.165 66.975 1.00 0.00 C
ATOM 5629 NE ARG A 348 73.875 62.562 67.881 1.00 0.00 N
ATOM 5630 CZ ARG A 348 73.679 62.691 69.177 1.00 0.00 C
ATOM 5631 NH1 ARG A 348 74.677 62.734 70.065 1.00 0.00 N1+
ATOM 5632 NH2 ARG A 348 72.416 62.800 69.630 1.00 0.00 N
ATOM 5633 H ARG A 348 74.009 57.619 65.697 1.00 0.00 H
ATOM 5634 HA ARG A 348 75.530 58.326 68.176 1.00 0.00 H
ATOM 5635 HB2 ARG A 348 73.377 59.846 66.477 1.00 0.00 H
ATOM 5636 HB3 ARG A 348 73.425 59.939 68.258 1.00 0.00 H
ATOM 5637 HG2 ARG A 348 75.807 60.552 68.216 1.00 0.00 H
ATOM 5638 HG3 ARG A 348 75.859 60.206 66.481 1.00 0.00 H
ATOM 5639 HD2 ARG A 348 75.767 62.887 66.937 1.00 0.00 H
ATOM 5640 HD3 ARG A 348 74.617 61.955 65.959 1.00 0.00 H
ATOM 5641 HE ARG A 348 73.067 62.689 67.288 1.00 0.00 H
ATOM 5642 HH11 ARG A 348 75.622 62.493 69.803 1.00 0.00 H
ATOM 5643 HH12 ARG A 348 74.493 62.781 71.058 1.00 0.00 H
ATOM 5644 HH21 ARG A 348 71.616 62.884 69.019 1.00 0.00 H
ATOM 5645 HH22 ARG A 348 72.420 63.194 70.560 1.00 0.00 H
ATOM 5646 N ILE A 349 73.826 57.517 69.742 1.00 0.00 N
ATOM 5647 CA ILE A 349 72.882 56.830 70.652 1.00 0.00 C
ATOM 5648 C ILE A 349 72.526 57.839 71.851 1.00 0.00 C
ATOM 5649 O ILE A 349 73.479 58.573 72.232 1.00 0.00 O
ATOM 5650 CB ILE A 349 73.464 55.470 71.194 1.00 0.00 C
ATOM 5651 CG1 ILE A 349 73.598 54.464 69.983 1.00 0.00 C
ATOM 5652 CG2 ILE A 349 72.635 54.878 72.360 1.00 0.00 C
ATOM 5653 CD1 ILE A 349 74.110 53.086 70.434 1.00 0.00 C
ATOM 5654 H ILE A 349 74.650 57.997 70.073 1.00 0.00 H
ATOM 5655 HA ILE A 349 71.936 56.652 70.142 1.00 0.00 H
ATOM 5656 HB ILE A 349 74.444 55.613 71.651 1.00 0.00 H
ATOM 5657 HG12 ILE A 349 72.604 54.345 69.554 1.00 0.00 H
ATOM 5658 HG13 ILE A 349 74.400 54.772 69.313 1.00 0.00 H
ATOM 5659 HG21 ILE A 349 72.631 55.682 73.096 1.00 0.00 H
ATOM 5660 HG22 ILE A 349 71.647 54.715 71.930 1.00 0.00 H
ATOM 5661 HG23 ILE A 349 73.026 53.943 72.761 1.00 0.00 H
ATOM 5662 HD11 ILE A 349 73.339 52.487 70.919 1.00 0.00 H
ATOM 5663 HD12 ILE A 349 74.505 52.510 69.598 1.00 0.00 H
ATOM 5664 HD13 ILE A 349 74.997 53.233 71.049 1.00 0.00 H
ATOM 5665 N GLU A 350 71.301 57.781 72.413 1.00 0.00 N
ATOM 5666 CA GLU A 350 70.869 58.593 73.581 1.00 0.00 C
ATOM 5667 C GLU A 350 70.376 57.598 74.669 1.00 0.00 C
ATOM 5668 O GLU A 350 70.225 56.418 74.483 1.00 0.00 O
ATOM 5669 CB GLU A 350 69.782 59.567 73.091 1.00 0.00 C
ATOM 5670 CG GLU A 350 70.184 60.684 72.001 1.00 0.00 C
ATOM 5671 CD GLU A 350 70.997 61.798 72.651 1.00 0.00 C
ATOM 5672 OE1 GLU A 350 71.637 61.529 73.671 1.00 0.00 O
ATOM 5673 OE2 GLU A 350 71.014 62.958 72.122 1.00 0.00 O1-
ATOM 5674 H GLU A 350 70.621 57.195 71.950 1.00 0.00 H
ATOM 5675 HA GLU A 350 71.698 59.182 73.973 1.00 0.00 H
ATOM 5676 HB2 GLU A 350 69.066 58.867 72.659 1.00 0.00 H
ATOM 5677 HB3 GLU A 350 69.328 60.128 73.908 1.00 0.00 H
ATOM 5678 HG2 GLU A 350 70.737 60.122 71.248 1.00 0.00 H
ATOM 5679 HG3 GLU A 350 69.359 61.034 71.381 1.00 0.00 H
ATOM 5680 N ARG A 351 70.170 58.111 75.857 1.00 0.00 N
ATOM 5681 CA ARG A 351 69.387 57.409 76.949 1.00 0.00 C
ATOM 5682 C ARG A 351 67.996 56.887 76.593 1.00 0.00 C
ATOM 5683 O ARG A 351 67.251 57.558 75.831 1.00 0.00 O
ATOM 5684 CB ARG A 351 69.301 58.367 78.146 1.00 0.00 C
ATOM 5685 CG ARG A 351 69.252 57.668 79.519 1.00 0.00 C
ATOM 5686 CD ARG A 351 68.897 58.612 80.650 1.00 0.00 C
ATOM 5687 NE ARG A 351 68.833 57.839 82.005 1.00 0.00 N
ATOM 5688 CZ ARG A 351 69.673 57.823 82.971 1.00 0.00 C
ATOM 5689 NH1 ARG A 351 70.559 58.770 83.255 1.00 0.00 N1+
ATOM 5690 NH2 ARG A 351 69.597 56.817 83.716 1.00 0.00 N
ATOM 5691 H ARG A 351 70.355 59.090 76.023 1.00 0.00 H
ATOM 5692 HA ARG A 351 69.990 56.556 77.261 1.00 0.00 H
ATOM 5693 HB2 ARG A 351 70.191 58.995 78.178 1.00 0.00 H
ATOM 5694 HB3 ARG A 351 68.478 59.040 77.905 1.00 0.00 H
ATOM 5695 HG2 ARG A 351 68.424 56.967 79.414 1.00 0.00 H
ATOM 5696 HG3 ARG A 351 70.222 57.206 79.699 1.00 0.00 H
ATOM 5697 HD2 ARG A 351 69.695 59.354 80.707 1.00 0.00 H
ATOM 5698 HD3 ARG A 351 67.951 59.094 80.404 1.00 0.00 H
ATOM 5699 HE ARG A 351 68.122 57.139 82.159 1.00 0.00 H
ATOM 5700 HH11 ARG A 351 70.610 59.553 82.619 1.00 0.00 H
ATOM 5701 HH12 ARG A 351 71.272 58.454 83.898 1.00 0.00 H
ATOM 5702 HH21 ARG A 351 68.877 56.127 83.552 1.00 0.00 H
ATOM 5703 HH22 ARG A 351 70.280 56.644 84.439 1.00 0.00 H
ATOM 5704 N GLY A 352 67.645 55.823 77.159 1.00 0.00 N
ATOM 5705 CA GLY A 352 66.241 55.300 77.175 1.00 0.00 C
ATOM 5706 C GLY A 352 65.393 55.901 78.236 1.00 0.00 C
ATOM 5707 O GLY A 352 65.875 56.648 79.053 1.00 0.00 O
ATOM 5708 H GLY A 352 68.290 55.464 77.849 1.00 0.00 H
ATOM 5709 HA2 GLY A 352 65.759 55.496 76.217 1.00 0.00 H
ATOM 5710 HA3 GLY A 352 66.181 54.219 77.300 1.00 0.00 H
ATOM 5711 N ALA A 353 64.091 55.741 78.142 1.00 0.00 N
ATOM 5712 CA ALA A 353 63.183 56.049 79.292 1.00 0.00 C
ATOM 5713 C ALA A 353 63.387 54.916 80.317 1.00 0.00 C
ATOM 5714 O ALA A 353 63.215 53.719 79.928 1.00 0.00 O
ATOM 5715 CB ALA A 353 61.802 56.158 78.682 1.00 0.00 C
ATOM 5716 H ALA A 353 63.798 55.011 77.509 1.00 0.00 H
ATOM 5717 HA ALA A 353 63.476 56.960 79.816 1.00 0.00 H
ATOM 5718 HB1 ALA A 353 61.379 55.173 78.485 1.00 0.00 H
ATOM 5719 HB2 ALA A 353 61.189 56.713 79.392 1.00 0.00 H
ATOM 5720 HB3 ALA A 353 61.831 56.705 77.740 1.00 0.00 H
ATOM 5721 N ASP A 354 63.834 55.289 81.498 1.00 0.00 N
ATOM 5722 CA ASP A 354 64.380 54.385 82.509 1.00 0.00 C
ATOM 5723 C ASP A 354 63.986 54.618 83.932 1.00 0.00 C
ATOM 5724 O ASP A 354 64.549 53.990 84.800 1.00 0.00 O
ATOM 5725 CB ASP A 354 65.854 54.089 82.156 1.00 0.00 C
ATOM 5726 CG ASP A 354 66.845 55.210 82.431 1.00 0.00 C
ATOM 5727 OD1 ASP A 354 66.454 56.371 82.700 1.00 0.00 O
ATOM 5728 OD2 ASP A 354 68.039 54.960 82.221 1.00 0.00 O1-
ATOM 5729 H ASP A 354 63.939 56.289 81.591 1.00 0.00 H
ATOM 5730 HA ASP A 354 63.957 53.421 82.226 1.00 0.00 H
ATOM 5731 HB2 ASP A 354 66.210 53.154 82.591 1.00 0.00 H
ATOM 5732 HB3 ASP A 354 65.862 53.969 81.073 1.00 0.00 H
ATOM 5733 N GLU A 355 63.036 55.458 84.297 1.00 0.00 N
ATOM 5734 CA GLU A 355 62.602 55.799 85.655 1.00 0.00 C
ATOM 5735 C GLU A 355 62.040 54.560 86.378 1.00 0.00 C
ATOM 5736 O GLU A 355 62.284 54.402 87.535 1.00 0.00 O
ATOM 5737 CB GLU A 355 61.449 56.878 85.656 1.00 0.00 C
ATOM 5738 CG GLU A 355 60.822 57.193 86.984 1.00 0.00 C
ATOM 5739 CD GLU A 355 60.006 58.502 86.789 1.00 0.00 C
ATOM 5740 OE1 GLU A 355 60.628 59.631 86.693 1.00 0.00 O
ATOM 5741 OE2 GLU A 355 58.793 58.439 86.793 1.00 0.00 O1-
ATOM 5742 H GLU A 355 62.486 55.895 83.572 1.00 0.00 H
ATOM 5743 HA GLU A 355 63.472 56.207 86.170 1.00 0.00 H
ATOM 5744 HB2 GLU A 355 61.854 57.721 85.096 1.00 0.00 H
ATOM 5745 HB3 GLU A 355 60.627 56.503 85.047 1.00 0.00 H
ATOM 5746 HG2 GLU A 355 60.174 56.380 87.311 1.00 0.00 H
ATOM 5747 HG3 GLU A 355 61.530 57.425 87.780 1.00 0.00 H
ATOM 5748 N GLN A 356 61.267 53.719 85.707 1.00 0.00 N
ATOM 5749 CA GLN A 356 60.821 52.427 86.187 1.00 0.00 C
ATOM 5750 C GLN A 356 61.662 51.216 85.631 1.00 0.00 C
ATOM 5751 O GLN A 356 61.202 50.132 85.305 1.00 0.00 O
ATOM 5752 CB GLN A 356 59.306 52.234 86.001 1.00 0.00 C
ATOM 5753 CG GLN A 356 58.332 53.339 86.444 1.00 0.00 C
ATOM 5754 CD GLN A 356 56.905 52.873 86.542 1.00 0.00 C
ATOM 5755 NE2 GLN A 356 56.054 53.536 87.235 1.00 0.00 N
ATOM 5756 OE1 GLN A 356 56.419 51.934 85.932 1.00 0.00 O
ATOM 5757 H GLN A 356 61.036 54.042 84.778 1.00 0.00 H
ATOM 5758 HA GLN A 356 60.908 52.430 87.274 1.00 0.00 H
ATOM 5759 HB2 GLN A 356 59.036 51.885 85.004 1.00 0.00 H
ATOM 5760 HB3 GLN A 356 59.243 51.315 86.583 1.00 0.00 H
ATOM 5761 HG2 GLN A 356 58.624 53.721 87.423 1.00 0.00 H
ATOM 5762 HG3 GLN A 356 58.373 54.150 85.717 1.00 0.00 H
ATOM 5763 HE21 GLN A 356 55.067 53.324 87.191 1.00 0.00 H
ATOM 5764 HE22 GLN A 356 56.385 54.360 87.716 1.00 0.00 H
ATOM 5765 N GLY A 357 62.961 51.463 85.403 1.00 0.00 N
ATOM 5766 CA GLY A 357 63.814 50.448 84.661 1.00 0.00 C
ATOM 5767 C GLY A 357 63.519 50.590 83.160 1.00 0.00 C
ATOM 5768 O GLY A 357 62.793 51.525 82.724 1.00 0.00 O
ATOM 5769 H GLY A 357 63.319 52.404 85.490 1.00 0.00 H
ATOM 5770 HA2 GLY A 357 64.885 50.609 84.785 1.00 0.00 H
ATOM 5771 HA3 GLY A 357 63.579 49.478 85.097 1.00 0.00 H
ATOM 5772 N MET A 358 64.118 49.717 82.326 1.00 0.00 N
ATOM 5773 CA MET A 358 64.189 49.863 80.928 1.00 0.00 C
ATOM 5774 C MET A 358 62.877 49.820 80.098 1.00 0.00 C
ATOM 5775 O MET A 358 61.871 49.246 80.512 1.00 0.00 O
ATOM 5776 CB MET A 358 65.188 48.916 80.403 1.00 0.00 C
ATOM 5777 CG MET A 358 65.561 49.014 78.928 1.00 0.00 C
ATOM 5778 SD MET A 358 66.281 50.644 78.354 1.00 0.00 S
ATOM 5779 CE MET A 358 67.645 49.946 77.383 1.00 0.00 C
ATOM 5780 H MET A 358 64.573 48.928 82.763 1.00 0.00 H
ATOM 5781 HA MET A 358 64.637 50.831 80.706 1.00 0.00 H
ATOM 5782 HB2 MET A 358 66.125 49.020 80.950 1.00 0.00 H
ATOM 5783 HB3 MET A 358 64.847 47.905 80.628 1.00 0.00 H
ATOM 5784 HG2 MET A 358 66.236 48.175 78.758 1.00 0.00 H
ATOM 5785 HG3 MET A 358 64.727 48.708 78.297 1.00 0.00 H
ATOM 5786 HE1 MET A 358 68.365 49.345 77.938 1.00 0.00 H
ATOM 5787 HE2 MET A 358 67.251 49.410 76.520 1.00 0.00 H
ATOM 5788 HE3 MET A 358 68.256 50.702 76.889 1.00 0.00 H
ATOM 5789 N GLU A 359 62.878 50.431 78.883 1.00 0.00 N
ATOM 5790 CA GLU A 359 61.755 50.336 77.955 1.00 0.00 C
ATOM 5791 C GLU A 359 61.361 48.924 77.493 1.00 0.00 C
ATOM 5792 O GLU A 359 60.217 48.716 77.069 1.00 0.00 O
ATOM 5793 CB GLU A 359 62.051 51.075 76.660 1.00 0.00 C
ATOM 5794 CG GLU A 359 62.385 52.560 76.901 1.00 0.00 C
ATOM 5795 CD GLU A 359 62.617 53.304 75.586 1.00 0.00 C
ATOM 5796 OE1 GLU A 359 61.907 53.037 74.587 1.00 0.00 O
ATOM 5797 OE2 GLU A 359 63.560 54.130 75.532 1.00 0.00 O1-
ATOM 5798 H GLU A 359 63.649 51.024 78.614 1.00 0.00 H
ATOM 5799 HA GLU A 359 60.852 50.819 78.331 1.00 0.00 H
ATOM 5800 HB2 GLU A 359 62.886 50.564 76.181 1.00 0.00 H
ATOM 5801 HB3 GLU A 359 61.103 51.167 76.129 1.00 0.00 H
ATOM 5802 HG2 GLU A 359 61.588 53.008 77.494 1.00 0.00 H
ATOM 5803 HG3 GLU A 359 63.202 52.671 77.614 1.00 0.00 H
ATOM 5804 N ASP A 360 62.286 47.957 77.441 1.00 0.00 N
ATOM 5805 CA ASP A 360 62.162 46.562 76.794 1.00 0.00 C
ATOM 5806 C ASP A 360 63.298 45.643 77.328 1.00 0.00 C
ATOM 5807 O ASP A 360 64.485 46.035 77.467 1.00 0.00 O
ATOM 5808 CB ASP A 360 62.320 46.784 75.275 1.00 0.00 C
ATOM 5809 CG ASP A 360 62.264 45.502 74.452 1.00 0.00 C
ATOM 5810 OD1 ASP A 360 62.489 45.569 73.202 1.00 0.00 O
ATOM 5811 OD2 ASP A 360 62.141 44.427 75.063 1.00 0.00 O1-
ATOM 5812 H ASP A 360 63.219 48.239 77.704 1.00 0.00 H
ATOM 5813 HA ASP A 360 61.206 46.128 77.089 1.00 0.00 H
ATOM 5814 HB2 ASP A 360 61.539 47.430 74.873 1.00 0.00 H
ATOM 5815 HB3 ASP A 360 63.221 47.339 75.015 1.00 0.00 H
ATOM 5816 N GLU A 361 62.897 44.384 77.699 1.00 0.00 N
ATOM 5817 CA GLU A 361 63.632 43.446 78.469 1.00 0.00 C
ATOM 5818 C GLU A 361 64.897 42.953 77.733 1.00 0.00 C
ATOM 5819 O GLU A 361 65.775 42.505 78.473 1.00 0.00 O
ATOM 5820 CB GLU A 361 62.640 42.342 78.794 1.00 0.00 C
ATOM 5821 CG GLU A 361 63.046 41.195 79.658 1.00 0.00 C
ATOM 5822 CD GLU A 361 63.031 41.298 81.118 1.00 0.00 C
ATOM 5823 OE1 GLU A 361 63.069 40.202 81.822 1.00 0.00 O
ATOM 5824 OE2 GLU A 361 62.844 42.502 81.581 1.00 0.00 O1-
ATOM 5825 H GLU A 361 61.969 44.086 77.435 1.00 0.00 H
ATOM 5826 HA GLU A 361 63.970 43.901 79.400 1.00 0.00 H
ATOM 5827 HB2 GLU A 361 61.719 42.798 79.156 1.00 0.00 H
ATOM 5828 HB3 GLU A 361 62.534 41.952 77.782 1.00 0.00 H
ATOM 5829 HG2 GLU A 361 62.463 40.339 79.319 1.00 0.00 H
ATOM 5830 HG3 GLU A 361 64.099 40.953 79.513 1.00 0.00 H
ATOM 5831 N GLU A 362 64.996 43.075 76.449 1.00 0.00 N
ATOM 5832 CA GLU A 362 66.114 42.701 75.514 1.00 0.00 C
ATOM 5833 C GLU A 362 66.941 43.893 74.999 1.00 0.00 C
ATOM 5834 O GLU A 362 68.043 43.739 74.465 1.00 0.00 O
ATOM 5835 CB GLU A 362 65.655 41.846 74.365 1.00 0.00 C
ATOM 5836 CG GLU A 362 64.961 42.736 73.237 1.00 0.00 C
ATOM 5837 CD GLU A 362 64.350 41.787 72.195 1.00 0.00 C
ATOM 5838 OE1 GLU A 362 63.089 41.621 72.098 1.00 0.00 O
ATOM 5839 OE2 GLU A 362 65.192 41.247 71.416 1.00 0.00 O1-
ATOM 5840 H GLU A 362 64.117 43.358 76.039 1.00 0.00 H
ATOM 5841 HA GLU A 362 66.865 42.081 76.005 1.00 0.00 H
ATOM 5842 HB2 GLU A 362 66.580 41.385 74.018 1.00 0.00 H
ATOM 5843 HB3 GLU A 362 64.925 41.094 74.664 1.00 0.00 H
ATOM 5844 HG2 GLU A 362 64.158 43.359 73.632 1.00 0.00 H
ATOM 5845 HG3 GLU A 362 65.683 43.321 72.667 1.00 0.00 H
ATOM 5846 N GLY A 363 66.454 45.094 75.265 1.00 0.00 N
ATOM 5847 CA GLY A 363 66.969 46.389 74.809 1.00 0.00 C
ATOM 5848 C GLY A 363 68.336 46.780 75.379 1.00 0.00 C
ATOM 5849 O GLY A 363 68.725 47.904 75.104 1.00 0.00 O
ATOM 5850 H GLY A 363 65.529 45.183 75.661 1.00 0.00 H
ATOM 5851 HA2 GLY A 363 67.050 46.418 73.723 1.00 0.00 H
ATOM 5852 HA3 GLY A 363 66.234 47.113 75.162 1.00 0.00 H
ATOM 5853 N LEU A 364 69.001 45.982 76.237 1.00 0.00 N
ATOM 5854 CA LEU A 364 70.250 46.346 76.926 1.00 0.00 C
ATOM 5855 C LEU A 364 71.343 46.137 75.840 1.00 0.00 C
ATOM 5856 O LEU A 364 71.485 45.044 75.211 1.00 0.00 O
ATOM 5857 CB LEU A 364 70.637 45.522 78.226 1.00 0.00 C
ATOM 5858 CG LEU A 364 71.741 46.121 79.084 1.00 0.00 C
ATOM 5859 CD1 LEU A 364 71.554 45.796 80.567 1.00 0.00 C
ATOM 5860 CD2 LEU A 364 73.116 45.565 78.820 1.00 0.00 C
ATOM 5861 H LEU A 364 68.746 45.006 76.287 1.00 0.00 H
ATOM 5862 HA LEU A 364 70.239 47.394 77.225 1.00 0.00 H
ATOM 5863 HB2 LEU A 364 69.715 45.363 78.787 1.00 0.00 H
ATOM 5864 HB3 LEU A 364 70.863 44.525 77.848 1.00 0.00 H
ATOM 5865 HG LEU A 364 71.709 47.206 78.985 1.00 0.00 H
ATOM 5866 HD11 LEU A 364 71.726 46.723 81.113 1.00 0.00 H
ATOM 5867 HD12 LEU A 364 70.519 45.497 80.736 1.00 0.00 H
ATOM 5868 HD13 LEU A 364 72.161 44.962 80.918 1.00 0.00 H
ATOM 5869 HD21 LEU A 364 72.997 44.506 79.050 1.00 0.00 H
ATOM 5870 HD22 LEU A 364 73.296 45.589 77.745 1.00 0.00 H
ATOM 5871 HD23 LEU A 364 73.919 45.963 79.440 1.00 0.00 H
ATOM 5872 N VAL A 365 72.086 47.209 75.515 1.00 0.00 N
ATOM 5873 CA VAL A 365 73.123 47.171 74.488 1.00 0.00 C
ATOM 5874 C VAL A 365 74.431 46.979 75.341 1.00 0.00 C
ATOM 5875 O VAL A 365 74.683 47.654 76.348 1.00 0.00 O
ATOM 5876 CB VAL A 365 73.113 48.419 73.528 1.00 0.00 C
ATOM 5877 CG1 VAL A 365 73.453 49.713 74.289 1.00 0.00 C
ATOM 5878 CG2 VAL A 365 74.105 48.146 72.447 1.00 0.00 C
ATOM 5879 H VAL A 365 71.627 48.056 75.819 1.00 0.00 H
ATOM 5880 HA VAL A 365 72.984 46.330 73.809 1.00 0.00 H
ATOM 5881 HB VAL A 365 72.103 48.442 73.118 1.00 0.00 H
ATOM 5882 HG11 VAL A 365 73.489 50.631 73.702 1.00 0.00 H
ATOM 5883 HG12 VAL A 365 72.803 49.850 75.154 1.00 0.00 H
ATOM 5884 HG13 VAL A 365 74.459 49.594 74.690 1.00 0.00 H
ATOM 5885 HG21 VAL A 365 73.781 47.298 71.843 1.00 0.00 H
ATOM 5886 HG22 VAL A 365 74.204 49.037 71.826 1.00 0.00 H
ATOM 5887 HG23 VAL A 365 75.123 48.029 72.816 1.00 0.00 H
ATOM 5888 N SER A 366 75.376 46.167 74.910 1.00 0.00 N
ATOM 5889 CA SER A 366 76.630 45.881 75.567 1.00 0.00 C
ATOM 5890 C SER A 366 77.826 45.723 74.620 1.00 0.00 C
ATOM 5891 O SER A 366 77.634 45.665 73.371 1.00 0.00 O
ATOM 5892 CB SER A 366 76.580 44.547 76.375 1.00 0.00 C
ATOM 5893 OG SER A 366 76.612 43.415 75.487 1.00 0.00 O
ATOM 5894 H SER A 366 75.135 45.551 74.146 1.00 0.00 H
ATOM 5895 HA SER A 366 76.881 46.682 76.262 1.00 0.00 H
ATOM 5896 HB2 SER A 366 77.477 44.501 76.994 1.00 0.00 H
ATOM 5897 HB3 SER A 366 75.733 44.694 77.045 1.00 0.00 H
ATOM 5898 HG SER A 366 75.819 43.374 74.947 1.00 0.00 H
ATOM 5899 N GLN A 367 79.011 45.436 75.188 1.00 0.00 N
ATOM 5900 CA GLN A 367 80.115 44.801 74.475 1.00 0.00 C
ATOM 5901 C GLN A 367 79.889 43.584 73.569 1.00 0.00 C
ATOM 5902 O GLN A 367 80.630 43.447 72.570 1.00 0.00 O
ATOM 5903 CB GLN A 367 81.123 44.401 75.599 1.00 0.00 C
ATOM 5904 CG GLN A 367 80.504 43.499 76.791 1.00 0.00 C
ATOM 5905 CD GLN A 367 80.557 42.009 76.565 1.00 0.00 C
ATOM 5906 NE2 GLN A 367 79.951 41.236 77.386 1.00 0.00 N
ATOM 5907 OE1 GLN A 367 81.009 41.464 75.539 1.00 0.00 O
ATOM 5908 H GLN A 367 79.111 45.431 76.193 1.00 0.00 H
ATOM 5909 HA GLN A 367 80.611 45.568 73.880 1.00 0.00 H
ATOM 5910 HB2 GLN A 367 81.963 43.836 75.193 1.00 0.00 H
ATOM 5911 HB3 GLN A 367 81.587 45.296 76.013 1.00 0.00 H
ATOM 5912 HG2 GLN A 367 81.054 43.773 77.691 1.00 0.00 H
ATOM 5913 HG3 GLN A 367 79.452 43.768 76.888 1.00 0.00 H
ATOM 5914 HE21 GLN A 367 79.930 40.240 77.224 1.00 0.00 H
ATOM 5915 HE22 GLN A 367 79.628 41.682 78.233 1.00 0.00 H
ATOM 5916 N ARG A 368 78.788 42.814 73.697 1.00 0.00 N
ATOM 5917 CA ARG A 368 78.363 41.915 72.666 1.00 0.00 C
ATOM 5918 C ARG A 368 78.021 42.546 71.325 1.00 0.00 C
ATOM 5919 O ARG A 368 78.678 42.339 70.301 1.00 0.00 O
ATOM 5920 CB ARG A 368 77.191 41.061 73.141 1.00 0.00 C
ATOM 5921 CG ARG A 368 77.422 40.144 74.310 1.00 0.00 C
ATOM 5922 CD ARG A 368 76.213 39.432 74.778 1.00 0.00 C
ATOM 5923 NE ARG A 368 75.508 40.324 75.699 1.00 0.00 N
ATOM 5924 CZ ARG A 368 75.727 40.432 77.023 1.00 0.00 C
ATOM 5925 NH1 ARG A 368 76.536 39.603 77.625 1.00 0.00 N1+
ATOM 5926 NH2 ARG A 368 75.154 41.400 77.648 1.00 0.00 N
ATOM 5927 H ARG A 368 78.332 42.763 74.597 1.00 0.00 H
ATOM 5928 HA ARG A 368 79.177 41.251 72.376 1.00 0.00 H
ATOM 5929 HB2 ARG A 368 76.329 41.650 73.455 1.00 0.00 H
ATOM 5930 HB3 ARG A 368 76.857 40.373 72.365 1.00 0.00 H
ATOM 5931 HG2 ARG A 368 78.090 39.432 73.826 1.00 0.00 H
ATOM 5932 HG3 ARG A 368 78.127 40.448 75.083 1.00 0.00 H
ATOM 5933 HD2 ARG A 368 75.543 39.258 73.936 1.00 0.00 H
ATOM 5934 HD3 ARG A 368 76.483 38.462 75.196 1.00 0.00 H
ATOM 5935 HE ARG A 368 74.988 41.037 75.208 1.00 0.00 H
ATOM 5936 HH11 ARG A 368 77.130 38.951 77.134 1.00 0.00 H
ATOM 5937 HH12 ARG A 368 76.696 39.658 78.621 1.00 0.00 H
ATOM 5938 HH21 ARG A 368 74.561 42.086 77.203 1.00 0.00 H
ATOM 5939 HH22 ARG A 368 75.223 41.499 78.651 1.00 0.00 H
ATOM 5940 N GLY A 369 77.142 43.493 71.363 1.00 0.00 N
ATOM 5941 CA GLY A 369 76.794 44.349 70.286 1.00 0.00 C
ATOM 5942 C GLY A 369 78.023 45.112 69.757 1.00 0.00 C
ATOM 5943 O GLY A 369 78.102 45.298 68.522 1.00 0.00 O
ATOM 5944 H GLY A 369 76.803 43.765 72.274 1.00 0.00 H
ATOM 5945 HA2 GLY A 369 76.382 43.839 69.416 1.00 0.00 H
ATOM 5946 HA3 GLY A 369 76.052 45.089 70.586 1.00 0.00 H
ATOM 5947 N LEU A 370 78.930 45.558 70.680 1.00 0.00 N
ATOM 5948 CA LEU A 370 80.072 46.335 70.187 1.00 0.00 C
ATOM 5949 C LEU A 370 80.929 45.413 69.264 1.00 0.00 C
ATOM 5950 O LEU A 370 81.294 45.833 68.221 1.00 0.00 O
ATOM 5951 CB LEU A 370 80.929 46.824 71.351 1.00 0.00 C
ATOM 5952 CG LEU A 370 80.336 47.877 72.292 1.00 0.00 C
ATOM 5953 CD1 LEU A 370 81.422 48.539 73.094 1.00 0.00 C
ATOM 5954 CD2 LEU A 370 79.723 49.038 71.538 1.00 0.00 C
ATOM 5955 H LEU A 370 78.772 45.560 71.677 1.00 0.00 H
ATOM 5956 HA LEU A 370 79.690 47.127 69.543 1.00 0.00 H
ATOM 5957 HB2 LEU A 370 81.342 46.021 71.961 1.00 0.00 H
ATOM 5958 HB3 LEU A 370 81.734 47.362 70.848 1.00 0.00 H
ATOM 5959 HG LEU A 370 79.604 47.438 72.969 1.00 0.00 H
ATOM 5960 HD11 LEU A 370 82.089 49.187 72.525 1.00 0.00 H
ATOM 5961 HD12 LEU A 370 81.168 49.135 73.971 1.00 0.00 H
ATOM 5962 HD13 LEU A 370 82.093 47.819 73.564 1.00 0.00 H
ATOM 5963 HD21 LEU A 370 80.537 49.533 71.009 1.00 0.00 H
ATOM 5964 HD22 LEU A 370 79.139 48.616 70.719 1.00 0.00 H
ATOM 5965 HD23 LEU A 370 79.184 49.521 72.353 1.00 0.00 H
ATOM 5966 N ILE A 371 81.210 44.127 69.649 1.00 0.00 N
ATOM 5967 CA ILE A 371 81.995 43.212 68.834 1.00 0.00 C
ATOM 5968 C ILE A 371 81.369 42.922 67.430 1.00 0.00 C
ATOM 5969 O ILE A 371 82.047 42.918 66.389 1.00 0.00 O
ATOM 5970 CB ILE A 371 82.360 41.912 69.586 1.00 0.00 C
ATOM 5971 CG1 ILE A 371 83.284 42.287 70.765 1.00 0.00 C
ATOM 5972 CG2 ILE A 371 83.108 40.929 68.743 1.00 0.00 C
ATOM 5973 CD1 ILE A 371 83.233 41.298 71.940 1.00 0.00 C
ATOM 5974 H ILE A 371 80.856 43.825 70.545 1.00 0.00 H
ATOM 5975 HA ILE A 371 82.943 43.672 68.555 1.00 0.00 H
ATOM 5976 HB ILE A 371 81.389 41.484 69.837 1.00 0.00 H
ATOM 5977 HG12 ILE A 371 84.279 42.601 70.450 1.00 0.00 H
ATOM 5978 HG13 ILE A 371 82.897 43.213 71.192 1.00 0.00 H
ATOM 5979 HG21 ILE A 371 83.492 40.107 69.347 1.00 0.00 H
ATOM 5980 HG22 ILE A 371 82.313 40.520 68.119 1.00 0.00 H
ATOM 5981 HG23 ILE A 371 83.941 41.353 68.183 1.00 0.00 H
ATOM 5982 HD11 ILE A 371 83.800 41.797 72.727 1.00 0.00 H
ATOM 5983 HD12 ILE A 371 82.221 40.998 72.213 1.00 0.00 H
ATOM 5984 HD13 ILE A 371 83.764 40.388 71.661 1.00 0.00 H
ATOM 5985 N ALA A 372 80.018 42.695 67.386 1.00 0.00 N
ATOM 5986 CA ALA A 372 79.182 42.425 66.266 1.00 0.00 C
ATOM 5987 C ALA A 372 79.273 43.551 65.232 1.00 0.00 C
ATOM 5988 O ALA A 372 79.170 43.328 64.022 1.00 0.00 O
ATOM 5989 CB ALA A 372 77.754 42.227 66.781 1.00 0.00 C
ATOM 5990 H ALA A 372 79.623 42.876 68.297 1.00 0.00 H
ATOM 5991 HA ALA A 372 79.558 41.522 65.785 1.00 0.00 H
ATOM 5992 HB1 ALA A 372 77.236 42.044 65.839 1.00 0.00 H
ATOM 5993 HB2 ALA A 372 77.657 41.348 67.417 1.00 0.00 H
ATOM 5994 HB3 ALA A 372 77.468 43.169 67.250 1.00 0.00 H
ATOM 5995 N LEU A 373 79.196 44.835 65.686 1.00 0.00 N
ATOM 5996 CA LEU A 373 79.257 46.005 64.859 1.00 0.00 C
ATOM 5997 C LEU A 373 80.660 46.383 64.299 1.00 0.00 C
ATOM 5998 O LEU A 373 80.823 46.611 63.106 1.00 0.00 O
ATOM 5999 CB LEU A 373 78.681 47.195 65.677 1.00 0.00 C
ATOM 6000 CG LEU A 373 78.414 48.398 64.777 1.00 0.00 C
ATOM 6001 CD1 LEU A 373 77.127 48.253 64.045 1.00 0.00 C
ATOM 6002 CD2 LEU A 373 78.529 49.665 65.725 1.00 0.00 C
ATOM 6003 H LEU A 373 79.288 44.961 66.684 1.00 0.00 H
ATOM 6004 HA LEU A 373 78.524 45.839 64.070 1.00 0.00 H
ATOM 6005 HB2 LEU A 373 77.802 46.890 66.246 1.00 0.00 H
ATOM 6006 HB3 LEU A 373 79.457 47.371 66.423 1.00 0.00 H
ATOM 6007 HG LEU A 373 79.189 48.489 64.016 1.00 0.00 H
ATOM 6008 HD11 LEU A 373 76.406 47.911 64.786 1.00 0.00 H
ATOM 6009 HD12 LEU A 373 76.941 49.232 63.604 1.00 0.00 H
ATOM 6010 HD13 LEU A 373 77.178 47.514 63.245 1.00 0.00 H
ATOM 6011 HD21 LEU A 373 78.326 50.583 65.173 1.00 0.00 H
ATOM 6012 HD22 LEU A 373 77.819 49.562 66.546 1.00 0.00 H
ATOM 6013 HD23 LEU A 373 79.511 49.842 66.163 1.00 0.00 H
ATOM 6014 N ALA A 374 81.665 46.463 65.185 1.00 0.00 N
ATOM 6015 CA ALA A 374 83.111 46.402 64.847 1.00 0.00 C
ATOM 6016 C ALA A 374 83.363 45.430 63.681 1.00 0.00 C
ATOM 6017 O ALA A 374 84.094 45.625 62.733 1.00 0.00 O
ATOM 6018 CB ALA A 374 83.959 45.945 66.075 1.00 0.00 C
ATOM 6019 H ALA A 374 81.359 46.557 66.143 1.00 0.00 H
ATOM 6020 HA ALA A 374 83.504 47.376 64.554 1.00 0.00 H
ATOM 6021 HB1 ALA A 374 83.737 46.566 66.943 1.00 0.00 H
ATOM 6022 HB2 ALA A 374 83.966 44.885 66.329 1.00 0.00 H
ATOM 6023 HB3 ALA A 374 84.916 46.285 65.678 1.00 0.00 H
ATOM 6024 N GLN A 375 82.756 44.236 63.804 1.00 0.00 N
ATOM 6025 CA GLN A 375 83.085 43.221 62.780 1.00 0.00 C
ATOM 6026 C GLN A 375 82.324 43.411 61.438 1.00 0.00 C
ATOM 6027 O GLN A 375 82.687 42.785 60.415 1.00 0.00 O
ATOM 6028 CB GLN A 375 83.025 41.788 63.400 1.00 0.00 C
ATOM 6029 CG GLN A 375 84.163 41.272 64.207 1.00 0.00 C
ATOM 6030 CD GLN A 375 83.918 39.937 64.907 1.00 0.00 C
ATOM 6031 NE2 GLN A 375 84.753 39.545 65.877 1.00 0.00 N
ATOM 6032 OE1 GLN A 375 82.976 39.286 64.557 1.00 0.00 O
ATOM 6033 H GLN A 375 82.293 43.975 64.662 1.00 0.00 H
ATOM 6034 HA GLN A 375 84.136 43.274 62.494 1.00 0.00 H
ATOM 6035 HB2 GLN A 375 82.148 41.811 64.046 1.00 0.00 H
ATOM 6036 HB3 GLN A 375 82.834 41.028 62.642 1.00 0.00 H
ATOM 6037 HG2 GLN A 375 84.990 41.084 63.522 1.00 0.00 H
ATOM 6038 HG3 GLN A 375 84.494 41.895 65.038 1.00 0.00 H
ATOM 6039 HE21 GLN A 375 84.430 38.725 66.369 1.00 0.00 H
ATOM 6040 HE22 GLN A 375 85.396 40.243 66.223 1.00 0.00 H
ATOM 6041 N GLY A 376 81.273 44.245 61.423 1.00 0.00 N
ATOM 6042 CA GLY A 376 80.343 44.470 60.341 1.00 0.00 C
ATOM 6043 C GLY A 376 80.294 45.770 59.577 1.00 0.00 C
ATOM 6044 O GLY A 376 80.260 45.789 58.375 1.00 0.00 O
ATOM 6045 H GLY A 376 81.099 44.751 62.279 1.00 0.00 H
ATOM 6046 HA2 GLY A 376 80.615 43.720 59.598 1.00 0.00 H
ATOM 6047 HA3 GLY A 376 79.309 44.307 60.647 1.00 0.00 H
ATOM 6048 N CYS A 377 80.195 46.872 60.344 1.00 0.00 N
ATOM 6049 CA CYS A 377 80.064 48.224 59.682 1.00 0.00 C
ATOM 6050 C CYS A 377 81.443 48.991 59.847 1.00 0.00 C
ATOM 6051 O CYS A 377 81.509 50.075 60.445 1.00 0.00 O
ATOM 6052 CB CYS A 377 78.940 49.020 60.367 1.00 0.00 C
ATOM 6053 SG CYS A 377 77.319 48.238 60.016 1.00 0.00 S
ATOM 6054 H CYS A 377 80.144 46.855 61.353 1.00 0.00 H
ATOM 6055 HA CYS A 377 79.788 48.122 58.633 1.00 0.00 H
ATOM 6056 HB2 CYS A 377 79.114 48.912 61.438 1.00 0.00 H
ATOM 6057 HB3 CYS A 377 78.871 50.056 60.038 1.00 0.00 H
ATOM 6058 HG CYS A 377 76.897 49.114 59.100 1.00 0.00 H
ATOM 6059 N GLN A 378 82.480 48.448 59.297 1.00 0.00 N
ATOM 6060 CA GLN A 378 83.868 48.965 59.298 1.00 0.00 C
ATOM 6061 C GLN A 378 84.120 50.348 58.594 1.00 0.00 C
ATOM 6062 O GLN A 378 85.186 50.939 58.624 1.00 0.00 O
ATOM 6063 CB GLN A 378 84.704 47.831 58.759 1.00 0.00 C
ATOM 6064 CG GLN A 378 84.469 46.445 59.386 1.00 0.00 C
ATOM 6065 CD GLN A 378 85.296 45.347 58.658 1.00 0.00 C
ATOM 6066 NE2 GLN A 378 84.925 44.084 58.801 1.00 0.00 N
ATOM 6067 OE1 GLN A 378 86.291 45.465 58.061 1.00 0.00 O
ATOM 6068 H GLN A 378 82.395 47.698 58.626 1.00 0.00 H
ATOM 6069 HA GLN A 378 84.278 49.046 60.305 1.00 0.00 H
ATOM 6070 HB2 GLN A 378 84.555 47.788 57.680 1.00 0.00 H
ATOM 6071 HB3 GLN A 378 85.759 48.050 58.923 1.00 0.00 H
ATOM 6072 HG2 GLN A 378 84.799 46.453 60.425 1.00 0.00 H
ATOM 6073 HG3 GLN A 378 83.435 46.100 59.366 1.00 0.00 H
ATOM 6074 HE21 GLN A 378 85.374 43.431 58.175 1.00 0.00 H
ATOM 6075 HE22 GLN A 378 83.996 43.970 59.181 1.00 0.00 H
ATOM 6076 N GLU A 379 83.126 50.864 57.873 1.00 0.00 N
ATOM 6077 CA GLU A 379 82.976 52.133 57.297 1.00 0.00 C
ATOM 6078 C GLU A 379 82.958 53.279 58.370 1.00 0.00 C
ATOM 6079 O GLU A 379 83.538 54.379 58.109 1.00 0.00 O
ATOM 6080 CB GLU A 379 81.647 52.012 56.519 1.00 0.00 C
ATOM 6081 CG GLU A 379 81.059 53.360 55.832 1.00 0.00 C
ATOM 6082 CD GLU A 379 81.880 53.870 54.701 1.00 0.00 C
ATOM 6083 OE1 GLU A 379 82.346 53.030 53.888 1.00 0.00 O
ATOM 6084 OE2 GLU A 379 82.008 55.115 54.498 1.00 0.00 O1-
ATOM 6085 H GLU A 379 82.362 50.212 57.767 1.00 0.00 H
ATOM 6086 HA GLU A 379 83.687 52.469 56.542 1.00 0.00 H
ATOM 6087 HB2 GLU A 379 81.654 51.220 55.770 1.00 0.00 H
ATOM 6088 HB3 GLU A 379 80.959 51.582 57.246 1.00 0.00 H
ATOM 6089 HG2 GLU A 379 80.038 53.247 55.467 1.00 0.00 H
ATOM 6090 HG3 GLU A 379 81.080 54.071 56.658 1.00 0.00 H
ATOM 6091 N LEU A 380 82.325 52.995 59.569 1.00 0.00 N
ATOM 6092 CA LEU A 380 82.031 54.004 60.586 1.00 0.00 C
ATOM 6093 C LEU A 380 83.093 55.166 60.821 1.00 0.00 C
ATOM 6094 O LEU A 380 84.316 54.942 60.954 1.00 0.00 O
ATOM 6095 CB LEU A 380 81.640 53.268 61.887 1.00 0.00 C
ATOM 6096 CG LEU A 380 80.227 52.743 61.804 1.00 0.00 C
ATOM 6097 CD1 LEU A 380 80.106 51.648 62.901 1.00 0.00 C
ATOM 6098 CD2 LEU A 380 79.171 53.864 62.091 1.00 0.00 C
ATOM 6099 H LEU A 380 82.063 52.020 59.548 1.00 0.00 H
ATOM 6100 HA LEU A 380 81.144 54.544 60.254 1.00 0.00 H
ATOM 6101 HB2 LEU A 380 82.367 52.471 62.044 1.00 0.00 H
ATOM 6102 HB3 LEU A 380 81.719 54.025 62.668 1.00 0.00 H
ATOM 6103 HG LEU A 380 80.040 52.292 60.829 1.00 0.00 H
ATOM 6104 HD11 LEU A 380 80.125 52.098 63.893 1.00 0.00 H
ATOM 6105 HD12 LEU A 380 79.172 51.210 62.548 1.00 0.00 H
ATOM 6106 HD13 LEU A 380 80.849 50.854 62.824 1.00 0.00 H
ATOM 6107 HD21 LEU A 380 78.151 53.544 61.876 1.00 0.00 H
ATOM 6108 HD22 LEU A 380 79.121 54.046 63.164 1.00 0.00 H
ATOM 6109 HD23 LEU A 380 79.439 54.752 61.518 1.00 0.00 H
ATOM 6110 N GLU A 381 82.677 56.445 60.776 1.00 0.00 N
ATOM 6111 CA GLU A 381 83.537 57.609 60.834 1.00 0.00 C
ATOM 6112 C GLU A 381 83.315 58.457 62.096 1.00 0.00 C
ATOM 6113 O GLU A 381 84.256 58.998 62.684 1.00 0.00 O
ATOM 6114 CB GLU A 381 83.549 58.324 59.467 1.00 0.00 C
ATOM 6115 CG GLU A 381 84.126 59.785 59.607 1.00 0.00 C
ATOM 6116 CD GLU A 381 83.053 60.851 60.047 1.00 0.00 C
ATOM 6117 OE1 GLU A 381 81.832 60.597 60.088 1.00 0.00 O
ATOM 6118 OE2 GLU A 381 83.358 61.970 60.376 1.00 0.00 O1-
ATOM 6119 H GLU A 381 81.684 56.564 60.632 1.00 0.00 H
ATOM 6120 HA GLU A 381 84.552 57.212 60.838 1.00 0.00 H
ATOM 6121 HB2 GLU A 381 84.171 57.832 58.720 1.00 0.00 H
ATOM 6122 HB3 GLU A 381 82.502 58.368 59.167 1.00 0.00 H
ATOM 6123 HG2 GLU A 381 84.990 59.733 60.270 1.00 0.00 H
ATOM 6124 HG3 GLU A 381 84.526 60.087 58.639 1.00 0.00 H
ATOM 6125 N TYR A 382 82.102 58.380 62.604 1.00 0.00 N
ATOM 6126 CA TYR A 382 81.621 58.836 63.825 1.00 0.00 C
ATOM 6127 C TYR A 382 80.751 57.776 64.524 1.00 0.00 C
ATOM 6128 O TYR A 382 79.751 57.285 64.014 1.00 0.00 O
ATOM 6129 CB TYR A 382 80.845 60.226 63.765 1.00 0.00 C
ATOM 6130 CG TYR A 382 80.149 60.835 64.950 1.00 0.00 C
ATOM 6131 CD1 TYR A 382 79.070 61.750 64.672 1.00 0.00 C
ATOM 6132 CD2 TYR A 382 80.572 60.633 66.289 1.00 0.00 C
ATOM 6133 CE1 TYR A 382 78.469 62.471 65.689 1.00 0.00 C
ATOM 6134 CE2 TYR A 382 79.924 61.371 67.341 1.00 0.00 C
ATOM 6135 CZ TYR A 382 78.903 62.331 66.992 1.00 0.00 C
ATOM 6136 OH TYR A 382 78.120 62.913 67.920 1.00 0.00 O
ATOM 6137 H TYR A 382 81.464 57.905 61.982 1.00 0.00 H
ATOM 6138 HA TYR A 382 82.460 59.027 64.495 1.00 0.00 H
ATOM 6139 HB2 TYR A 382 81.530 60.970 63.359 1.00 0.00 H
ATOM 6140 HB3 TYR A 382 80.070 60.046 63.020 1.00 0.00 H
ATOM 6141 HD1 TYR A 382 78.595 61.801 63.703 1.00 0.00 H
ATOM 6142 HD2 TYR A 382 81.400 60.006 66.587 1.00 0.00 H
ATOM 6143 HE1 TYR A 382 77.553 63.011 65.496 1.00 0.00 H
ATOM 6144 HE2 TYR A 382 80.214 61.166 68.361 1.00 0.00 H
ATOM 6145 HH TYR A 382 77.735 63.701 67.530 1.00 0.00 H
ATOM 6146 N MET A 383 81.060 57.438 65.762 1.00 0.00 N
ATOM 6147 CA MET A 383 80.384 56.442 66.561 1.00 0.00 C
ATOM 6148 C MET A 383 80.225 57.026 67.922 1.00 0.00 C
ATOM 6149 O MET A 383 81.165 57.453 68.558 1.00 0.00 O
ATOM 6150 CB MET A 383 81.121 55.094 66.686 1.00 0.00 C
ATOM 6151 CG MET A 383 80.459 54.113 67.575 1.00 0.00 C
ATOM 6152 SD MET A 383 81.270 52.445 67.591 1.00 0.00 S
ATOM 6153 CE MET A 383 80.374 51.465 68.782 1.00 0.00 C
ATOM 6154 H MET A 383 81.803 57.986 66.172 1.00 0.00 H
ATOM 6155 HA MET A 383 79.415 56.323 66.076 1.00 0.00 H
ATOM 6156 HB2 MET A 383 81.217 54.684 65.680 1.00 0.00 H
ATOM 6157 HB3 MET A 383 82.091 55.178 67.176 1.00 0.00 H
ATOM 6158 HG2 MET A 383 80.204 54.524 68.552 1.00 0.00 H
ATOM 6159 HG3 MET A 383 79.460 53.999 67.155 1.00 0.00 H
ATOM 6160 HE1 MET A 383 79.308 51.395 68.567 1.00 0.00 H
ATOM 6161 HE2 MET A 383 80.911 50.521 68.875 1.00 0.00 H
ATOM 6162 HE3 MET A 383 80.480 51.934 69.760 1.00 0.00 H
ATOM 6163 N ALA A 384 79.006 57.017 68.398 1.00 0.00 N
ATOM 6164 CA ALA A 384 78.635 57.536 69.750 1.00 0.00 C
ATOM 6165 C ALA A 384 77.703 56.493 70.430 1.00 0.00 C
ATOM 6166 O ALA A 384 76.597 56.333 69.915 1.00 0.00 O
ATOM 6167 CB ALA A 384 78.113 58.994 69.600 1.00 0.00 C
ATOM 6168 H ALA A 384 78.163 56.739 67.915 1.00 0.00 H
ATOM 6169 HA ALA A 384 79.495 57.619 70.416 1.00 0.00 H
ATOM 6170 HB1 ALA A 384 78.189 59.507 68.641 1.00 0.00 H
ATOM 6171 HB2 ALA A 384 77.115 59.075 70.031 1.00 0.00 H
ATOM 6172 HB3 ALA A 384 78.757 59.643 70.193 1.00 0.00 H
ATOM 6173 N VAL A 385 78.153 55.907 71.508 1.00 0.00 N
ATOM 6174 CA VAL A 385 77.396 54.898 72.205 1.00 0.00 C
ATOM 6175 C VAL A 385 77.264 55.108 73.698 1.00 0.00 C
ATOM 6176 O VAL A 385 78.153 55.452 74.509 1.00 0.00 O
ATOM 6177 CB VAL A 385 77.883 53.405 71.922 1.00 0.00 C
ATOM 6178 CG1 VAL A 385 77.789 53.244 70.420 1.00 0.00 C
ATOM 6179 CG2 VAL A 385 79.282 53.060 72.405 1.00 0.00 C
ATOM 6180 H VAL A 385 78.995 56.290 71.914 1.00 0.00 H
ATOM 6181 HA VAL A 385 76.359 54.886 71.869 1.00 0.00 H
ATOM 6182 HB VAL A 385 77.147 52.719 72.340 1.00 0.00 H
ATOM 6183 HG11 VAL A 385 76.959 53.843 70.045 1.00 0.00 H
ATOM 6184 HG12 VAL A 385 78.737 53.516 69.954 1.00 0.00 H
ATOM 6185 HG13 VAL A 385 77.620 52.210 70.121 1.00 0.00 H
ATOM 6186 HG21 VAL A 385 79.422 53.009 73.485 1.00 0.00 H
ATOM 6187 HG22 VAL A 385 79.526 52.098 71.955 1.00 0.00 H
ATOM 6188 HG23 VAL A 385 80.005 53.853 72.210 1.00 0.00 H
ATOM 6189 N TYR A 386 75.969 54.988 74.135 1.00 0.00 N
ATOM 6190 CA TYR A 386 75.696 54.603 75.524 1.00 0.00 C
ATOM 6191 C TYR A 386 76.078 53.086 75.519 1.00 0.00 C
ATOM 6192 O TYR A 386 75.968 52.393 74.510 1.00 0.00 O
ATOM 6193 CB TYR A 386 74.165 54.706 75.697 1.00 0.00 C
ATOM 6194 CG TYR A 386 73.738 56.071 76.235 1.00 0.00 C
ATOM 6195 CD1 TYR A 386 73.422 56.314 77.578 1.00 0.00 C
ATOM 6196 CD2 TYR A 386 73.701 57.260 75.409 1.00 0.00 C
ATOM 6197 CE1 TYR A 386 73.102 57.538 78.157 1.00 0.00 C
ATOM 6198 CE2 TYR A 386 73.453 58.497 76.012 1.00 0.00 C
ATOM 6199 CZ TYR A 386 73.128 58.686 77.347 1.00 0.00 C
ATOM 6200 OH TYR A 386 72.888 59.934 77.883 1.00 0.00 O
ATOM 6201 H TYR A 386 75.362 54.591 73.432 1.00 0.00 H
ATOM 6202 HA TYR A 386 76.270 55.136 76.282 1.00 0.00 H
ATOM 6203 HB2 TYR A 386 73.729 54.387 74.750 1.00 0.00 H
ATOM 6204 HB3 TYR A 386 73.887 53.974 76.455 1.00 0.00 H
ATOM 6205 HD1 TYR A 386 73.582 55.466 78.228 1.00 0.00 H
ATOM 6206 HD2 TYR A 386 73.858 57.127 74.349 1.00 0.00 H
ATOM 6207 HE1 TYR A 386 72.979 57.681 79.221 1.00 0.00 H
ATOM 6208 HE2 TYR A 386 73.378 59.380 75.395 1.00 0.00 H
ATOM 6209 HH TYR A 386 72.265 60.377 77.303 1.00 0.00 H
ATOM 6210 N VAL A 387 76.258 52.601 76.723 1.00 0.00 N
ATOM 6211 CA VAL A 387 76.382 51.166 76.978 1.00 0.00 C
ATOM 6212 C VAL A 387 76.087 50.780 78.445 1.00 0.00 C
ATOM 6213 O VAL A 387 76.257 51.633 79.345 1.00 0.00 O
ATOM 6214 CB VAL A 387 77.837 50.726 76.717 1.00 0.00 C
ATOM 6215 CG1 VAL A 387 78.935 51.126 77.688 1.00 0.00 C
ATOM 6216 CG2 VAL A 387 77.911 49.221 76.458 1.00 0.00 C
ATOM 6217 H VAL A 387 76.388 53.229 77.504 1.00 0.00 H
ATOM 6218 HA VAL A 387 75.651 50.688 76.327 1.00 0.00 H
ATOM 6219 HB VAL A 387 78.236 50.991 75.738 1.00 0.00 H
ATOM 6220 HG11 VAL A 387 78.832 50.581 78.626 1.00 0.00 H
ATOM 6221 HG12 VAL A 387 79.880 50.804 77.252 1.00 0.00 H
ATOM 6222 HG13 VAL A 387 78.884 52.195 77.896 1.00 0.00 H
ATOM 6223 HG21 VAL A 387 77.143 49.016 75.713 1.00 0.00 H
ATOM 6224 HG22 VAL A 387 78.889 48.860 76.137 1.00 0.00 H
ATOM 6225 HG23 VAL A 387 77.816 48.645 77.379 1.00 0.00 H
ATOM 6226 N SER A 388 75.720 49.487 78.680 1.00 0.00 N
ATOM 6227 CA SER A 388 75.378 49.072 80.024 1.00 0.00 C
ATOM 6228 C SER A 388 76.360 47.934 80.553 1.00 0.00 C
ATOM 6229 O SER A 388 76.238 47.502 81.729 1.00 0.00 O
ATOM 6230 CB SER A 388 73.914 48.641 80.099 1.00 0.00 C
ATOM 6231 OG SER A 388 73.044 49.801 80.482 1.00 0.00 O
ATOM 6232 H SER A 388 75.503 48.810 77.962 1.00 0.00 H
ATOM 6233 HA SER A 388 75.480 49.980 80.619 1.00 0.00 H
ATOM 6234 HB2 SER A 388 73.646 48.296 79.100 1.00 0.00 H
ATOM 6235 HB3 SER A 388 73.817 47.889 80.882 1.00 0.00 H
ATOM 6236 HG SER A 388 73.318 49.939 81.392 1.00 0.00 H
ATOM 6237 N ASP A 389 77.282 47.438 79.754 1.00 0.00 N
ATOM 6238 CA ASP A 389 78.327 46.480 80.099 1.00 0.00 C
ATOM 6239 C ASP A 389 79.468 46.538 79.098 1.00 0.00 C
ATOM 6240 O ASP A 389 79.284 46.752 77.899 1.00 0.00 O
ATOM 6241 CB ASP A 389 77.699 45.090 80.086 1.00 0.00 C
ATOM 6242 CG ASP A 389 78.642 43.981 80.469 1.00 0.00 C
ATOM 6243 OD1 ASP A 389 79.279 44.092 81.554 1.00 0.00 O
ATOM 6244 OD2 ASP A 389 78.554 42.898 79.846 1.00 0.00 O1-
ATOM 6245 H ASP A 389 77.368 47.794 78.813 1.00 0.00 H
ATOM 6246 HA ASP A 389 78.693 46.611 81.117 1.00 0.00 H
ATOM 6247 HB2 ASP A 389 76.801 45.099 80.705 1.00 0.00 H
ATOM 6248 HB3 ASP A 389 77.242 44.859 79.123 1.00 0.00 H
ATOM 6249 N ILE A 390 80.723 46.262 79.577 1.00 0.00 N
ATOM 6250 CA ILE A 390 81.903 46.571 78.796 1.00 0.00 C
ATOM 6251 C ILE A 390 83.045 45.654 79.174 1.00 0.00 C
ATOM 6252 O ILE A 390 83.085 44.910 80.138 1.00 0.00 O
ATOM 6253 CB ILE A 390 82.177 48.017 78.799 1.00 0.00 C
ATOM 6254 CG1 ILE A 390 83.277 48.554 77.906 1.00 0.00 C
ATOM 6255 CG2 ILE A 390 82.372 48.541 80.250 1.00 0.00 C
ATOM 6256 CD1 ILE A 390 83.009 48.331 76.404 1.00 0.00 C
ATOM 6257 H ILE A 390 80.886 46.151 80.568 1.00 0.00 H
ATOM 6258 HA ILE A 390 81.629 46.364 77.762 1.00 0.00 H
ATOM 6259 HB ILE A 390 81.228 48.474 78.516 1.00 0.00 H
ATOM 6260 HG12 ILE A 390 83.193 49.633 78.030 1.00 0.00 H
ATOM 6261 HG13 ILE A 390 84.236 48.107 78.167 1.00 0.00 H
ATOM 6262 HG21 ILE A 390 81.576 48.403 80.982 1.00 0.00 H
ATOM 6263 HG22 ILE A 390 83.341 48.235 80.643 1.00 0.00 H
ATOM 6264 HG23 ILE A 390 82.447 49.628 80.238 1.00 0.00 H
ATOM 6265 HD11 ILE A 390 82.731 47.289 76.240 1.00 0.00 H
ATOM 6266 HD12 ILE A 390 82.141 48.907 76.083 1.00 0.00 H
ATOM 6267 HD13 ILE A 390 83.899 48.577 75.825 1.00 0.00 H
ATOM 6268 N THR A 391 83.967 45.425 78.210 1.00 0.00 N
ATOM 6269 CA THR A 391 85.265 44.684 78.359 1.00 0.00 C
ATOM 6270 C THR A 391 86.445 45.474 77.733 1.00 0.00 C
ATOM 6271 O THR A 391 86.263 46.455 77.025 1.00 0.00 O
ATOM 6272 CB THR A 391 85.213 43.245 77.835 1.00 0.00 C
ATOM 6273 CG2 THR A 391 84.139 42.231 78.382 1.00 0.00 C
ATOM 6274 OG1 THR A 391 85.200 43.302 76.455 1.00 0.00 O
ATOM 6275 H THR A 391 83.944 45.931 77.337 1.00 0.00 H
ATOM 6276 HA THR A 391 85.441 44.536 79.424 1.00 0.00 H
ATOM 6277 HB THR A 391 86.163 42.763 78.065 1.00 0.00 H
ATOM 6278 HG1 THR A 391 84.871 42.407 76.338 1.00 0.00 H
ATOM 6279 HG21 THR A 391 83.938 42.377 79.443 1.00 0.00 H
ATOM 6280 HG22 THR A 391 83.341 42.247 77.640 1.00 0.00 H
ATOM 6281 HG23 THR A 391 84.501 41.216 78.219 1.00 0.00 H
ATOM 6282 N ASN A 392 87.618 44.912 77.958 1.00 0.00 N
ATOM 6283 CA ASN A 392 88.862 45.138 77.132 1.00 0.00 C
ATOM 6284 C ASN A 392 88.812 44.613 75.668 1.00 0.00 C
ATOM 6285 O ASN A 392 89.115 45.322 74.685 1.00 0.00 O
ATOM 6286 CB ASN A 392 90.153 44.696 77.866 1.00 0.00 C
ATOM 6287 CG ASN A 392 90.542 45.444 79.139 1.00 0.00 C
ATOM 6288 ND2 ASN A 392 90.047 44.980 80.298 1.00 0.00 N
ATOM 6289 OD1 ASN A 392 91.145 46.506 79.220 1.00 0.00 O
ATOM 6290 H ASN A 392 87.644 44.191 78.666 1.00 0.00 H
ATOM 6291 HA ASN A 392 88.887 46.222 77.020 1.00 0.00 H
ATOM 6292 HB2 ASN A 392 90.062 43.634 78.094 1.00 0.00 H
ATOM 6293 HB3 ASN A 392 90.966 44.811 77.150 1.00 0.00 H
ATOM 6294 HD21 ASN A 392 90.330 45.378 81.182 1.00 0.00 H
ATOM 6295 HD22 ASN A 392 89.463 44.157 80.339 1.00 0.00 H
ATOM 6296 N GLU A 393 88.443 43.349 75.602 1.00 0.00 N
ATOM 6297 CA GLU A 393 88.251 42.605 74.308 1.00 0.00 C
ATOM 6298 C GLU A 393 87.398 43.321 73.267 1.00 0.00 C
ATOM 6299 O GLU A 393 87.566 43.194 72.032 1.00 0.00 O
ATOM 6300 CB GLU A 393 87.696 41.246 74.653 1.00 0.00 C
ATOM 6301 CG GLU A 393 87.526 40.344 73.449 1.00 0.00 C
ATOM 6302 CD GLU A 393 88.817 39.672 72.929 1.00 0.00 C
ATOM 6303 OE1 GLU A 393 88.828 39.392 71.716 1.00 0.00 O
ATOM 6304 OE2 GLU A 393 89.868 39.681 73.572 1.00 0.00 O1-
ATOM 6305 H GLU A 393 88.105 42.793 76.374 1.00 0.00 H
ATOM 6306 HA GLU A 393 89.243 42.437 73.888 1.00 0.00 H
ATOM 6307 HB2 GLU A 393 88.272 40.804 75.466 1.00 0.00 H
ATOM 6308 HB3 GLU A 393 86.742 41.491 75.122 1.00 0.00 H
ATOM 6309 HG2 GLU A 393 86.971 39.489 73.834 1.00 0.00 H
ATOM 6310 HG3 GLU A 393 86.948 40.880 72.696 1.00 0.00 H
ATOM 6311 N SER A 394 86.439 44.146 73.683 1.00 0.00 N
ATOM 6312 CA SER A 394 85.522 44.909 72.824 1.00 0.00 C
ATOM 6313 C SER A 394 86.152 46.265 72.286 1.00 0.00 C
ATOM 6314 O SER A 394 85.996 46.501 71.074 1.00 0.00 O
ATOM 6315 CB SER A 394 84.120 44.995 73.379 1.00 0.00 C
ATOM 6316 OG SER A 394 84.223 45.635 74.659 1.00 0.00 O
ATOM 6317 H SER A 394 86.391 44.287 74.682 1.00 0.00 H
ATOM 6318 HA SER A 394 85.354 44.230 71.988 1.00 0.00 H
ATOM 6319 HB2 SER A 394 83.465 45.482 72.656 1.00 0.00 H
ATOM 6320 HB3 SER A 394 83.659 44.014 73.490 1.00 0.00 H
ATOM 6321 HG SER A 394 84.277 44.930 75.307 1.00 0.00 H
ATOM 6322 N LEU A 395 86.858 47.049 73.061 1.00 0.00 N
ATOM 6323 CA LEU A 395 87.582 48.295 72.743 1.00 0.00 C
ATOM 6324 C LEU A 395 88.782 47.959 71.897 1.00 0.00 C
ATOM 6325 O LEU A 395 89.253 48.757 71.013 1.00 0.00 O
ATOM 6326 CB LEU A 395 87.954 48.875 74.148 1.00 0.00 C
ATOM 6327 CG LEU A 395 86.717 49.266 74.960 1.00 0.00 C
ATOM 6328 CD1 LEU A 395 87.111 50.002 76.214 1.00 0.00 C
ATOM 6329 CD2 LEU A 395 85.735 50.137 74.155 1.00 0.00 C
ATOM 6330 H LEU A 395 86.803 46.925 74.062 1.00 0.00 H
ATOM 6331 HA LEU A 395 86.914 48.908 72.139 1.00 0.00 H
ATOM 6332 HB2 LEU A 395 88.542 48.148 74.708 1.00 0.00 H
ATOM 6333 HB3 LEU A 395 88.480 49.823 74.035 1.00 0.00 H
ATOM 6334 HG LEU A 395 86.215 48.368 75.319 1.00 0.00 H
ATOM 6335 HD11 LEU A 395 87.665 49.243 76.766 1.00 0.00 H
ATOM 6336 HD12 LEU A 395 87.763 50.857 76.033 1.00 0.00 H
ATOM 6337 HD13 LEU A 395 86.318 50.344 76.878 1.00 0.00 H
ATOM 6338 HD21 LEU A 395 86.348 50.822 73.568 1.00 0.00 H
ATOM 6339 HD22 LEU A 395 85.248 49.452 73.461 1.00 0.00 H
ATOM 6340 HD23 LEU A 395 84.967 50.606 74.771 1.00 0.00 H
ATOM 6341 N GLU A 396 89.376 46.741 72.098 1.00 0.00 N
ATOM 6342 CA GLU A 396 90.429 46.051 71.322 1.00 0.00 C
ATOM 6343 C GLU A 396 89.851 45.439 70.033 1.00 0.00 C
ATOM 6344 O GLU A 396 90.482 45.572 68.984 1.00 0.00 O
ATOM 6345 CB GLU A 396 91.290 45.181 72.241 1.00 0.00 C
ATOM 6346 CG GLU A 396 92.297 44.394 71.403 1.00 0.00 C
ATOM 6347 CD GLU A 396 93.313 43.701 72.359 1.00 0.00 C
ATOM 6348 OE1 GLU A 396 93.398 42.472 72.537 1.00 0.00 O
ATOM 6349 OE2 GLU A 396 94.135 44.441 72.944 1.00 0.00 O1-
ATOM 6350 H GLU A 396 89.066 46.251 72.925 1.00 0.00 H
ATOM 6351 HA GLU A 396 91.109 46.835 70.988 1.00 0.00 H
ATOM 6352 HB2 GLU A 396 91.741 45.807 73.011 1.00 0.00 H
ATOM 6353 HB3 GLU A 396 90.660 44.456 72.757 1.00 0.00 H
ATOM 6354 HG2 GLU A 396 91.805 43.690 70.732 1.00 0.00 H
ATOM 6355 HG3 GLU A 396 92.818 45.164 70.835 1.00 0.00 H
ATOM 6356 N SER A 397 88.592 45.075 70.027 1.00 0.00 N
ATOM 6357 CA SER A 397 87.921 44.677 68.802 1.00 0.00 C
ATOM 6358 C SER A 397 87.706 45.852 67.900 1.00 0.00 C
ATOM 6359 O SER A 397 88.133 45.817 66.736 1.00 0.00 O
ATOM 6360 CB SER A 397 86.568 44.000 69.085 1.00 0.00 C
ATOM 6361 OG SER A 397 86.059 43.445 67.889 1.00 0.00 O
ATOM 6362 H SER A 397 88.197 44.978 70.951 1.00 0.00 H
ATOM 6363 HA SER A 397 88.587 44.049 68.210 1.00 0.00 H
ATOM 6364 HB2 SER A 397 86.698 43.176 69.786 1.00 0.00 H
ATOM 6365 HB3 SER A 397 85.892 44.746 69.501 1.00 0.00 H
ATOM 6366 HG SER A 397 86.042 42.492 68.001 1.00 0.00 H
ATOM 6367 N ILE A 398 87.230 46.980 68.438 1.00 0.00 N
ATOM 6368 CA ILE A 398 87.098 48.311 67.673 1.00 0.00 C
ATOM 6369 C ILE A 398 88.422 48.796 67.127 1.00 0.00 C
ATOM 6370 O ILE A 398 88.511 49.044 65.928 1.00 0.00 O
ATOM 6371 CB ILE A 398 86.431 49.322 68.684 1.00 0.00 C
ATOM 6372 CG1 ILE A 398 84.933 48.857 68.879 1.00 0.00 C
ATOM 6373 CG2 ILE A 398 86.503 50.809 68.290 1.00 0.00 C
ATOM 6374 CD1 ILE A 398 84.230 49.742 69.880 1.00 0.00 C
ATOM 6375 H ILE A 398 86.792 46.834 69.336 1.00 0.00 H
ATOM 6376 HA ILE A 398 86.401 48.122 66.856 1.00 0.00 H
ATOM 6377 HB ILE A 398 86.864 49.164 69.672 1.00 0.00 H
ATOM 6378 HG12 ILE A 398 84.421 48.962 67.922 1.00 0.00 H
ATOM 6379 HG13 ILE A 398 84.881 47.789 69.091 1.00 0.00 H
ATOM 6380 HG21 ILE A 398 87.522 51.059 67.994 1.00 0.00 H
ATOM 6381 HG22 ILE A 398 85.815 50.932 67.454 1.00 0.00 H
ATOM 6382 HG23 ILE A 398 86.161 51.513 69.048 1.00 0.00 H
ATOM 6383 HD11 ILE A 398 83.280 49.339 70.230 1.00 0.00 H
ATOM 6384 HD12 ILE A 398 84.755 50.023 70.793 1.00 0.00 H
ATOM 6385 HD13 ILE A 398 84.145 50.724 69.413 1.00 0.00 H
ATOM 6386 N GLY A 399 89.439 48.691 67.956 1.00 0.00 N
ATOM 6387 CA GLY A 399 90.873 48.815 67.650 1.00 0.00 C
ATOM 6388 C GLY A 399 91.458 47.885 66.576 1.00 0.00 C
ATOM 6389 O GLY A 399 92.482 48.227 65.999 1.00 0.00 O
ATOM 6390 H GLY A 399 89.225 48.499 68.924 1.00 0.00 H
ATOM 6391 HA2 GLY A 399 91.120 49.851 67.418 1.00 0.00 H
ATOM 6392 HA3 GLY A 399 91.449 48.707 68.569 1.00 0.00 H
ATOM 6393 N THR A 400 90.823 46.710 66.296 1.00 0.00 N
ATOM 6394 CA THR A 400 91.107 45.840 65.144 1.00 0.00 C
ATOM 6395 C THR A 400 90.397 46.324 63.873 1.00 0.00 C
ATOM 6396 O THR A 400 91.071 46.237 62.829 1.00 0.00 O
ATOM 6397 CB THR A 400 90.802 44.330 65.452 1.00 0.00 C
ATOM 6398 CG2 THR A 400 91.701 43.433 64.542 1.00 0.00 C
ATOM 6399 OG1 THR A 400 91.085 44.051 66.790 1.00 0.00 O
ATOM 6400 H THR A 400 89.971 46.486 66.790 1.00 0.00 H
ATOM 6401 HA THR A 400 92.162 46.082 65.016 1.00 0.00 H
ATOM 6402 HB THR A 400 89.743 44.146 65.274 1.00 0.00 H
ATOM 6403 HG1 THR A 400 90.765 44.790 67.312 1.00 0.00 H
ATOM 6404 HG21 THR A 400 91.266 43.321 63.549 1.00 0.00 H
ATOM 6405 HG22 THR A 400 92.702 43.864 64.542 1.00 0.00 H
ATOM 6406 HG23 THR A 400 91.705 42.438 64.988 1.00 0.00 H
ATOM 6407 N TYR A 401 89.245 46.886 63.836 1.00 0.00 N
ATOM 6408 CA TYR A 401 88.347 46.941 62.663 1.00 0.00 C
ATOM 6409 C TYR A 401 87.969 48.441 62.267 1.00 0.00 C
ATOM 6410 O TYR A 401 87.967 48.927 61.113 1.00 0.00 O
ATOM 6411 CB TYR A 401 87.131 46.116 62.949 1.00 0.00 C
ATOM 6412 CG TYR A 401 87.519 44.659 63.078 1.00 0.00 C
ATOM 6413 CD1 TYR A 401 87.972 43.972 61.947 1.00 0.00 C
ATOM 6414 CD2 TYR A 401 87.274 43.996 64.300 1.00 0.00 C
ATOM 6415 CE1 TYR A 401 88.350 42.592 62.097 1.00 0.00 C
ATOM 6416 CE2 TYR A 401 87.520 42.626 64.403 1.00 0.00 C
ATOM 6417 CZ TYR A 401 88.044 41.940 63.324 1.00 0.00 C
ATOM 6418 OH TYR A 401 88.045 40.580 63.441 1.00 0.00 O
ATOM 6419 H TYR A 401 88.870 47.133 64.740 1.00 0.00 H
ATOM 6420 HA TYR A 401 88.872 46.634 61.758 1.00 0.00 H
ATOM 6421 HB2 TYR A 401 86.622 46.495 63.835 1.00 0.00 H
ATOM 6422 HB3 TYR A 401 86.518 46.363 62.082 1.00 0.00 H
ATOM 6423 HD1 TYR A 401 88.121 44.447 60.989 1.00 0.00 H
ATOM 6424 HD2 TYR A 401 86.914 44.437 65.218 1.00 0.00 H
ATOM 6425 HE1 TYR A 401 88.797 42.090 61.252 1.00 0.00 H
ATOM 6426 HE2 TYR A 401 87.174 42.098 65.279 1.00 0.00 H
ATOM 6427 HH TYR A 401 88.186 40.070 62.639 1.00 0.00 H
ATOM 6428 N LEU A 402 87.481 49.237 63.209 1.00 0.00 N
ATOM 6429 CA LEU A 402 86.938 50.626 63.083 1.00 0.00 C
ATOM 6430 C LEU A 402 88.059 51.641 62.940 1.00 0.00 C
ATOM 6431 O LEU A 402 88.194 52.549 63.780 1.00 0.00 O
ATOM 6432 CB LEU A 402 85.951 51.085 64.108 1.00 0.00 C
ATOM 6433 CG LEU A 402 84.753 50.105 64.313 1.00 0.00 C
ATOM 6434 CD1 LEU A 402 83.694 50.598 65.287 1.00 0.00 C
ATOM 6435 CD2 LEU A 402 84.097 49.739 62.953 1.00 0.00 C
ATOM 6436 H LEU A 402 87.448 48.933 64.172 1.00 0.00 H
ATOM 6437 HA LEU A 402 86.368 50.794 62.169 1.00 0.00 H
ATOM 6438 HB2 LEU A 402 86.452 51.273 65.057 1.00 0.00 H
ATOM 6439 HB3 LEU A 402 85.550 52.057 63.822 1.00 0.00 H
ATOM 6440 HG LEU A 402 85.183 49.213 64.768 1.00 0.00 H
ATOM 6441 HD11 LEU A 402 83.313 51.592 65.053 1.00 0.00 H
ATOM 6442 HD12 LEU A 402 82.789 49.995 65.205 1.00 0.00 H
ATOM 6443 HD13 LEU A 402 84.129 50.568 66.286 1.00 0.00 H
ATOM 6444 HD21 LEU A 402 84.788 49.132 62.369 1.00 0.00 H
ATOM 6445 HD22 LEU A 402 83.231 49.092 63.095 1.00 0.00 H
ATOM 6446 HD23 LEU A 402 83.884 50.633 62.367 1.00 0.00 H
ATOM 6447 N LYS A 403 88.933 51.410 61.912 1.00 0.00 N
ATOM 6448 CA LYS A 403 90.101 52.263 61.736 1.00 0.00 C
ATOM 6449 C LYS A 403 89.704 53.591 60.972 1.00 0.00 C
ATOM 6450 O LYS A 403 90.402 54.576 61.193 1.00 0.00 O
ATOM 6451 CB LYS A 403 91.228 51.528 61.008 1.00 0.00 C
ATOM 6452 CG LYS A 403 91.575 50.198 61.729 1.00 0.00 C
ATOM 6453 CD LYS A 403 92.727 49.560 60.867 1.00 0.00 C
ATOM 6454 CE LYS A 403 93.080 48.230 61.450 1.00 0.00 C
ATOM 6455 NZ LYS A 403 94.161 47.613 60.626 1.00 0.00 N1+
ATOM 6456 H LYS A 403 88.596 50.739 61.235 1.00 0.00 H
ATOM 6457 HA LYS A 403 90.479 52.458 62.739 1.00 0.00 H
ATOM 6458 HB2 LYS A 403 90.938 51.317 59.978 1.00 0.00 H
ATOM 6459 HB3 LYS A 403 92.132 52.115 61.167 1.00 0.00 H
ATOM 6460 HG2 LYS A 403 91.960 50.322 62.741 1.00 0.00 H
ATOM 6461 HG3 LYS A 403 90.792 49.440 61.712 1.00 0.00 H
ATOM 6462 HD2 LYS A 403 92.506 49.475 59.804 1.00 0.00 H
ATOM 6463 HD3 LYS A 403 93.644 50.138 60.987 1.00 0.00 H
ATOM 6464 HE2 LYS A 403 93.391 48.294 62.493 1.00 0.00 H
ATOM 6465 HE3 LYS A 403 92.215 47.567 61.458 1.00 0.00 H
ATOM 6466 HZ1 LYS A 403 93.905 47.000 59.865 1.00 0.00 H
ATOM 6467 HZ2 LYS A 403 94.823 48.281 60.258 1.00 0.00 H
ATOM 6468 HZ3 LYS A 403 94.691 46.963 61.189 1.00 0.00 H
ATOM 6469 N ASN A 404 88.689 53.590 60.124 1.00 0.00 N
ATOM 6470 CA ASN A 404 88.260 54.818 59.488 1.00 0.00 C
ATOM 6471 C ASN A 404 87.585 55.810 60.492 1.00 0.00 C
ATOM 6472 O ASN A 404 87.189 56.861 60.032 1.00 0.00 O
ATOM 6473 CB ASN A 404 87.337 54.387 58.339 1.00 0.00 C
ATOM 6474 CG ASN A 404 87.022 55.590 57.472 1.00 0.00 C
ATOM 6475 ND2 ASN A 404 85.817 55.816 56.975 1.00 0.00 N
ATOM 6476 OD1 ASN A 404 87.843 56.375 57.133 1.00 0.00 O
ATOM 6477 H ASN A 404 88.095 52.774 60.089 1.00 0.00 H
ATOM 6478 HA ASN A 404 89.095 55.334 59.013 1.00 0.00 H
ATOM 6479 HB2 ASN A 404 87.712 53.565 57.729 1.00 0.00 H
ATOM 6480 HB3 ASN A 404 86.407 54.074 58.814 1.00 0.00 H
ATOM 6481 HD21 ASN A 404 85.671 56.565 56.313 1.00 0.00 H
ATOM 6482 HD22 ASN A 404 85.109 55.218 57.377 1.00 0.00 H
ATOM 6483 N LEU A 405 87.435 55.578 61.813 1.00 0.00 N
ATOM 6484 CA LEU A 405 86.824 56.473 62.772 1.00 0.00 C
ATOM 6485 C LEU A 405 87.625 57.766 63.132 1.00 0.00 C
ATOM 6486 O LEU A 405 88.757 57.757 63.597 1.00 0.00 O
ATOM 6487 CB LEU A 405 86.757 55.568 64.001 1.00 0.00 C
ATOM 6488 CG LEU A 405 85.661 55.788 65.054 1.00 0.00 C
ATOM 6489 CD1 LEU A 405 84.335 55.668 64.329 1.00 0.00 C
ATOM 6490 CD2 LEU A 405 85.638 54.512 66.009 1.00 0.00 C
ATOM 6491 H LEU A 405 87.694 54.689 62.216 1.00 0.00 H
ATOM 6492 HA LEU A 405 85.823 56.735 62.429 1.00 0.00 H
ATOM 6493 HB2 LEU A 405 86.660 54.517 63.729 1.00 0.00 H
ATOM 6494 HB3 LEU A 405 87.627 55.690 64.647 1.00 0.00 H
ATOM 6495 HG LEU A 405 85.672 56.742 65.580 1.00 0.00 H
ATOM 6496 HD11 LEU A 405 84.059 56.632 63.904 1.00 0.00 H
ATOM 6497 HD12 LEU A 405 84.282 54.904 63.553 1.00 0.00 H
ATOM 6498 HD13 LEU A 405 83.589 55.215 64.982 1.00 0.00 H
ATOM 6499 HD21 LEU A 405 85.604 53.573 65.457 1.00 0.00 H
ATOM 6500 HD22 LEU A 405 86.567 54.553 66.577 1.00 0.00 H
ATOM 6501 HD23 LEU A 405 84.803 54.411 66.701 1.00 0.00 H
ATOM 6502 N CYS A 406 87.016 58.913 62.899 1.00 0.00 N
ATOM 6503 CA CYS A 406 87.472 60.226 63.379 1.00 0.00 C
ATOM 6504 C CYS A 406 86.845 60.614 64.726 1.00 0.00 C
ATOM 6505 O CYS A 406 87.340 61.546 65.405 1.00 0.00 O
ATOM 6506 CB CYS A 406 87.083 61.252 62.304 1.00 0.00 C
ATOM 6507 SG CYS A 406 88.088 61.012 60.725 1.00 0.00 S
ATOM 6508 H CYS A 406 86.122 58.825 62.436 1.00 0.00 H
ATOM 6509 HA CYS A 406 88.552 60.254 63.519 1.00 0.00 H
ATOM 6510 HB2 CYS A 406 86.014 61.223 62.095 1.00 0.00 H
ATOM 6511 HB3 CYS A 406 87.309 62.220 62.752 1.00 0.00 H
ATOM 6512 HG CYS A 406 89.232 61.415 61.286 1.00 0.00 H
ATOM 6513 N ASP A 407 85.814 59.875 65.134 1.00 0.00 N
ATOM 6514 CA ASP A 407 85.127 60.184 66.409 1.00 0.00 C
ATOM 6515 C ASP A 407 84.529 59.010 67.006 1.00 0.00 C
ATOM 6516 O ASP A 407 83.578 58.396 66.578 1.00 0.00 O
ATOM 6517 CB ASP A 407 84.117 61.307 66.079 1.00 0.00 C
ATOM 6518 CG ASP A 407 83.596 62.013 67.271 1.00 0.00 C
ATOM 6519 OD1 ASP A 407 83.797 61.608 68.457 1.00 0.00 O
ATOM 6520 OD2 ASP A 407 83.066 63.160 67.104 1.00 0.00 O1-
ATOM 6521 H ASP A 407 85.304 59.235 64.541 1.00 0.00 H
ATOM 6522 HA ASP A 407 85.916 60.519 67.084 1.00 0.00 H
ATOM 6523 HB2 ASP A 407 84.612 62.109 65.531 1.00 0.00 H
ATOM 6524 HB3 ASP A 407 83.326 60.934 65.428 1.00 0.00 H
ATOM 6525 N PHE A 408 85.076 58.596 68.143 1.00 0.00 N
ATOM 6526 CA PHE A 408 84.557 57.524 69.108 1.00 0.00 C
ATOM 6527 C PHE A 408 84.249 58.042 70.513 1.00 0.00 C
ATOM 6528 O PHE A 408 85.120 58.767 70.981 1.00 0.00 O
ATOM 6529 CB PHE A 408 85.550 56.346 69.185 1.00 0.00 C
ATOM 6530 CG PHE A 408 85.209 55.312 70.260 1.00 0.00 C
ATOM 6531 CD1 PHE A 408 85.674 55.535 71.587 1.00 0.00 C
ATOM 6532 CD2 PHE A 408 84.409 54.207 69.938 1.00 0.00 C
ATOM 6533 CE1 PHE A 408 85.353 54.617 72.563 1.00 0.00 C
ATOM 6534 CE2 PHE A 408 84.043 53.388 70.943 1.00 0.00 C
ATOM 6535 CZ PHE A 408 84.460 53.590 72.255 1.00 0.00 C
ATOM 6536 H PHE A 408 85.638 59.326 68.557 1.00 0.00 H
ATOM 6537 HA PHE A 408 83.650 57.075 68.703 1.00 0.00 H
ATOM 6538 HB2 PHE A 408 85.738 55.890 68.213 1.00 0.00 H
ATOM 6539 HB3 PHE A 408 86.510 56.690 69.569 1.00 0.00 H
ATOM 6540 HD1 PHE A 408 86.151 56.484 71.783 1.00 0.00 H
ATOM 6541 HD2 PHE A 408 84.065 54.053 68.926 1.00 0.00 H
ATOM 6542 HE1 PHE A 408 85.686 54.807 73.573 1.00 0.00 H
ATOM 6543 HE2 PHE A 408 83.409 52.568 70.638 1.00 0.00 H
ATOM 6544 HZ PHE A 408 84.181 52.878 73.017 1.00 0.00 H
ATOM 6545 N ARG A 409 82.957 57.839 70.988 1.00 0.00 N
ATOM 6546 CA ARG A 409 82.442 58.317 72.232 1.00 0.00 C
ATOM 6547 C ARG A 409 81.802 57.177 72.964 1.00 0.00 C
ATOM 6548 O ARG A 409 80.813 56.608 72.527 1.00 0.00 O
ATOM 6549 CB ARG A 409 81.573 59.503 71.985 1.00 0.00 C
ATOM 6550 CG ARG A 409 82.330 60.571 71.120 1.00 0.00 C
ATOM 6551 CD ARG A 409 81.401 61.775 71.088 1.00 0.00 C
ATOM 6552 NE ARG A 409 81.965 62.697 70.118 1.00 0.00 N
ATOM 6553 CZ ARG A 409 81.868 64.006 70.161 1.00 0.00 C
ATOM 6554 NH1 ARG A 409 81.223 64.715 71.090 1.00 0.00 N1+
ATOM 6555 NH2 ARG A 409 82.445 64.711 69.174 1.00 0.00 N
ATOM 6556 H ARG A 409 82.296 57.426 70.346 1.00 0.00 H
ATOM 6557 HA ARG A 409 83.239 58.783 72.813 1.00 0.00 H
ATOM 6558 HB2 ARG A 409 80.618 59.148 71.597 1.00 0.00 H
ATOM 6559 HB3 ARG A 409 81.533 60.088 72.904 1.00 0.00 H
ATOM 6560 HG2 ARG A 409 83.237 60.863 71.650 1.00 0.00 H
ATOM 6561 HG3 ARG A 409 82.531 60.194 70.117 1.00 0.00 H
ATOM 6562 HD2 ARG A 409 80.350 61.548 70.909 1.00 0.00 H
ATOM 6563 HD3 ARG A 409 81.491 62.154 72.106 1.00 0.00 H
ATOM 6564 HE ARG A 409 82.580 62.335 69.403 1.00 0.00 H
ATOM 6565 HH11 ARG A 409 80.765 64.152 71.792 1.00 0.00 H
ATOM 6566 HH12 ARG A 409 81.090 65.709 70.967 1.00 0.00 H
ATOM 6567 HH21 ARG A 409 82.775 64.185 68.377 1.00 0.00 H
ATOM 6568 HH22 ARG A 409 82.351 65.709 69.052 1.00 0.00 H
ATOM 6569 N LEU A 410 82.314 57.065 74.227 1.00 0.00 N
ATOM 6570 CA LEU A 410 81.716 56.150 75.215 1.00 0.00 C
ATOM 6571 C LEU A 410 81.015 56.984 76.360 1.00 0.00 C
ATOM 6572 O LEU A 410 81.711 57.766 77.068 1.00 0.00 O
ATOM 6573 CB LEU A 410 82.753 55.139 75.752 1.00 0.00 C
ATOM 6574 CG LEU A 410 82.107 53.806 76.290 1.00 0.00 C
ATOM 6575 CD1 LEU A 410 82.009 52.789 75.138 1.00 0.00 C
ATOM 6576 CD2 LEU A 410 82.937 53.116 77.445 1.00 0.00 C
ATOM 6577 H LEU A 410 83.097 57.645 74.492 1.00 0.00 H
ATOM 6578 HA LEU A 410 80.969 55.592 74.649 1.00 0.00 H
ATOM 6579 HB2 LEU A 410 83.461 54.930 74.950 1.00 0.00 H
ATOM 6580 HB3 LEU A 410 83.352 55.531 76.574 1.00 0.00 H
ATOM 6581 HG LEU A 410 81.176 54.089 76.780 1.00 0.00 H
ATOM 6582 HD11 LEU A 410 81.294 51.990 75.338 1.00 0.00 H
ATOM 6583 HD12 LEU A 410 81.618 53.389 74.315 1.00 0.00 H
ATOM 6584 HD13 LEU A 410 82.946 52.313 74.848 1.00 0.00 H
ATOM 6585 HD21 LEU A 410 83.213 53.820 78.230 1.00 0.00 H
ATOM 6586 HD22 LEU A 410 82.406 52.236 77.808 1.00 0.00 H
ATOM 6587 HD23 LEU A 410 83.738 52.577 76.940 1.00 0.00 H
ATOM 6588 N VAL A 411 79.705 56.717 76.595 1.00 0.00 N
ATOM 6589 CA VAL A 411 78.996 56.961 77.857 1.00 0.00 C
ATOM 6590 C VAL A 411 78.677 55.583 78.462 1.00 0.00 C
ATOM 6591 O VAL A 411 78.004 54.701 77.909 1.00 0.00 O
ATOM 6592 CB VAL A 411 77.688 57.774 77.621 1.00 0.00 C
ATOM 6593 CG1 VAL A 411 76.626 57.589 78.712 1.00 0.00 C
ATOM 6594 CG2 VAL A 411 78.069 59.244 77.487 1.00 0.00 C
ATOM 6595 H VAL A 411 79.205 56.180 75.901 1.00 0.00 H
ATOM 6596 HA VAL A 411 79.669 57.510 78.515 1.00 0.00 H
ATOM 6597 HB VAL A 411 77.235 57.506 76.666 1.00 0.00 H
ATOM 6598 HG11 VAL A 411 76.156 56.605 78.689 1.00 0.00 H
ATOM 6599 HG12 VAL A 411 76.984 57.752 79.728 1.00 0.00 H
ATOM 6600 HG13 VAL A 411 75.862 58.358 78.598 1.00 0.00 H
ATOM 6601 HG21 VAL A 411 77.286 59.753 76.925 1.00 0.00 H
ATOM 6602 HG22 VAL A 411 78.116 59.644 78.500 1.00 0.00 H
ATOM 6603 HG23 VAL A 411 79.011 59.406 76.963 1.00 0.00 H
ATOM 6604 N LEU A 412 79.169 55.317 79.672 1.00 0.00 N
ATOM 6605 CA LEU A 412 78.672 54.209 80.527 1.00 0.00 C
ATOM 6606 C LEU A 412 77.399 54.745 81.274 1.00 0.00 C
ATOM 6607 O LEU A 412 77.475 55.798 81.948 1.00 0.00 O
ATOM 6608 CB LEU A 412 79.738 53.677 81.528 1.00 0.00 C
ATOM 6609 CG LEU A 412 79.334 52.472 82.377 1.00 0.00 C
ATOM 6610 CD1 LEU A 412 78.838 51.199 81.666 1.00 0.00 C
ATOM 6611 CD2 LEU A 412 80.594 52.058 83.247 1.00 0.00 C
ATOM 6612 H LEU A 412 79.827 55.968 80.075 1.00 0.00 H
ATOM 6613 HA LEU A 412 78.330 53.368 79.924 1.00 0.00 H
ATOM 6614 HB2 LEU A 412 80.682 53.429 81.043 1.00 0.00 H
ATOM 6615 HB3 LEU A 412 80.002 54.564 82.104 1.00 0.00 H
ATOM 6616 HG LEU A 412 78.536 52.780 83.052 1.00 0.00 H
ATOM 6617 HD11 LEU A 412 79.589 50.862 80.952 1.00 0.00 H
ATOM 6618 HD12 LEU A 412 78.573 50.413 82.373 1.00 0.00 H
ATOM 6619 HD13 LEU A 412 77.884 51.342 81.159 1.00 0.00 H
ATOM 6620 HD21 LEU A 412 81.419 51.872 82.560 1.00 0.00 H
ATOM 6621 HD22 LEU A 412 80.646 52.877 83.964 1.00 0.00 H
ATOM 6622 HD23 LEU A 412 80.497 51.176 83.881 1.00 0.00 H
ATOM 6623 N LEU A 413 76.293 53.995 81.281 1.00 0.00 N
ATOM 6624 CA LEU A 413 75.128 54.339 82.124 1.00 0.00 C
ATOM 6625 C LEU A 413 75.394 54.587 83.659 1.00 0.00 C
ATOM 6626 O LEU A 413 76.240 53.918 84.259 1.00 0.00 O
ATOM 6627 CB LEU A 413 73.980 53.318 81.767 1.00 0.00 C
ATOM 6628 CG LEU A 413 72.587 53.738 82.255 1.00 0.00 C
ATOM 6629 CD1 LEU A 413 72.061 54.997 81.558 1.00 0.00 C
ATOM 6630 CD2 LEU A 413 71.547 52.682 81.891 1.00 0.00 C
ATOM 6631 H LEU A 413 76.321 53.047 80.936 1.00 0.00 H
ATOM 6632 HA LEU A 413 74.902 55.342 81.762 1.00 0.00 H
ATOM 6633 HB2 LEU A 413 74.002 53.118 80.696 1.00 0.00 H
ATOM 6634 HB3 LEU A 413 74.270 52.390 82.260 1.00 0.00 H
ATOM 6635 HG LEU A 413 72.569 53.838 83.340 1.00 0.00 H
ATOM 6636 HD11 LEU A 413 72.733 55.814 81.819 1.00 0.00 H
ATOM 6637 HD12 LEU A 413 72.070 54.914 80.471 1.00 0.00 H
ATOM 6638 HD13 LEU A 413 71.042 55.237 81.860 1.00 0.00 H
ATOM 6639 HD21 LEU A 413 70.536 53.061 82.043 1.00 0.00 H
ATOM 6640 HD22 LEU A 413 71.596 52.449 80.827 1.00 0.00 H
ATOM 6641 HD23 LEU A 413 71.761 51.745 82.405 1.00 0.00 H
ATOM 6642 N ASP A 414 74.658 55.545 84.284 1.00 0.00 N
ATOM 6643 CA ASP A 414 74.795 55.814 85.709 1.00 0.00 C
ATOM 6644 C ASP A 414 74.159 54.770 86.544 1.00 0.00 C
ATOM 6645 O ASP A 414 74.307 54.757 87.771 1.00 0.00 O
ATOM 6646 CB ASP A 414 74.295 57.197 86.038 1.00 0.00 C
ATOM 6647 CG ASP A 414 72.883 57.508 85.383 1.00 0.00 C
ATOM 6648 OD1 ASP A 414 72.217 56.586 84.925 1.00 0.00 O
ATOM 6649 OD2 ASP A 414 72.408 58.695 85.416 1.00 0.00 O1-
ATOM 6650 H ASP A 414 74.022 56.074 83.705 1.00 0.00 H
ATOM 6651 HA ASP A 414 75.859 55.719 85.926 1.00 0.00 H
ATOM 6652 HB2 ASP A 414 74.192 57.298 87.118 1.00 0.00 H
ATOM 6653 HB3 ASP A 414 74.968 57.918 85.573 1.00 0.00 H
ATOM 6654 N ARG A 415 73.294 53.863 86.008 1.00 0.00 N
ATOM 6655 CA ARG A 415 72.657 52.746 86.737 1.00 0.00 C
ATOM 6656 C ARG A 415 73.644 51.759 87.405 1.00 0.00 C
ATOM 6657 O ARG A 415 73.486 51.327 88.569 1.00 0.00 O
ATOM 6658 CB ARG A 415 71.893 52.052 85.620 1.00 0.00 C
ATOM 6659 CG ARG A 415 70.918 51.055 86.344 1.00 0.00 C
ATOM 6660 CD ARG A 415 70.104 50.191 85.431 1.00 0.00 C
ATOM 6661 NE ARG A 415 70.911 49.223 84.562 1.00 0.00 N
ATOM 6662 CZ ARG A 415 70.523 48.035 84.340 1.00 0.00 C
ATOM 6663 NH1 ARG A 415 69.353 47.609 84.589 1.00 0.00 N1+
ATOM 6664 NH2 ARG A 415 71.416 47.255 83.737 1.00 0.00 N
ATOM 6665 H ARG A 415 72.980 53.928 85.050 1.00 0.00 H
ATOM 6666 HA ARG A 415 71.959 53.164 87.462 1.00 0.00 H
ATOM 6667 HB2 ARG A 415 71.356 52.811 85.049 1.00 0.00 H
ATOM 6668 HB3 ARG A 415 72.653 51.614 84.974 1.00 0.00 H
ATOM 6669 HG2 ARG A 415 71.488 50.486 87.078 1.00 0.00 H
ATOM 6670 HG3 ARG A 415 70.179 51.540 86.982 1.00 0.00 H
ATOM 6671 HD2 ARG A 415 69.348 49.635 85.986 1.00 0.00 H
ATOM 6672 HD3 ARG A 415 69.611 50.875 84.741 1.00 0.00 H
ATOM 6673 HE ARG A 415 71.750 49.481 84.062 1.00 0.00 H
ATOM 6674 HH11 ARG A 415 68.713 48.202 85.097 1.00 0.00 H
ATOM 6675 HH12 ARG A 415 69.008 46.779 84.130 1.00 0.00 H
ATOM 6676 HH21 ARG A 415 72.336 47.653 83.613 1.00 0.00 H
ATOM 6677 HH22 ARG A 415 71.163 46.294 83.555 1.00 0.00 H
ATOM 6678 N GLU A 416 74.624 51.368 86.577 1.00 0.00 N
ATOM 6679 CA GLU A 416 75.232 50.083 86.701 1.00 0.00 C
ATOM 6680 C GLU A 416 75.979 49.819 88.099 1.00 0.00 C
ATOM 6681 O GLU A 416 76.682 50.700 88.543 1.00 0.00 O
ATOM 6682 CB GLU A 416 76.173 49.815 85.520 1.00 0.00 C
ATOM 6683 CG GLU A 416 75.477 50.042 84.148 1.00 0.00 C
ATOM 6684 CD GLU A 416 74.178 49.262 83.918 1.00 0.00 C
ATOM 6685 OE1 GLU A 416 73.382 49.731 83.074 1.00 0.00 O
ATOM 6686 OE2 GLU A 416 73.924 48.250 84.579 1.00 0.00 O1-
ATOM 6687 H GLU A 416 74.569 51.880 85.708 1.00 0.00 H
ATOM 6688 HA GLU A 416 74.430 49.355 86.574 1.00 0.00 H
ATOM 6689 HB2 GLU A 416 77.058 50.446 85.431 1.00 0.00 H
ATOM 6690 HB3 GLU A 416 76.416 48.753 85.535 1.00 0.00 H
ATOM 6691 HG2 GLU A 416 75.168 51.087 84.147 1.00 0.00 H
ATOM 6692 HG3 GLU A 416 76.190 49.845 83.348 1.00 0.00 H
ATOM 6693 N GLU A 417 75.749 48.689 88.786 1.00 0.00 N
ATOM 6694 CA GLU A 417 76.483 48.122 89.930 1.00 0.00 C
ATOM 6695 C GLU A 417 77.394 46.874 89.549 1.00 0.00 C
ATOM 6696 O GLU A 417 78.287 46.522 90.328 1.00 0.00 O
ATOM 6697 CB GLU A 417 75.544 47.775 91.087 1.00 0.00 C
ATOM 6698 CG GLU A 417 74.578 48.934 91.519 1.00 0.00 C
ATOM 6699 CD GLU A 417 75.391 50.215 91.920 1.00 0.00 C
ATOM 6700 OE1 GLU A 417 74.784 51.350 92.070 1.00 0.00 O
ATOM 6701 OE2 GLU A 417 76.550 50.161 92.426 1.00 0.00 O1-
ATOM 6702 H GLU A 417 75.070 48.095 88.331 1.00 0.00 H
ATOM 6703 HA GLU A 417 77.152 48.930 90.226 1.00 0.00 H
ATOM 6704 HB2 GLU A 417 75.011 46.866 90.807 1.00 0.00 H
ATOM 6705 HB3 GLU A 417 76.166 47.456 91.924 1.00 0.00 H
ATOM 6706 HG2 GLU A 417 73.875 49.146 90.713 1.00 0.00 H
ATOM 6707 HG3 GLU A 417 74.108 48.602 92.444 1.00 0.00 H
ATOM 6708 N ARG A 418 77.155 46.153 88.435 1.00 0.00 N
ATOM 6709 CA ARG A 418 77.877 44.971 87.893 1.00 0.00 C
ATOM 6710 C ARG A 418 78.321 45.149 86.436 1.00 0.00 C
ATOM 6711 O ARG A 418 77.471 45.472 85.615 1.00 0.00 O
ATOM 6712 CB ARG A 418 77.208 43.653 88.252 1.00 0.00 C
ATOM 6713 CG ARG A 418 77.791 42.966 89.468 1.00 0.00 C
ATOM 6714 CD ARG A 418 76.857 42.119 90.281 1.00 0.00 C
ATOM 6715 NE ARG A 418 76.038 42.942 91.147 1.00 0.00 N
ATOM 6716 CZ ARG A 418 76.507 43.494 92.273 1.00 0.00 C
ATOM 6717 NH1 ARG A 418 77.781 43.395 92.675 1.00 0.00 N1+
ATOM 6718 NH2 ARG A 418 75.674 44.188 93.037 1.00 0.00 N
ATOM 6719 H ARG A 418 76.328 46.413 87.917 1.00 0.00 H
ATOM 6720 HA ARG A 418 78.846 44.900 88.388 1.00 0.00 H
ATOM 6721 HB2 ARG A 418 76.184 43.974 88.441 1.00 0.00 H
ATOM 6722 HB3 ARG A 418 77.076 42.989 87.398 1.00 0.00 H
ATOM 6723 HG2 ARG A 418 78.589 42.299 89.140 1.00 0.00 H
ATOM 6724 HG3 ARG A 418 78.257 43.725 90.096 1.00 0.00 H
ATOM 6725 HD2 ARG A 418 76.208 41.652 89.540 1.00 0.00 H
ATOM 6726 HD3 ARG A 418 77.398 41.305 90.763 1.00 0.00 H
ATOM 6727 HE ARG A 418 75.071 43.042 90.874 1.00 0.00 H
ATOM 6728 HH11 ARG A 418 78.332 42.784 92.088 1.00 0.00 H
ATOM 6729 HH12 ARG A 418 78.205 44.003 93.361 1.00 0.00 H
ATOM 6730 HH21 ARG A 418 74.733 44.415 92.751 1.00 0.00 H
ATOM 6731 HH22 ARG A 418 76.033 44.554 93.908 1.00 0.00 H
ATOM 6732 N ILE A 419 79.554 44.811 86.156 1.00 0.00 N
ATOM 6733 CA ILE A 419 80.151 44.824 84.814 1.00 0.00 C
ATOM 6734 C ILE A 419 81.115 43.688 84.576 1.00 0.00 C
ATOM 6735 O ILE A 419 82.011 43.379 85.379 1.00 0.00 O
ATOM 6736 CB ILE A 419 80.967 46.064 84.674 1.00 0.00 C
ATOM 6737 CG1 ILE A 419 80.432 47.458 85.237 1.00 0.00 C
ATOM 6738 CG2 ILE A 419 81.460 46.200 83.199 1.00 0.00 C
ATOM 6739 CD1 ILE A 419 79.298 48.101 84.435 1.00 0.00 C
ATOM 6740 H ILE A 419 80.221 44.676 86.903 1.00 0.00 H
ATOM 6741 HA ILE A 419 79.295 44.729 84.146 1.00 0.00 H
ATOM 6742 HB ILE A 419 81.933 46.046 85.178 1.00 0.00 H
ATOM 6743 HG12 ILE A 419 80.112 47.412 86.279 1.00 0.00 H
ATOM 6744 HG13 ILE A 419 81.336 48.067 85.235 1.00 0.00 H
ATOM 6745 HG21 ILE A 419 81.860 47.196 83.006 1.00 0.00 H
ATOM 6746 HG22 ILE A 419 82.206 45.447 82.943 1.00 0.00 H
ATOM 6747 HG23 ILE A 419 80.550 46.182 82.600 1.00 0.00 H
ATOM 6748 HD11 ILE A 419 78.392 47.530 84.637 1.00 0.00 H
ATOM 6749 HD12 ILE A 419 79.070 49.108 84.784 1.00 0.00 H
ATOM 6750 HD13 ILE A 419 79.372 48.039 83.349 1.00 0.00 H
ATOM 6751 N THR A 420 81.089 43.092 83.362 1.00 0.00 N
ATOM 6752 CA THR A 420 81.994 41.977 83.009 1.00 0.00 C
ATOM 6753 C THR A 420 83.478 42.079 83.167 1.00 0.00 C
ATOM 6754 O THR A 420 84.094 41.057 83.608 1.00 0.00 O
ATOM 6755 CB THR A 420 81.596 41.450 81.529 1.00 0.00 C
ATOM 6756 CG2 THR A 420 82.183 40.133 81.034 1.00 0.00 C
ATOM 6757 OG1 THR A 420 80.197 41.283 81.261 1.00 0.00 O
ATOM 6758 H THR A 420 80.557 43.511 82.613 1.00 0.00 H
ATOM 6759 HA THR A 420 81.722 41.107 83.607 1.00 0.00 H
ATOM 6760 HB THR A 420 82.104 42.113 80.829 1.00 0.00 H
ATOM 6761 HG1 THR A 420 79.680 42.071 81.078 1.00 0.00 H
ATOM 6762 HG21 THR A 420 81.959 39.498 81.892 1.00 0.00 H
ATOM 6763 HG22 THR A 420 81.617 39.967 80.118 1.00 0.00 H
ATOM 6764 HG23 THR A 420 83.237 40.194 80.766 1.00 0.00 H
ATOM 6765 N ASP A 421 84.180 43.187 82.869 1.00 0.00 N
ATOM 6766 CA ASP A 421 85.664 43.215 82.936 1.00 0.00 C
ATOM 6767 C ASP A 421 86.048 44.739 83.176 1.00 0.00 C
ATOM 6768 O ASP A 421 85.459 45.617 82.566 1.00 0.00 O
ATOM 6769 CB ASP A 421 86.313 42.601 81.737 1.00 0.00 C
ATOM 6770 CG ASP A 421 87.873 42.770 81.549 1.00 0.00 C
ATOM 6771 OD1 ASP A 421 88.668 42.773 82.489 1.00 0.00 O
ATOM 6772 OD2 ASP A 421 88.228 42.894 80.330 1.00 0.00 O1-
ATOM 6773 H ASP A 421 83.772 44.023 82.474 1.00 0.00 H
ATOM 6774 HA ASP A 421 85.978 42.665 83.824 1.00 0.00 H
ATOM 6775 HB2 ASP A 421 86.063 41.541 81.706 1.00 0.00 H
ATOM 6776 HB3 ASP A 421 85.826 43.057 80.874 1.00 0.00 H
ATOM 6777 N LEU A 422 87.058 44.981 83.982 1.00 0.00 N
ATOM 6778 CA LEU A 422 87.609 46.256 84.488 1.00 0.00 C
ATOM 6779 C LEU A 422 89.081 46.089 85.102 1.00 0.00 C
ATOM 6780 O LEU A 422 89.426 45.056 85.639 1.00 0.00 O
ATOM 6781 CB LEU A 422 86.700 46.945 85.569 1.00 0.00 C
ATOM 6782 CG LEU A 422 85.208 47.254 85.196 1.00 0.00 C
ATOM 6783 CD1 LEU A 422 84.615 47.782 86.462 1.00 0.00 C
ATOM 6784 CD2 LEU A 422 84.862 48.389 84.168 1.00 0.00 C
ATOM 6785 H LEU A 422 87.457 44.191 84.468 1.00 0.00 H
ATOM 6786 HA LEU A 422 87.604 46.839 83.567 1.00 0.00 H
ATOM 6787 HB2 LEU A 422 86.772 46.320 86.459 1.00 0.00 H
ATOM 6788 HB3 LEU A 422 87.085 47.925 85.850 1.00 0.00 H
ATOM 6789 HG LEU A 422 84.710 46.339 84.876 1.00 0.00 H
ATOM 6790 HD11 LEU A 422 85.334 48.473 86.904 1.00 0.00 H
ATOM 6791 HD12 LEU A 422 83.704 48.344 86.260 1.00 0.00 H
ATOM 6792 HD13 LEU A 422 84.254 46.960 87.080 1.00 0.00 H
ATOM 6793 HD21 LEU A 422 85.409 49.297 84.420 1.00 0.00 H
ATOM 6794 HD22 LEU A 422 85.269 48.110 83.197 1.00 0.00 H
ATOM 6795 HD23 LEU A 422 83.791 48.553 84.046 1.00 0.00 H
ATOM 6796 N PRO A 423 89.823 47.181 85.141 1.00 0.00 N
ATOM 6797 CA PRO A 423 89.621 48.448 84.353 1.00 0.00 C
ATOM 6798 C PRO A 423 89.667 48.248 82.850 1.00 0.00 C
ATOM 6799 O PRO A 423 90.009 47.231 82.292 1.00 0.00 O
ATOM 6800 CB PRO A 423 90.815 49.302 84.777 1.00 0.00 C
ATOM 6801 CG PRO A 423 90.992 48.930 86.225 1.00 0.00 C
ATOM 6802 CD PRO A 423 90.918 47.405 86.004 1.00 0.00 C
ATOM 6803 HA PRO A 423 88.701 48.927 84.688 1.00 0.00 H
ATOM 6804 HB2 PRO A 423 91.729 49.117 84.212 1.00 0.00 H
ATOM 6805 HB3 PRO A 423 90.489 50.338 84.688 1.00 0.00 H
ATOM 6806 HG2 PRO A 423 92.027 49.147 86.485 1.00 0.00 H
ATOM 6807 HG3 PRO A 423 90.251 49.230 86.966 1.00 0.00 H
ATOM 6808 HD2 PRO A 423 91.824 47.129 85.464 1.00 0.00 H
ATOM 6809 HD3 PRO A 423 90.838 46.864 86.947 1.00 0.00 H
ATOM 6810 N LEU A 424 89.473 49.303 82.044 1.00 0.00 N
ATOM 6811 CA LEU A 424 89.415 49.207 80.526 1.00 0.00 C
ATOM 6812 C LEU A 424 90.700 49.695 79.869 1.00 0.00 C
ATOM 6813 O LEU A 424 90.720 50.081 78.724 1.00 0.00 O
ATOM 6814 CB LEU A 424 88.266 50.159 79.997 1.00 0.00 C
ATOM 6815 CG LEU A 424 86.841 49.716 80.581 1.00 0.00 C
ATOM 6816 CD1 LEU A 424 85.768 50.659 80.041 1.00 0.00 C
ATOM 6817 CD2 LEU A 424 86.450 48.240 80.283 1.00 0.00 C
ATOM 6818 H LEU A 424 89.118 50.169 82.425 1.00 0.00 H
ATOM 6819 HA LEU A 424 89.247 48.187 80.181 1.00 0.00 H
ATOM 6820 HB2 LEU A 424 88.426 51.159 80.402 1.00 0.00 H
ATOM 6821 HB3 LEU A 424 88.326 50.018 78.918 1.00 0.00 H
ATOM 6822 HG LEU A 424 86.878 49.832 81.664 1.00 0.00 H
ATOM 6823 HD11 LEU A 424 85.717 50.612 78.953 1.00 0.00 H
ATOM 6824 HD12 LEU A 424 84.772 50.345 80.351 1.00 0.00 H
ATOM 6825 HD13 LEU A 424 85.846 51.704 80.341 1.00 0.00 H
ATOM 6826 HD21 LEU A 424 85.448 48.165 80.706 1.00 0.00 H
ATOM 6827 HD22 LEU A 424 86.458 48.000 79.220 1.00 0.00 H
ATOM 6828 HD23 LEU A 424 87.155 47.567 80.772 1.00 0.00 H
ATOM 6829 N ASP A 425 91.844 49.695 80.646 1.00 0.00 N
ATOM 6830 CA ASP A 425 93.170 50.284 80.390 1.00 0.00 C
ATOM 6831 C ASP A 425 93.868 49.715 79.148 1.00 0.00 C
ATOM 6832 O ASP A 425 94.255 50.482 78.201 1.00 0.00 O
ATOM 6833 CB ASP A 425 94.133 50.100 81.582 1.00 0.00 C
ATOM 6834 CG ASP A 425 93.612 50.458 82.975 1.00 0.00 C
ATOM 6835 OD1 ASP A 425 92.853 51.371 83.252 1.00 0.00 O
ATOM 6836 OD2 ASP A 425 94.272 49.991 83.946 1.00 0.00 O1-
ATOM 6837 H ASP A 425 91.666 49.337 81.574 1.00 0.00 H
ATOM 6838 HA ASP A 425 93.106 51.363 80.255 1.00 0.00 H
ATOM 6839 HB2 ASP A 425 94.552 49.093 81.583 1.00 0.00 H
ATOM 6840 HB3 ASP A 425 94.935 50.809 81.378 1.00 0.00 H
ATOM 6841 N ASN A 426 94.002 48.426 79.018 1.00 0.00 N
ATOM 6842 CA ASN A 426 94.591 47.840 77.882 1.00 0.00 C
ATOM 6843 C ASN A 426 93.659 47.826 76.674 1.00 0.00 C
ATOM 6844 O ASN A 426 94.111 48.095 75.531 1.00 0.00 O
ATOM 6845 CB ASN A 426 95.163 46.491 78.294 1.00 0.00 C
ATOM 6846 CG ASN A 426 96.226 46.653 79.321 1.00 0.00 C
ATOM 6847 ND2 ASN A 426 95.982 46.030 80.443 1.00 0.00 N
ATOM 6848 OD1 ASN A 426 97.269 47.189 79.128 1.00 0.00 O
ATOM 6849 H ASN A 426 93.873 47.831 79.824 1.00 0.00 H
ATOM 6850 HA ASN A 426 95.398 48.475 77.517 1.00 0.00 H
ATOM 6851 HB2 ASN A 426 94.319 45.916 78.676 1.00 0.00 H
ATOM 6852 HB3 ASN A 426 95.603 46.074 77.388 1.00 0.00 H
ATOM 6853 HD21 ASN A 426 96.502 46.222 81.287 1.00 0.00 H
ATOM 6854 HD22 ASN A 426 95.083 45.569 80.437 1.00 0.00 H
ATOM 6855 N GLY A 427 92.312 47.690 76.907 1.00 0.00 N
ATOM 6856 CA GLY A 427 91.382 47.766 75.746 1.00 0.00 C
ATOM 6857 C GLY A 427 91.334 49.178 75.139 1.00 0.00 C
ATOM 6858 O GLY A 427 91.161 49.294 73.944 1.00 0.00 O
ATOM 6859 H GLY A 427 92.004 47.422 77.831 1.00 0.00 H
ATOM 6860 HA2 GLY A 427 91.766 47.098 74.975 1.00 0.00 H
ATOM 6861 HA3 GLY A 427 90.380 47.457 76.044 1.00 0.00 H
ATOM 6862 N VAL A 428 91.565 50.211 75.953 1.00 0.00 N
ATOM 6863 CA VAL A 428 91.523 51.637 75.467 1.00 0.00 C
ATOM 6864 C VAL A 428 92.815 52.149 74.838 1.00 0.00 C
ATOM 6865 O VAL A 428 92.815 52.785 73.801 1.00 0.00 O
ATOM 6866 CB VAL A 428 90.962 52.568 76.500 1.00 0.00 C
ATOM 6867 CG1 VAL A 428 91.814 52.990 77.641 1.00 0.00 C
ATOM 6868 CG2 VAL A 428 90.329 53.861 75.896 1.00 0.00 C
ATOM 6869 H VAL A 428 91.676 50.001 76.934 1.00 0.00 H
ATOM 6870 HA VAL A 428 90.764 51.598 74.685 1.00 0.00 H
ATOM 6871 HB VAL A 428 90.113 52.082 76.981 1.00 0.00 H
ATOM 6872 HG11 VAL A 428 91.140 53.466 78.353 1.00 0.00 H
ATOM 6873 HG12 VAL A 428 92.140 52.081 78.146 1.00 0.00 H
ATOM 6874 HG13 VAL A 428 92.669 53.619 77.393 1.00 0.00 H
ATOM 6875 HG21 VAL A 428 89.771 54.424 76.645 1.00 0.00 H
ATOM 6876 HG22 VAL A 428 91.159 54.450 75.508 1.00 0.00 H
ATOM 6877 HG23 VAL A 428 89.726 53.545 75.045 1.00 0.00 H
ATOM 6878 N ARG A 429 93.988 51.812 75.375 1.00 0.00 N
ATOM 6879 CA ARG A 429 95.273 51.819 74.727 1.00 0.00 C
ATOM 6880 C ARG A 429 95.207 51.154 73.336 1.00 0.00 C
ATOM 6881 O ARG A 429 95.634 51.813 72.380 1.00 0.00 O
ATOM 6882 CB ARG A 429 96.357 51.222 75.632 1.00 0.00 C
ATOM 6883 CG ARG A 429 97.719 50.996 74.999 1.00 0.00 C
ATOM 6884 CD ARG A 429 98.681 50.282 76.009 1.00 0.00 C
ATOM 6885 NE ARG A 429 100.035 49.971 75.462 1.00 0.00 N
ATOM 6886 CZ ARG A 429 100.255 49.160 74.459 1.00 0.00 C
ATOM 6887 NH1 ARG A 429 99.371 48.270 74.091 1.00 0.00 N1+
ATOM 6888 NH2 ARG A 429 101.371 49.130 73.720 1.00 0.00 N
ATOM 6889 H ARG A 429 93.940 51.374 76.284 1.00 0.00 H
ATOM 6890 HA ARG A 429 95.517 52.866 74.545 1.00 0.00 H
ATOM 6891 HB2 ARG A 429 96.464 51.901 76.477 1.00 0.00 H
ATOM 6892 HB3 ARG A 429 96.145 50.206 75.966 1.00 0.00 H
ATOM 6893 HG2 ARG A 429 97.592 50.413 74.087 1.00 0.00 H
ATOM 6894 HG3 ARG A 429 98.203 51.930 74.713 1.00 0.00 H
ATOM 6895 HD2 ARG A 429 98.904 51.040 76.760 1.00 0.00 H
ATOM 6896 HD3 ARG A 429 98.192 49.467 76.541 1.00 0.00 H
ATOM 6897 HE ARG A 429 100.826 50.559 75.682 1.00 0.00 H
ATOM 6898 HH11 ARG A 429 98.612 48.217 74.755 1.00 0.00 H
ATOM 6899 HH12 ARG A 429 99.577 47.616 73.350 1.00 0.00 H
ATOM 6900 HH21 ARG A 429 102.094 49.731 74.090 1.00 0.00 H
ATOM 6901 HH22 ARG A 429 101.588 48.348 73.119 1.00 0.00 H
ATOM 6902 N SER A 430 94.501 50.012 73.183 1.00 0.00 N
ATOM 6903 CA SER A 430 94.335 49.339 71.869 1.00 0.00 C
ATOM 6904 C SER A 430 93.484 50.129 70.939 1.00 0.00 C
ATOM 6905 O SER A 430 93.841 50.352 69.788 1.00 0.00 O
ATOM 6906 CB SER A 430 93.762 47.931 72.003 1.00 0.00 C
ATOM 6907 OG SER A 430 94.572 47.121 72.814 1.00 0.00 O
ATOM 6908 H SER A 430 94.047 49.719 74.036 1.00 0.00 H
ATOM 6909 HA SER A 430 95.317 49.307 71.396 1.00 0.00 H
ATOM 6910 HB2 SER A 430 92.820 47.976 72.550 1.00 0.00 H
ATOM 6911 HB3 SER A 430 93.626 47.398 71.063 1.00 0.00 H
ATOM 6912 HG SER A 430 94.436 46.181 72.670 1.00 0.00 H
ATOM 6913 N LEU A 431 92.303 50.642 71.422 1.00 0.00 N
ATOM 6914 CA LEU A 431 91.504 51.522 70.663 1.00 0.00 C
ATOM 6915 C LEU A 431 92.404 52.742 70.199 1.00 0.00 C
ATOM 6916 O LEU A 431 92.356 53.071 68.996 1.00 0.00 O
ATOM 6917 CB LEU A 431 90.265 51.947 71.503 1.00 0.00 C
ATOM 6918 CG LEU A 431 89.075 52.431 70.654 1.00 0.00 C
ATOM 6919 CD1 LEU A 431 87.815 52.313 71.594 1.00 0.00 C
ATOM 6920 CD2 LEU A 431 89.211 53.923 70.409 1.00 0.00 C
ATOM 6921 H LEU A 431 91.977 50.573 72.376 1.00 0.00 H
ATOM 6922 HA LEU A 431 91.208 51.052 69.725 1.00 0.00 H
ATOM 6923 HB2 LEU A 431 89.930 51.040 72.007 1.00 0.00 H
ATOM 6924 HB3 LEU A 431 90.593 52.627 72.289 1.00 0.00 H
ATOM 6925 HG LEU A 431 88.920 51.842 69.750 1.00 0.00 H
ATOM 6926 HD11 LEU A 431 86.955 52.737 71.075 1.00 0.00 H
ATOM 6927 HD12 LEU A 431 87.689 51.264 71.864 1.00 0.00 H
ATOM 6928 HD13 LEU A 431 88.014 52.847 72.523 1.00 0.00 H
ATOM 6929 HD21 LEU A 431 90.072 54.182 69.793 1.00 0.00 H
ATOM 6930 HD22 LEU A 431 88.313 54.278 69.904 1.00 0.00 H
ATOM 6931 HD23 LEU A 431 89.236 54.497 71.335 1.00 0.00 H
ATOM 6932 N LEU A 432 93.220 53.365 71.007 1.00 0.00 N
ATOM 6933 CA LEU A 432 93.959 54.598 70.580 1.00 0.00 C
ATOM 6934 C LEU A 432 95.059 54.258 69.606 1.00 0.00 C
ATOM 6935 O LEU A 432 95.045 54.930 68.617 1.00 0.00 O
ATOM 6936 CB LEU A 432 94.449 55.391 71.763 1.00 0.00 C
ATOM 6937 CG LEU A 432 93.331 56.080 72.612 1.00 0.00 C
ATOM 6938 CD1 LEU A 432 93.799 56.368 74.037 1.00 0.00 C
ATOM 6939 CD2 LEU A 432 92.794 57.439 72.127 1.00 0.00 C
ATOM 6940 H LEU A 432 93.353 52.913 71.900 1.00 0.00 H
ATOM 6941 HA LEU A 432 93.272 55.227 70.015 1.00 0.00 H
ATOM 6942 HB2 LEU A 432 95.020 54.767 72.451 1.00 0.00 H
ATOM 6943 HB3 LEU A 432 95.177 56.152 71.481 1.00 0.00 H
ATOM 6944 HG LEU A 432 92.455 55.445 72.749 1.00 0.00 H
ATOM 6945 HD11 LEU A 432 92.900 56.496 74.639 1.00 0.00 H
ATOM 6946 HD12 LEU A 432 94.450 55.598 74.453 1.00 0.00 H
ATOM 6947 HD13 LEU A 432 94.445 57.246 74.033 1.00 0.00 H
ATOM 6948 HD21 LEU A 432 93.547 57.949 71.526 1.00 0.00 H
ATOM 6949 HD22 LEU A 432 91.930 57.372 71.466 1.00 0.00 H
ATOM 6950 HD23 LEU A 432 92.409 58.078 72.922 1.00 0.00 H
ATOM 6951 N ILE A 433 95.960 53.276 69.881 1.00 0.00 N
ATOM 6952 CA ILE A 433 96.959 52.850 68.864 1.00 0.00 C
ATOM 6953 C ILE A 433 96.270 52.570 67.524 1.00 0.00 C
ATOM 6954 O ILE A 433 96.689 53.069 66.463 1.00 0.00 O
ATOM 6955 CB ILE A 433 97.694 51.553 69.315 1.00 0.00 C
ATOM 6956 CG1 ILE A 433 98.496 51.860 70.561 1.00 0.00 C
ATOM 6957 CG2 ILE A 433 98.606 51.068 68.213 1.00 0.00 C
ATOM 6958 CD1 ILE A 433 98.713 50.613 71.457 1.00 0.00 C
ATOM 6959 H ILE A 433 95.875 52.708 70.712 1.00 0.00 H
ATOM 6960 HA ILE A 433 97.708 53.601 68.614 1.00 0.00 H
ATOM 6961 HB ILE A 433 96.879 50.851 69.491 1.00 0.00 H
ATOM 6962 HG12 ILE A 433 99.438 52.349 70.311 1.00 0.00 H
ATOM 6963 HG13 ILE A 433 97.914 52.463 71.258 1.00 0.00 H
ATOM 6964 HG21 ILE A 433 99.232 50.238 68.540 1.00 0.00 H
ATOM 6965 HG22 ILE A 433 97.916 50.745 67.434 1.00 0.00 H
ATOM 6966 HG23 ILE A 433 99.330 51.838 67.945 1.00 0.00 H
ATOM 6967 HD11 ILE A 433 99.552 50.679 72.151 1.00 0.00 H
ATOM 6968 HD12 ILE A 433 97.835 50.310 72.027 1.00 0.00 H
ATOM 6969 HD13 ILE A 433 99.040 49.802 70.805 1.00 0.00 H
ATOM 6970 N GLY A 434 95.292 51.651 67.418 1.00 0.00 N
ATOM 6971 CA GLY A 434 94.657 51.080 66.181 1.00 0.00 C
ATOM 6972 C GLY A 434 93.729 52.054 65.442 1.00 0.00 C
ATOM 6973 O GLY A 434 93.759 52.167 64.222 1.00 0.00 O
ATOM 6974 H GLY A 434 95.000 51.187 68.266 1.00 0.00 H
ATOM 6975 HA2 GLY A 434 95.427 50.938 65.422 1.00 0.00 H
ATOM 6976 HA3 GLY A 434 94.139 50.141 66.376 1.00 0.00 H
ATOM 6977 N CYS A 435 92.962 52.877 66.154 1.00 0.00 N
ATOM 6978 CA CYS A 435 92.107 53.891 65.629 1.00 0.00 C
ATOM 6979 C CYS A 435 92.733 55.230 65.578 1.00 0.00 C
ATOM 6980 O CYS A 435 92.252 56.194 66.183 1.00 0.00 O
ATOM 6981 CB CYS A 435 90.829 53.832 66.364 1.00 0.00 C
ATOM 6982 SG CYS A 435 90.083 52.218 66.515 1.00 0.00 S
ATOM 6983 H CYS A 435 92.939 52.760 67.157 1.00 0.00 H
ATOM 6984 HA CYS A 435 91.959 53.606 64.587 1.00 0.00 H
ATOM 6985 HB2 CYS A 435 90.955 54.238 67.368 1.00 0.00 H
ATOM 6986 HB3 CYS A 435 90.076 54.530 66.000 1.00 0.00 H
ATOM 6987 HG CYS A 435 89.685 52.196 65.240 1.00 0.00 H
ATOM 6988 N LYS A 436 93.904 55.241 64.918 1.00 0.00 N
ATOM 6989 CA LYS A 436 94.760 56.504 64.866 1.00 0.00 C
ATOM 6990 C LYS A 436 94.154 57.806 64.257 1.00 0.00 C
ATOM 6991 O LYS A 436 94.548 58.883 64.584 1.00 0.00 O
ATOM 6992 CB LYS A 436 96.155 56.021 64.477 1.00 0.00 C
ATOM 6993 CG LYS A 436 97.268 57.108 64.507 1.00 0.00 C
ATOM 6994 CD LYS A 436 98.699 56.436 64.488 1.00 0.00 C
ATOM 6995 CE LYS A 436 99.758 57.283 63.819 1.00 0.00 C
ATOM 6996 NZ LYS A 436 100.987 56.446 63.683 1.00 0.00 N1+
ATOM 6997 H LYS A 436 94.178 54.564 64.221 1.00 0.00 H
ATOM 6998 HA LYS A 436 94.993 56.701 65.912 1.00 0.00 H
ATOM 6999 HB2 LYS A 436 96.444 55.206 65.141 1.00 0.00 H
ATOM 7000 HB3 LYS A 436 95.943 55.584 63.502 1.00 0.00 H
ATOM 7001 HG2 LYS A 436 97.078 57.654 63.584 1.00 0.00 H
ATOM 7002 HG3 LYS A 436 97.115 57.790 65.343 1.00 0.00 H
ATOM 7003 HD2 LYS A 436 98.920 56.374 65.553 1.00 0.00 H
ATOM 7004 HD3 LYS A 436 98.684 55.441 64.041 1.00 0.00 H
ATOM 7005 HE2 LYS A 436 99.304 57.534 62.860 1.00 0.00 H
ATOM 7006 HE3 LYS A 436 99.815 58.180 64.435 1.00 0.00 H
ATOM 7007 HZ1 LYS A 436 101.778 57.062 63.804 1.00 0.00 H
ATOM 7008 HZ2 LYS A 436 101.036 55.619 64.261 1.00 0.00 H
ATOM 7009 HZ3 LYS A 436 100.918 56.068 62.749 1.00 0.00 H
ATOM 7010 N LYS A 437 93.134 57.688 63.470 1.00 0.00 N
ATOM 7011 CA LYS A 437 92.456 58.786 62.866 1.00 0.00 C
ATOM 7012 C LYS A 437 91.552 59.630 63.840 1.00 0.00 C
ATOM 7013 O LYS A 437 91.130 60.666 63.355 1.00 0.00 O
ATOM 7014 CB LYS A 437 91.551 58.240 61.767 1.00 0.00 C
ATOM 7015 CG LYS A 437 92.236 58.112 60.406 1.00 0.00 C
ATOM 7016 CD LYS A 437 91.356 57.436 59.315 1.00 0.00 C
ATOM 7017 CE LYS A 437 92.158 57.171 58.022 1.00 0.00 C
ATOM 7018 NZ LYS A 437 91.323 56.895 56.819 1.00 0.00 N1+
ATOM 7019 H LYS A 437 92.834 56.773 63.166 1.00 0.00 H
ATOM 7020 HA LYS A 437 93.092 59.506 62.352 1.00 0.00 H
ATOM 7021 HB2 LYS A 437 91.109 57.266 61.980 1.00 0.00 H
ATOM 7022 HB3 LYS A 437 90.752 58.974 61.665 1.00 0.00 H
ATOM 7023 HG2 LYS A 437 92.620 59.074 60.066 1.00 0.00 H
ATOM 7024 HG3 LYS A 437 93.133 57.506 60.532 1.00 0.00 H
ATOM 7025 HD2 LYS A 437 91.139 56.426 59.663 1.00 0.00 H
ATOM 7026 HD3 LYS A 437 90.426 57.996 59.218 1.00 0.00 H
ATOM 7027 HE2 LYS A 437 92.962 57.885 57.843 1.00 0.00 H
ATOM 7028 HE3 LYS A 437 92.817 56.328 58.225 1.00 0.00 H
ATOM 7029 HZ1 LYS A 437 91.876 56.817 55.978 1.00 0.00 H
ATOM 7030 HZ2 LYS A 437 90.826 56.018 56.884 1.00 0.00 H
ATOM 7031 HZ3 LYS A 437 90.624 57.625 56.823 1.00 0.00 H
ATOM 7032 N LEU A 438 91.273 59.160 65.009 1.00 0.00 N
ATOM 7033 CA LEU A 438 90.435 59.929 65.971 1.00 0.00 C
ATOM 7034 C LEU A 438 90.955 61.302 66.301 1.00 0.00 C
ATOM 7035 O LEU A 438 91.903 61.434 67.115 1.00 0.00 O
ATOM 7036 CB LEU A 438 90.209 59.214 67.329 1.00 0.00 C
ATOM 7037 CG LEU A 438 89.492 57.828 67.246 1.00 0.00 C
ATOM 7038 CD1 LEU A 438 89.743 57.044 68.532 1.00 0.00 C
ATOM 7039 CD2 LEU A 438 88.026 58.057 66.798 1.00 0.00 C
ATOM 7040 H LEU A 438 91.677 58.279 65.294 1.00 0.00 H
ATOM 7041 HA LEU A 438 89.417 60.132 65.637 1.00 0.00 H
ATOM 7042 HB2 LEU A 438 91.143 59.110 67.880 1.00 0.00 H
ATOM 7043 HB3 LEU A 438 89.600 59.862 67.959 1.00 0.00 H
ATOM 7044 HG LEU A 438 90.091 57.257 66.536 1.00 0.00 H
ATOM 7045 HD11 LEU A 438 90.753 56.635 68.557 1.00 0.00 H
ATOM 7046 HD12 LEU A 438 89.551 57.648 69.419 1.00 0.00 H
ATOM 7047 HD13 LEU A 438 89.089 56.173 68.488 1.00 0.00 H
ATOM 7048 HD21 LEU A 438 87.386 57.176 66.853 1.00 0.00 H
ATOM 7049 HD22 LEU A 438 87.534 58.789 67.437 1.00 0.00 H
ATOM 7050 HD23 LEU A 438 87.980 58.493 65.800 1.00 0.00 H
ATOM 7051 N ARG A 439 90.296 62.315 65.697 1.00 0.00 N
ATOM 7052 CA ARG A 439 90.488 63.847 65.918 1.00 0.00 C
ATOM 7053 C ARG A 439 89.560 64.349 67.087 1.00 0.00 C
ATOM 7054 O ARG A 439 89.822 65.330 67.805 1.00 0.00 O
ATOM 7055 CB ARG A 439 89.951 64.546 64.634 1.00 0.00 C
ATOM 7056 CG ARG A 439 90.669 64.233 63.348 1.00 0.00 C
ATOM 7057 CD ARG A 439 92.225 64.629 63.401 1.00 0.00 C
ATOM 7058 NE ARG A 439 92.376 66.089 63.313 1.00 0.00 N
ATOM 7059 CZ ARG A 439 93.533 66.709 63.271 1.00 0.00 C
ATOM 7060 NH1 ARG A 439 94.646 66.070 63.306 1.00 0.00 N1+
ATOM 7061 NH2 ARG A 439 93.555 67.958 63.069 1.00 0.00 N
ATOM 7062 H ARG A 439 89.542 62.059 65.077 1.00 0.00 H
ATOM 7063 HA ARG A 439 91.546 64.051 66.081 1.00 0.00 H
ATOM 7064 HB2 ARG A 439 88.896 64.300 64.512 1.00 0.00 H
ATOM 7065 HB3 ARG A 439 89.982 65.626 64.782 1.00 0.00 H
ATOM 7066 HG2 ARG A 439 90.510 63.192 63.067 1.00 0.00 H
ATOM 7067 HG3 ARG A 439 90.273 64.847 62.538 1.00 0.00 H
ATOM 7068 HD2 ARG A 439 92.608 64.339 64.379 1.00 0.00 H
ATOM 7069 HD3 ARG A 439 92.785 64.169 62.586 1.00 0.00 H
ATOM 7070 HE ARG A 439 91.557 66.655 63.144 1.00 0.00 H
ATOM 7071 HH11 ARG A 439 94.785 65.075 63.408 1.00 0.00 H
ATOM 7072 HH12 ARG A 439 95.467 66.641 63.162 1.00 0.00 H
ATOM 7073 HH21 ARG A 439 92.743 68.507 63.314 1.00 0.00 H
ATOM 7074 HH22 ARG A 439 94.468 68.373 62.950 1.00 0.00 H
ATOM 7075 N ARG A 440 88.415 63.677 67.247 1.00 0.00 N
ATOM 7076 CA ARG A 440 87.513 63.768 68.429 1.00 0.00 C
ATOM 7077 C ARG A 440 87.369 62.410 69.160 1.00 0.00 C
ATOM 7078 O ARG A 440 87.436 61.307 68.565 1.00 0.00 O
ATOM 7079 CB ARG A 440 86.112 64.207 67.853 1.00 0.00 C
ATOM 7080 CG ARG A 440 86.200 65.678 67.179 1.00 0.00 C
ATOM 7081 CD ARG A 440 84.890 66.246 66.703 1.00 0.00 C
ATOM 7082 NE ARG A 440 84.106 65.433 65.700 1.00 0.00 N
ATOM 7083 CZ ARG A 440 84.431 65.127 64.400 1.00 0.00 C
ATOM 7084 NH1 ARG A 440 85.465 65.595 63.893 1.00 0.00 N1+
ATOM 7085 NH2 ARG A 440 83.771 64.168 63.752 1.00 0.00 N
ATOM 7086 H ARG A 440 88.166 63.115 66.445 1.00 0.00 H
ATOM 7087 HA ARG A 440 87.843 64.537 69.126 1.00 0.00 H
ATOM 7088 HB2 ARG A 440 85.824 63.501 67.074 1.00 0.00 H
ATOM 7089 HB3 ARG A 440 85.382 64.114 68.656 1.00 0.00 H
ATOM 7090 HG2 ARG A 440 86.632 66.426 67.843 1.00 0.00 H
ATOM 7091 HG3 ARG A 440 86.779 65.559 66.264 1.00 0.00 H
ATOM 7092 HD2 ARG A 440 84.259 66.451 67.568 1.00 0.00 H
ATOM 7093 HD3 ARG A 440 85.163 67.221 66.300 1.00 0.00 H
ATOM 7094 HE ARG A 440 83.480 64.772 66.138 1.00 0.00 H
ATOM 7095 HH11 ARG A 440 85.955 66.357 64.339 1.00 0.00 H
ATOM 7096 HH12 ARG A 440 85.618 65.283 62.944 1.00 0.00 H
ATOM 7097 HH21 ARG A 440 82.995 63.690 64.187 1.00 0.00 H
ATOM 7098 HH22 ARG A 440 84.259 63.682 63.014 1.00 0.00 H
ATOM 7099 N PHE A 441 87.304 62.536 70.466 1.00 0.00 N
ATOM 7100 CA PHE A 441 87.264 61.435 71.383 1.00 0.00 C
ATOM 7101 C PHE A 441 86.416 61.837 72.668 1.00 0.00 C
ATOM 7102 O PHE A 441 86.483 62.945 73.170 1.00 0.00 O
ATOM 7103 CB PHE A 441 88.691 60.911 71.695 1.00 0.00 C
ATOM 7104 CG PHE A 441 88.748 59.634 72.498 1.00 0.00 C
ATOM 7105 CD1 PHE A 441 89.060 59.628 73.854 1.00 0.00 C
ATOM 7106 CD2 PHE A 441 88.402 58.431 71.839 1.00 0.00 C
ATOM 7107 CE1 PHE A 441 89.170 58.422 74.595 1.00 0.00 C
ATOM 7108 CE2 PHE A 441 88.543 57.208 72.536 1.00 0.00 C
ATOM 7109 CZ PHE A 441 89.020 57.210 73.881 1.00 0.00 C
ATOM 7110 H PHE A 441 87.243 63.445 70.901 1.00 0.00 H
ATOM 7111 HA PHE A 441 86.618 60.668 70.957 1.00 0.00 H
ATOM 7112 HB2 PHE A 441 89.339 60.815 70.823 1.00 0.00 H
ATOM 7113 HB3 PHE A 441 89.082 61.771 72.238 1.00 0.00 H
ATOM 7114 HD1 PHE A 441 89.215 60.584 74.332 1.00 0.00 H
ATOM 7115 HD2 PHE A 441 87.955 58.481 70.857 1.00 0.00 H
ATOM 7116 HE1 PHE A 441 89.161 58.403 75.675 1.00 0.00 H
ATOM 7117 HE2 PHE A 441 88.376 56.256 72.056 1.00 0.00 H
ATOM 7118 HZ PHE A 441 89.224 56.253 74.338 1.00 0.00 H
ATOM 7119 N ALA A 442 85.852 60.876 73.395 1.00 0.00 N
ATOM 7120 CA ALA A 442 85.344 61.097 74.696 1.00 0.00 C
ATOM 7121 C ALA A 442 85.147 59.806 75.470 1.00 0.00 C
ATOM 7122 O ALA A 442 84.540 58.807 75.000 1.00 0.00 O
ATOM 7123 CB ALA A 442 83.892 61.787 74.544 1.00 0.00 C
ATOM 7124 H ALA A 442 85.664 60.016 72.900 1.00 0.00 H
ATOM 7125 HA ALA A 442 86.028 61.745 75.245 1.00 0.00 H
ATOM 7126 HB1 ALA A 442 84.083 62.787 74.155 1.00 0.00 H
ATOM 7127 HB2 ALA A 442 83.287 61.103 73.949 1.00 0.00 H
ATOM 7128 HB3 ALA A 442 83.537 61.881 75.571 1.00 0.00 H
ATOM 7129 N PHE A 443 85.437 59.776 76.751 1.00 0.00 N
ATOM 7130 CA PHE A 443 85.457 58.606 77.552 1.00 0.00 C
ATOM 7131 C PHE A 443 84.945 58.946 78.957 1.00 0.00 C
ATOM 7132 O PHE A 443 85.542 59.699 79.619 1.00 0.00 O
ATOM 7133 CB PHE A 443 86.863 57.978 77.571 1.00 0.00 C
ATOM 7134 CG PHE A 443 86.882 56.485 77.668 1.00 0.00 C
ATOM 7135 CD1 PHE A 443 87.414 55.807 78.757 1.00 0.00 C
ATOM 7136 CD2 PHE A 443 86.326 55.768 76.632 1.00 0.00 C
ATOM 7137 CE1 PHE A 443 87.332 54.412 78.890 1.00 0.00 C
ATOM 7138 CE2 PHE A 443 86.279 54.341 76.703 1.00 0.00 C
ATOM 7139 CZ PHE A 443 86.803 53.669 77.807 1.00 0.00 C
ATOM 7140 H PHE A 443 85.645 60.698 77.105 1.00 0.00 H
ATOM 7141 HA PHE A 443 84.785 57.790 77.284 1.00 0.00 H
ATOM 7142 HB2 PHE A 443 87.341 58.284 76.640 1.00 0.00 H
ATOM 7143 HB3 PHE A 443 87.465 58.510 78.307 1.00 0.00 H
ATOM 7144 HD1 PHE A 443 87.836 56.425 79.535 1.00 0.00 H
ATOM 7145 HD2 PHE A 443 86.084 56.268 75.706 1.00 0.00 H
ATOM 7146 HE1 PHE A 443 87.611 53.876 79.785 1.00 0.00 H
ATOM 7147 HE2 PHE A 443 85.925 53.734 75.883 1.00 0.00 H
ATOM 7148 HZ PHE A 443 86.783 52.589 77.821 1.00 0.00 H
ATOM 7149 N TYR A 444 83.815 58.455 79.259 1.00 0.00 N
ATOM 7150 CA TYR A 444 82.979 58.714 80.483 1.00 0.00 C
ATOM 7151 C TYR A 444 82.644 57.268 81.120 1.00 0.00 C
ATOM 7152 O TYR A 444 82.330 56.275 80.479 1.00 0.00 O
ATOM 7153 CB TYR A 444 81.756 59.547 80.188 1.00 0.00 C
ATOM 7154 CG TYR A 444 80.829 59.827 81.377 1.00 0.00 C
ATOM 7155 CD1 TYR A 444 79.791 58.955 81.739 1.00 0.00 C
ATOM 7156 CD2 TYR A 444 81.003 61.032 82.059 1.00 0.00 C
ATOM 7157 CE1 TYR A 444 79.063 59.144 82.870 1.00 0.00 C
ATOM 7158 CE2 TYR A 444 80.366 61.223 83.291 1.00 0.00 C
ATOM 7159 CZ TYR A 444 79.493 60.209 83.755 1.00 0.00 C
ATOM 7160 OH TYR A 444 78.902 60.312 84.970 1.00 0.00 O
ATOM 7161 H TYR A 444 83.397 57.817 78.598 1.00 0.00 H
ATOM 7162 HA TYR A 444 83.601 59.276 81.179 1.00 0.00 H
ATOM 7163 HB2 TYR A 444 82.189 60.467 79.796 1.00 0.00 H
ATOM 7164 HB3 TYR A 444 81.224 59.122 79.337 1.00 0.00 H
ATOM 7165 HD1 TYR A 444 79.694 58.047 81.161 1.00 0.00 H
ATOM 7166 HD2 TYR A 444 81.618 61.802 81.617 1.00 0.00 H
ATOM 7167 HE1 TYR A 444 78.358 58.364 83.115 1.00 0.00 H
ATOM 7168 HE2 TYR A 444 80.496 62.074 83.944 1.00 0.00 H
ATOM 7169 HH TYR A 444 78.722 59.504 85.454 1.00 0.00 H
ATOM 7170 N LEU A 445 82.742 57.278 82.478 1.00 0.00 N
ATOM 7171 CA LEU A 445 82.605 56.066 83.352 1.00 0.00 C
ATOM 7172 C LEU A 445 81.807 56.317 84.633 1.00 0.00 C
ATOM 7173 O LEU A 445 81.230 57.383 84.889 1.00 0.00 O
ATOM 7174 CB LEU A 445 84.063 55.581 83.666 1.00 0.00 C
ATOM 7175 CG LEU A 445 85.082 55.393 82.569 1.00 0.00 C
ATOM 7176 CD1 LEU A 445 86.479 55.540 83.125 1.00 0.00 C
ATOM 7177 CD2 LEU A 445 84.860 53.994 81.984 1.00 0.00 C
ATOM 7178 H LEU A 445 83.063 58.105 82.961 1.00 0.00 H
ATOM 7179 HA LEU A 445 82.016 55.324 82.812 1.00 0.00 H
ATOM 7180 HB2 LEU A 445 84.479 56.330 84.341 1.00 0.00 H
ATOM 7181 HB3 LEU A 445 84.072 54.684 84.284 1.00 0.00 H
ATOM 7182 HG LEU A 445 84.919 56.116 81.769 1.00 0.00 H
ATOM 7183 HD11 LEU A 445 86.725 56.485 83.608 1.00 0.00 H
ATOM 7184 HD12 LEU A 445 86.801 54.834 83.891 1.00 0.00 H
ATOM 7185 HD13 LEU A 445 87.092 55.321 82.250 1.00 0.00 H
ATOM 7186 HD21 LEU A 445 85.311 54.035 80.993 1.00 0.00 H
ATOM 7187 HD22 LEU A 445 85.390 53.307 82.643 1.00 0.00 H
ATOM 7188 HD23 LEU A 445 83.820 53.792 81.724 1.00 0.00 H
ATOM 7189 N ARG A 446 81.862 55.243 85.493 1.00 0.00 N
ATOM 7190 CA ARG A 446 81.796 55.278 86.975 1.00 0.00 C
ATOM 7191 C ARG A 446 83.265 55.217 87.557 1.00 0.00 C
ATOM 7192 O ARG A 446 84.240 54.823 86.907 1.00 0.00 O
ATOM 7193 CB ARG A 446 80.954 54.062 87.471 1.00 0.00 C
ATOM 7194 CG ARG A 446 79.397 54.228 87.269 1.00 0.00 C
ATOM 7195 CD ARG A 446 78.675 53.254 88.228 1.00 0.00 C
ATOM 7196 NE ARG A 446 78.746 53.685 89.693 1.00 0.00 N
ATOM 7197 CZ ARG A 446 77.817 53.438 90.599 1.00 0.00 C
ATOM 7198 NH1 ARG A 446 76.661 52.747 90.579 1.00 0.00 N1+
ATOM 7199 NH2 ARG A 446 78.035 54.102 91.727 1.00 0.00 N
ATOM 7200 H ARG A 446 82.364 54.431 85.164 1.00 0.00 H
ATOM 7201 HA ARG A 446 81.335 56.205 87.317 1.00 0.00 H
ATOM 7202 HB2 ARG A 446 81.258 53.165 86.932 1.00 0.00 H
ATOM 7203 HB3 ARG A 446 81.189 53.805 88.504 1.00 0.00 H
ATOM 7204 HG2 ARG A 446 79.113 55.221 87.615 1.00 0.00 H
ATOM 7205 HG3 ARG A 446 79.120 54.050 86.230 1.00 0.00 H
ATOM 7206 HD2 ARG A 446 77.617 53.321 87.974 1.00 0.00 H
ATOM 7207 HD3 ARG A 446 78.929 52.204 88.082 1.00 0.00 H
ATOM 7208 HE ARG A 446 79.560 54.199 89.997 1.00 0.00 H
ATOM 7209 HH11 ARG A 446 76.584 52.090 89.816 1.00 0.00 H
ATOM 7210 HH12 ARG A 446 76.048 52.566 91.362 1.00 0.00 H
ATOM 7211 HH21 ARG A 446 78.847 54.695 91.825 1.00 0.00 H
ATOM 7212 HH22 ARG A 446 77.568 53.750 92.551 1.00 0.00 H
ATOM 7213 N GLN A 447 83.364 55.473 88.906 1.00 0.00 N
ATOM 7214 CA GLN A 447 84.672 55.253 89.572 1.00 0.00 C
ATOM 7215 C GLN A 447 85.108 53.769 89.487 1.00 0.00 C
ATOM 7216 O GLN A 447 84.526 52.828 89.982 1.00 0.00 O
ATOM 7217 CB GLN A 447 84.697 55.759 91.018 1.00 0.00 C
ATOM 7218 CG GLN A 447 84.676 57.325 91.146 1.00 0.00 C
ATOM 7219 CD GLN A 447 84.769 57.775 92.558 1.00 0.00 C
ATOM 7220 NE2 GLN A 447 85.688 57.219 93.343 1.00 0.00 N
ATOM 7221 OE1 GLN A 447 83.928 58.469 93.093 1.00 0.00 O
ATOM 7222 H GLN A 447 82.555 55.383 89.503 1.00 0.00 H
ATOM 7223 HA GLN A 447 85.446 55.780 89.013 1.00 0.00 H
ATOM 7224 HB2 GLN A 447 83.829 55.300 91.491 1.00 0.00 H
ATOM 7225 HB3 GLN A 447 85.598 55.312 91.439 1.00 0.00 H
ATOM 7226 HG2 GLN A 447 85.444 57.735 90.490 1.00 0.00 H
ATOM 7227 HG3 GLN A 447 83.681 57.662 90.857 1.00 0.00 H
ATOM 7228 HE21 GLN A 447 85.590 57.610 94.269 1.00 0.00 H
ATOM 7229 HE22 GLN A 447 86.434 56.583 93.099 1.00 0.00 H
ATOM 7230 N GLY A 448 86.293 53.572 89.000 1.00 0.00 N
ATOM 7231 CA GLY A 448 87.142 52.330 89.015 1.00 0.00 C
ATOM 7232 C GLY A 448 87.415 51.670 87.732 1.00 0.00 C
ATOM 7233 O GLY A 448 88.205 50.716 87.696 1.00 0.00 O
ATOM 7234 H GLY A 448 86.655 54.354 88.474 1.00 0.00 H
ATOM 7235 HA2 GLY A 448 88.062 52.580 89.544 1.00 0.00 H
ATOM 7236 HA3 GLY A 448 86.575 51.656 89.657 1.00 0.00 H
ATOM 7237 N GLY A 449 86.602 52.021 86.730 1.00 0.00 N
ATOM 7238 CA GLY A 449 86.652 51.608 85.322 1.00 0.00 C
ATOM 7239 C GLY A 449 87.934 51.986 84.497 1.00 0.00 C
ATOM 7240 O GLY A 449 88.090 51.460 83.412 1.00 0.00 O
ATOM 7241 H GLY A 449 86.005 52.823 86.874 1.00 0.00 H
ATOM 7242 HA2 GLY A 449 86.674 50.519 85.325 1.00 0.00 H
ATOM 7243 HA3 GLY A 449 85.729 51.950 84.853 1.00 0.00 H
ATOM 7244 N LEU A 450 88.848 52.828 85.033 1.00 0.00 N
ATOM 7245 CA LEU A 450 90.118 53.187 84.379 1.00 0.00 C
ATOM 7246 C LEU A 450 91.042 53.710 85.446 1.00 0.00 C
ATOM 7247 O LEU A 450 90.774 54.638 86.195 1.00 0.00 O
ATOM 7248 CB LEU A 450 89.828 54.227 83.327 1.00 0.00 C
ATOM 7249 CG LEU A 450 90.864 54.109 82.191 1.00 0.00 C
ATOM 7250 CD1 LEU A 450 90.485 52.886 81.303 1.00 0.00 C
ATOM 7251 CD2 LEU A 450 90.825 55.422 81.336 1.00 0.00 C
ATOM 7252 H LEU A 450 88.631 53.410 85.830 1.00 0.00 H
ATOM 7253 HA LEU A 450 90.550 52.243 84.049 1.00 0.00 H
ATOM 7254 HB2 LEU A 450 88.804 54.061 82.991 1.00 0.00 H
ATOM 7255 HB3 LEU A 450 89.834 55.206 83.806 1.00 0.00 H
ATOM 7256 HG LEU A 450 91.900 54.050 82.524 1.00 0.00 H
ATOM 7257 HD11 LEU A 450 90.754 51.966 81.822 1.00 0.00 H
ATOM 7258 HD12 LEU A 450 89.401 52.917 81.192 1.00 0.00 H
ATOM 7259 HD13 LEU A 450 90.857 52.779 80.284 1.00 0.00 H
ATOM 7260 HD21 LEU A 450 89.868 55.515 80.822 1.00 0.00 H
ATOM 7261 HD22 LEU A 450 91.050 56.222 82.041 1.00 0.00 H
ATOM 7262 HD23 LEU A 450 91.651 55.449 80.626 1.00 0.00 H
ATOM 7263 N THR A 451 92.254 53.202 85.441 1.00 0.00 N
ATOM 7264 CA THR A 451 93.359 53.602 86.324 1.00 0.00 C
ATOM 7265 C THR A 451 94.079 54.889 85.955 1.00 0.00 C
ATOM 7266 O THR A 451 93.914 55.491 84.872 1.00 0.00 O
ATOM 7267 CB THR A 451 94.442 52.495 86.406 1.00 0.00 C
ATOM 7268 CG2 THR A 451 94.010 51.155 86.916 1.00 0.00 C
ATOM 7269 OG1 THR A 451 95.106 52.343 85.171 1.00 0.00 O
ATOM 7270 H THR A 451 92.372 52.479 84.745 1.00 0.00 H
ATOM 7271 HA THR A 451 92.917 53.775 87.305 1.00 0.00 H
ATOM 7272 HB THR A 451 95.122 52.835 87.188 1.00 0.00 H
ATOM 7273 HG1 THR A 451 94.915 51.464 84.836 1.00 0.00 H
ATOM 7274 HG21 THR A 451 94.757 50.382 86.734 1.00 0.00 H
ATOM 7275 HG22 THR A 451 93.949 51.343 87.988 1.00 0.00 H
ATOM 7276 HG23 THR A 451 93.103 50.811 86.419 1.00 0.00 H
ATOM 7277 N ASP A 452 95.065 55.349 86.754 1.00 0.00 N
ATOM 7278 CA ASP A 452 95.936 56.449 86.407 1.00 0.00 C
ATOM 7279 C ASP A 452 96.945 56.073 85.350 1.00 0.00 C
ATOM 7280 O ASP A 452 97.552 56.925 84.765 1.00 0.00 O
ATOM 7281 CB ASP A 452 96.792 56.813 87.647 1.00 0.00 C
ATOM 7282 CG ASP A 452 95.972 57.399 88.828 1.00 0.00 C
ATOM 7283 OD1 ASP A 452 96.606 57.469 89.925 1.00 0.00 O
ATOM 7284 OD2 ASP A 452 94.774 57.633 88.695 1.00 0.00 O1-
ATOM 7285 H ASP A 452 95.170 54.963 87.681 1.00 0.00 H
ATOM 7286 HA ASP A 452 95.474 57.381 86.081 1.00 0.00 H
ATOM 7287 HB2 ASP A 452 97.410 55.983 87.988 1.00 0.00 H
ATOM 7288 HB3 ASP A 452 97.504 57.587 87.362 1.00 0.00 H
ATOM 7289 N LEU A 453 97.230 54.743 85.185 1.00 0.00 N
ATOM 7290 CA LEU A 453 97.952 54.250 84.018 1.00 0.00 C
ATOM 7291 C LEU A 453 97.004 54.244 82.810 1.00 0.00 C
ATOM 7292 O LEU A 453 97.483 54.578 81.681 1.00 0.00 O
ATOM 7293 CB LEU A 453 98.612 52.871 84.398 1.00 0.00 C
ATOM 7294 CG LEU A 453 99.511 52.413 83.287 1.00 0.00 C
ATOM 7295 CD1 LEU A 453 100.557 53.385 82.719 1.00 0.00 C
ATOM 7296 CD2 LEU A 453 100.310 51.144 83.653 1.00 0.00 C
ATOM 7297 H LEU A 453 96.757 54.107 85.810 1.00 0.00 H
ATOM 7298 HA LEU A 453 98.777 54.900 83.728 1.00 0.00 H
ATOM 7299 HB2 LEU A 453 99.279 53.052 85.240 1.00 0.00 H
ATOM 7300 HB3 LEU A 453 97.808 52.143 84.502 1.00 0.00 H
ATOM 7301 HG LEU A 453 98.899 52.064 82.455 1.00 0.00 H
ATOM 7302 HD11 LEU A 453 101.273 53.729 83.465 1.00 0.00 H
ATOM 7303 HD12 LEU A 453 100.917 52.885 81.820 1.00 0.00 H
ATOM 7304 HD13 LEU A 453 100.078 54.265 82.289 1.00 0.00 H
ATOM 7305 HD21 LEU A 453 99.491 50.498 83.970 1.00 0.00 H
ATOM 7306 HD22 LEU A 453 100.808 50.727 82.778 1.00 0.00 H
ATOM 7307 HD23 LEU A 453 101.115 51.267 84.377 1.00 0.00 H
ATOM 7308 N GLY A 454 95.712 53.890 82.952 1.00 0.00 N
ATOM 7309 CA GLY A 454 94.830 53.804 81.770 1.00 0.00 C
ATOM 7310 C GLY A 454 94.695 55.284 81.314 1.00 0.00 C
ATOM 7311 O GLY A 454 94.706 55.537 80.133 1.00 0.00 O
ATOM 7312 H GLY A 454 95.291 53.493 83.780 1.00 0.00 H
ATOM 7313 HA2 GLY A 454 95.353 53.197 81.032 1.00 0.00 H
ATOM 7314 HA3 GLY A 454 93.894 53.275 81.948 1.00 0.00 H
ATOM 7315 N LEU A 455 94.794 56.257 82.249 1.00 0.00 N
ATOM 7316 CA LEU A 455 94.843 57.704 82.040 1.00 0.00 C
ATOM 7317 C LEU A 455 96.123 58.326 81.391 1.00 0.00 C
ATOM 7318 O LEU A 455 96.090 59.326 80.628 1.00 0.00 O
ATOM 7319 CB LEU A 455 94.553 58.255 83.465 1.00 0.00 C
ATOM 7320 CG LEU A 455 94.702 59.712 83.713 1.00 0.00 C
ATOM 7321 CD1 LEU A 455 93.756 60.549 82.851 1.00 0.00 C
ATOM 7322 CD2 LEU A 455 94.288 60.160 85.122 1.00 0.00 C
ATOM 7323 H LEU A 455 94.908 55.970 83.211 1.00 0.00 H
ATOM 7324 HA LEU A 455 93.978 57.905 81.409 1.00 0.00 H
ATOM 7325 HB2 LEU A 455 93.517 57.948 83.606 1.00 0.00 H
ATOM 7326 HB3 LEU A 455 95.255 57.820 84.177 1.00 0.00 H
ATOM 7327 HG LEU A 455 95.673 60.065 83.367 1.00 0.00 H
ATOM 7328 HD11 LEU A 455 92.764 60.107 82.770 1.00 0.00 H
ATOM 7329 HD12 LEU A 455 93.495 61.540 83.222 1.00 0.00 H
ATOM 7330 HD13 LEU A 455 94.170 60.647 81.847 1.00 0.00 H
ATOM 7331 HD21 LEU A 455 94.734 59.648 85.975 1.00 0.00 H
ATOM 7332 HD22 LEU A 455 94.632 61.190 85.222 1.00 0.00 H
ATOM 7333 HD23 LEU A 455 93.216 59.996 85.228 1.00 0.00 H
ATOM 7334 N SER A 456 97.227 57.618 81.665 1.00 0.00 N
ATOM 7335 CA SER A 456 98.526 57.958 80.985 1.00 0.00 C
ATOM 7336 C SER A 456 98.356 57.537 79.540 1.00 0.00 C
ATOM 7337 O SER A 456 98.536 58.386 78.651 1.00 0.00 O
ATOM 7338 CB SER A 456 99.768 57.349 81.721 1.00 0.00 C
ATOM 7339 OG SER A 456 101.024 57.662 81.092 1.00 0.00 O
ATOM 7340 H SER A 456 97.154 57.025 82.480 1.00 0.00 H
ATOM 7341 HA SER A 456 98.744 59.026 80.968 1.00 0.00 H
ATOM 7342 HB2 SER A 456 99.755 57.532 82.796 1.00 0.00 H
ATOM 7343 HB3 SER A 456 99.650 56.270 81.625 1.00 0.00 H
ATOM 7344 HG SER A 456 101.668 56.977 81.285 1.00 0.00 H
ATOM 7345 N TYR A 457 97.928 56.286 79.269 1.00 0.00 N
ATOM 7346 CA TYR A 457 97.656 55.819 77.902 1.00 0.00 C
ATOM 7347 C TYR A 457 96.640 56.729 77.087 1.00 0.00 C
ATOM 7348 O TYR A 457 96.872 57.066 75.909 1.00 0.00 O
ATOM 7349 CB TYR A 457 97.095 54.386 77.957 1.00 0.00 C
ATOM 7350 CG TYR A 457 97.965 53.361 78.652 1.00 0.00 C
ATOM 7351 CD1 TYR A 457 99.340 53.536 78.829 1.00 0.00 C
ATOM 7352 CD2 TYR A 457 97.443 52.165 79.100 1.00 0.00 C
ATOM 7353 CE1 TYR A 457 100.155 52.537 79.350 1.00 0.00 C
ATOM 7354 CE2 TYR A 457 98.247 51.116 79.665 1.00 0.00 C
ATOM 7355 CZ TYR A 457 99.620 51.308 79.677 1.00 0.00 C
ATOM 7356 OH TYR A 457 100.516 50.313 80.023 1.00 0.00 O
ATOM 7357 H TYR A 457 97.719 55.662 80.034 1.00 0.00 H
ATOM 7358 HA TYR A 457 98.585 55.803 77.332 1.00 0.00 H
ATOM 7359 HB2 TYR A 457 96.235 54.489 78.619 1.00 0.00 H
ATOM 7360 HB3 TYR A 457 96.732 53.882 77.062 1.00 0.00 H
ATOM 7361 HD1 TYR A 457 99.763 54.495 78.568 1.00 0.00 H
ATOM 7362 HD2 TYR A 457 96.408 51.906 78.931 1.00 0.00 H
ATOM 7363 HE1 TYR A 457 101.204 52.705 79.548 1.00 0.00 H
ATOM 7364 HE2 TYR A 457 97.818 50.144 79.858 1.00 0.00 H
ATOM 7365 HH TYR A 457 100.051 49.555 80.386 1.00 0.00 H
ATOM 7366 N ILE A 458 95.538 57.273 77.749 1.00 0.00 N
ATOM 7367 CA ILE A 458 94.591 58.305 77.190 1.00 0.00 C
ATOM 7368 C ILE A 458 95.378 59.617 76.815 1.00 0.00 C
ATOM 7369 O ILE A 458 94.930 60.169 75.874 1.00 0.00 O
ATOM 7370 CB ILE A 458 93.456 58.633 78.180 1.00 0.00 C
ATOM 7371 CG1 ILE A 458 92.472 57.460 78.424 1.00 0.00 C
ATOM 7372 CG2 ILE A 458 92.531 59.737 77.757 1.00 0.00 C
ATOM 7373 CD1 ILE A 458 91.702 56.802 77.310 1.00 0.00 C
ATOM 7374 H ILE A 458 95.484 57.044 78.731 1.00 0.00 H
ATOM 7375 HA ILE A 458 94.135 57.946 76.267 1.00 0.00 H
ATOM 7376 HB ILE A 458 93.867 58.994 79.123 1.00 0.00 H
ATOM 7377 HG12 ILE A 458 93.069 56.663 78.868 1.00 0.00 H
ATOM 7378 HG13 ILE A 458 91.767 57.837 79.165 1.00 0.00 H
ATOM 7379 HG21 ILE A 458 93.062 60.688 77.754 1.00 0.00 H
ATOM 7380 HG22 ILE A 458 92.239 59.544 76.725 1.00 0.00 H
ATOM 7381 HG23 ILE A 458 91.681 59.923 78.414 1.00 0.00 H
ATOM 7382 HD11 ILE A 458 92.352 56.122 76.759 1.00 0.00 H
ATOM 7383 HD12 ILE A 458 90.964 56.094 77.687 1.00 0.00 H
ATOM 7384 HD13 ILE A 458 91.274 57.607 76.713 1.00 0.00 H
ATOM 7385 N GLY A 459 96.495 59.902 77.420 1.00 0.00 N
ATOM 7386 CA GLY A 459 97.297 61.008 76.903 1.00 0.00 C
ATOM 7387 C GLY A 459 98.326 60.650 75.846 1.00 0.00 C
ATOM 7388 O GLY A 459 98.523 61.397 74.904 1.00 0.00 O
ATOM 7389 H GLY A 459 96.903 59.253 78.077 1.00 0.00 H
ATOM 7390 HA2 GLY A 459 96.678 61.829 76.542 1.00 0.00 H
ATOM 7391 HA3 GLY A 459 97.820 61.423 77.765 1.00 0.00 H
ATOM 7392 N GLN A 460 98.924 59.512 75.996 1.00 0.00 N
ATOM 7393 CA GLN A 460 100.072 59.003 75.235 1.00 0.00 C
ATOM 7394 C GLN A 460 99.739 58.670 73.790 1.00 0.00 C
ATOM 7395 O GLN A 460 100.426 59.124 72.891 1.00 0.00 O
ATOM 7396 CB GLN A 460 100.659 57.780 76.043 1.00 0.00 C
ATOM 7397 CG GLN A 460 101.949 57.318 75.402 1.00 0.00 C
ATOM 7398 CD GLN A 460 102.562 56.099 76.139 1.00 0.00 C
ATOM 7399 NE2 GLN A 460 103.736 55.803 75.705 1.00 0.00 N
ATOM 7400 OE1 GLN A 460 102.101 55.425 77.014 1.00 0.00 O
ATOM 7401 H GLN A 460 98.707 59.162 76.919 1.00 0.00 H
ATOM 7402 HA GLN A 460 100.857 59.758 75.193 1.00 0.00 H
ATOM 7403 HB2 GLN A 460 100.888 58.053 77.073 1.00 0.00 H
ATOM 7404 HB3 GLN A 460 99.900 56.998 76.039 1.00 0.00 H
ATOM 7405 HG2 GLN A 460 101.802 56.974 74.378 1.00 0.00 H
ATOM 7406 HG3 GLN A 460 102.639 58.146 75.561 1.00 0.00 H
ATOM 7407 HE21 GLN A 460 104.217 55.032 76.145 1.00 0.00 H
ATOM 7408 HE22 GLN A 460 104.047 56.208 74.833 1.00 0.00 H
ATOM 7409 N TYR A 461 98.575 58.015 73.534 1.00 0.00 N
ATOM 7410 CA TYR A 461 98.244 57.413 72.278 1.00 0.00 C
ATOM 7411 C TYR A 461 97.230 58.311 71.455 1.00 0.00 C
ATOM 7412 O TYR A 461 96.853 57.948 70.347 1.00 0.00 O
ATOM 7413 CB TYR A 461 97.745 55.966 72.651 1.00 0.00 C
ATOM 7414 CG TYR A 461 98.902 55.018 73.111 1.00 0.00 C
ATOM 7415 CD1 TYR A 461 99.905 54.632 72.177 1.00 0.00 C
ATOM 7416 CD2 TYR A 461 98.937 54.523 74.438 1.00 0.00 C
ATOM 7417 CE1 TYR A 461 100.943 53.741 72.553 1.00 0.00 C
ATOM 7418 CE2 TYR A 461 100.102 53.828 74.858 1.00 0.00 C
ATOM 7419 CZ TYR A 461 100.976 53.289 73.880 1.00 0.00 C
ATOM 7420 OH TYR A 461 101.948 52.512 74.324 1.00 0.00 O
ATOM 7421 H TYR A 461 98.104 57.660 74.354 1.00 0.00 H
ATOM 7422 HA TYR A 461 99.105 57.283 71.622 1.00 0.00 H
ATOM 7423 HB2 TYR A 461 96.986 56.087 73.423 1.00 0.00 H
ATOM 7424 HB3 TYR A 461 97.337 55.440 71.788 1.00 0.00 H
ATOM 7425 HD1 TYR A 461 99.929 54.990 71.158 1.00 0.00 H
ATOM 7426 HD2 TYR A 461 98.148 54.759 75.136 1.00 0.00 H
ATOM 7427 HE1 TYR A 461 101.669 53.429 71.817 1.00 0.00 H
ATOM 7428 HE2 TYR A 461 100.233 53.480 75.872 1.00 0.00 H
ATOM 7429 HH TYR A 461 102.155 52.656 75.250 1.00 0.00 H
ATOM 7430 N SER A 462 96.909 59.475 71.986 1.00 0.00 N
ATOM 7431 CA SER A 462 95.895 60.362 71.383 1.00 0.00 C
ATOM 7432 C SER A 462 96.422 61.765 70.942 1.00 0.00 C
ATOM 7433 O SER A 462 95.555 62.641 70.914 1.00 0.00 O
ATOM 7434 CB SER A 462 94.777 60.553 72.453 1.00 0.00 C
ATOM 7435 OG SER A 462 95.373 61.278 73.576 1.00 0.00 O
ATOM 7436 H SER A 462 97.247 59.725 72.904 1.00 0.00 H
ATOM 7437 HA SER A 462 95.404 59.790 70.595 1.00 0.00 H
ATOM 7438 HB2 SER A 462 93.889 61.055 72.068 1.00 0.00 H
ATOM 7439 HB3 SER A 462 94.440 59.573 72.794 1.00 0.00 H
ATOM 7440 HG SER A 462 95.263 60.791 74.396 1.00 0.00 H
ATOM 7441 N PRO A 463 97.691 62.018 70.584 1.00 0.00 N
ATOM 7442 CA PRO A 463 98.086 63.347 70.082 1.00 0.00 C
ATOM 7443 C PRO A 463 97.470 63.745 68.722 1.00 0.00 C
ATOM 7444 O PRO A 463 97.598 64.933 68.370 1.00 0.00 O
ATOM 7445 CB PRO A 463 99.586 63.251 70.027 1.00 0.00 C
ATOM 7446 CG PRO A 463 99.879 61.847 69.585 1.00 0.00 C
ATOM 7447 CD PRO A 463 98.831 61.131 70.470 1.00 0.00 C
ATOM 7448 HA PRO A 463 97.868 64.086 70.853 1.00 0.00 H
ATOM 7449 HB2 PRO A 463 99.967 64.051 69.393 1.00 0.00 H
ATOM 7450 HB3 PRO A 463 99.917 63.397 71.055 1.00 0.00 H
ATOM 7451 HG2 PRO A 463 99.623 61.673 68.540 1.00 0.00 H
ATOM 7452 HG3 PRO A 463 100.906 61.568 69.821 1.00 0.00 H
ATOM 7453 HD2 PRO A 463 98.635 60.118 70.116 1.00 0.00 H
ATOM 7454 HD3 PRO A 463 99.103 61.100 71.525 1.00 0.00 H
ATOM 7455 N ASN A 464 96.665 62.938 68.041 1.00 0.00 N
ATOM 7456 CA ASN A 464 95.829 63.435 66.960 1.00 0.00 C
ATOM 7457 C ASN A 464 94.549 64.147 67.495 1.00 0.00 C
ATOM 7458 O ASN A 464 94.002 64.910 66.734 1.00 0.00 O
ATOM 7459 CB ASN A 464 95.476 62.242 66.116 1.00 0.00 C
ATOM 7460 CG ASN A 464 95.261 62.483 64.597 1.00 0.00 C
ATOM 7461 ND2 ASN A 464 94.602 61.597 64.013 1.00 0.00 N
ATOM 7462 OD1 ASN A 464 95.584 63.532 64.059 1.00 0.00 O
ATOM 7463 H ASN A 464 96.572 61.982 68.351 1.00 0.00 H
ATOM 7464 HA ASN A 464 96.313 64.114 66.257 1.00 0.00 H
ATOM 7465 HB2 ASN A 464 96.226 61.454 66.191 1.00 0.00 H
ATOM 7466 HB3 ASN A 464 94.560 61.947 66.627 1.00 0.00 H
ATOM 7467 HD21 ASN A 464 94.298 61.813 63.074 1.00 0.00 H
ATOM 7468 HD22 ASN A 464 94.514 60.680 64.426 1.00 0.00 H
ATOM 7469 N VAL A 465 94.123 63.920 68.762 1.00 0.00 N
ATOM 7470 CA VAL A 465 92.861 64.579 69.252 1.00 0.00 C
ATOM 7471 C VAL A 465 92.929 66.123 69.340 1.00 0.00 C
ATOM 7472 O VAL A 465 93.930 66.673 69.809 1.00 0.00 O
ATOM 7473 CB VAL A 465 92.348 63.937 70.573 1.00 0.00 C
ATOM 7474 CG1 VAL A 465 91.045 64.460 71.085 1.00 0.00 C
ATOM 7475 CG2 VAL A 465 92.035 62.401 70.407 1.00 0.00 C
ATOM 7476 H VAL A 465 94.692 63.323 69.344 1.00 0.00 H
ATOM 7477 HA VAL A 465 92.042 64.364 68.565 1.00 0.00 H
ATOM 7478 HB VAL A 465 93.074 64.011 71.382 1.00 0.00 H
ATOM 7479 HG11 VAL A 465 90.799 63.772 71.894 1.00 0.00 H
ATOM 7480 HG12 VAL A 465 91.172 65.484 71.436 1.00 0.00 H
ATOM 7481 HG13 VAL A 465 90.349 64.315 70.259 1.00 0.00 H
ATOM 7482 HG21 VAL A 465 91.365 62.302 69.553 1.00 0.00 H
ATOM 7483 HG22 VAL A 465 92.862 61.724 70.190 1.00 0.00 H
ATOM 7484 HG23 VAL A 465 91.500 61.927 71.230 1.00 0.00 H
ATOM 7485 N ARG A 466 91.826 66.861 68.950 1.00 0.00 N
ATOM 7486 CA ARG A 466 91.695 68.291 69.050 1.00 0.00 C
ATOM 7487 C ARG A 466 90.540 68.724 70.015 1.00 0.00 C
ATOM 7488 O ARG A 466 90.772 69.582 70.896 1.00 0.00 O
ATOM 7489 CB ARG A 466 91.655 68.998 67.664 1.00 0.00 C
ATOM 7490 CG ARG A 466 92.706 68.704 66.688 1.00 0.00 C
ATOM 7491 CD ARG A 466 94.084 69.171 67.288 1.00 0.00 C
ATOM 7492 NE ARG A 466 95.136 68.963 66.229 1.00 0.00 N
ATOM 7493 CZ ARG A 466 95.993 67.961 66.276 1.00 0.00 C
ATOM 7494 NH1 ARG A 466 96.194 67.287 67.362 1.00 0.00 N1+
ATOM 7495 NH2 ARG A 466 96.783 67.598 65.323 1.00 0.00 N
ATOM 7496 H ARG A 466 91.057 66.330 68.569 1.00 0.00 H
ATOM 7497 HA ARG A 466 92.519 68.769 69.579 1.00 0.00 H
ATOM 7498 HB2 ARG A 466 90.676 68.693 67.296 1.00 0.00 H
ATOM 7499 HB3 ARG A 466 91.550 70.076 67.793 1.00 0.00 H
ATOM 7500 HG2 ARG A 466 92.521 67.643 66.520 1.00 0.00 H
ATOM 7501 HG3 ARG A 466 92.551 69.337 65.814 1.00 0.00 H
ATOM 7502 HD2 ARG A 466 93.923 70.227 67.500 1.00 0.00 H
ATOM 7503 HD3 ARG A 466 94.274 68.676 68.240 1.00 0.00 H
ATOM 7504 HE ARG A 466 95.064 69.504 65.379 1.00 0.00 H
ATOM 7505 HH11 ARG A 466 95.502 67.491 68.069 1.00 0.00 H
ATOM 7506 HH12 ARG A 466 96.683 66.404 67.372 1.00 0.00 H
ATOM 7507 HH21 ARG A 466 96.721 67.922 64.368 1.00 0.00 H
ATOM 7508 HH22 ARG A 466 97.533 66.926 65.396 1.00 0.00 H
ATOM 7509 N TRP A 467 89.393 68.004 70.053 1.00 0.00 N
ATOM 7510 CA TRP A 467 88.395 68.194 71.169 1.00 0.00 C
ATOM 7511 C TRP A 467 88.370 66.869 71.934 1.00 0.00 C
ATOM 7512 O TRP A 467 88.300 65.819 71.269 1.00 0.00 O
ATOM 7513 CB TRP A 467 86.931 68.624 70.656 1.00 0.00 C
ATOM 7514 CG TRP A 467 85.840 68.583 71.705 1.00 0.00 C
ATOM 7515 CD1 TRP A 467 85.252 69.591 72.349 1.00 0.00 C
ATOM 7516 CD2 TRP A 467 85.100 67.424 72.146 1.00 0.00 C
ATOM 7517 CE2 TRP A 467 84.169 67.827 73.130 1.00 0.00 C
ATOM 7518 CE3 TRP A 467 85.160 66.090 71.823 1.00 0.00 C
ATOM 7519 NE1 TRP A 467 84.252 69.196 73.205 1.00 0.00 N
ATOM 7520 CZ2 TRP A 467 83.369 66.926 73.800 1.00 0.00 C
ATOM 7521 CZ3 TRP A 467 84.326 65.159 72.432 1.00 0.00 C
ATOM 7522 CH2 TRP A 467 83.417 65.592 73.404 1.00 0.00 C
ATOM 7523 H TRP A 467 89.259 67.253 69.392 1.00 0.00 H
ATOM 7524 HA TRP A 467 88.763 68.940 71.873 1.00 0.00 H
ATOM 7525 HB2 TRP A 467 86.922 69.619 70.211 1.00 0.00 H
ATOM 7526 HB3 TRP A 467 86.540 67.940 69.903 1.00 0.00 H
ATOM 7527 HD1 TRP A 467 85.534 70.588 72.045 1.00 0.00 H
ATOM 7528 HE1 TRP A 467 83.796 69.885 73.786 1.00 0.00 H
ATOM 7529 HE3 TRP A 467 85.663 65.820 70.907 1.00 0.00 H
ATOM 7530 HZ2 TRP A 467 82.708 67.194 74.610 1.00 0.00 H
ATOM 7531 HZ3 TRP A 467 84.302 64.134 72.093 1.00 0.00 H
ATOM 7532 HH2 TRP A 467 82.743 64.898 73.884 1.00 0.00 H
ATOM 7533 N MET A 468 88.127 66.867 73.211 1.00 0.00 N
ATOM 7534 CA MET A 468 87.828 65.682 74.039 1.00 0.00 C
ATOM 7535 C MET A 468 86.924 66.007 75.268 1.00 0.00 C
ATOM 7536 O MET A 468 87.010 67.104 75.876 1.00 0.00 O
ATOM 7537 CB MET A 468 89.127 64.963 74.521 1.00 0.00 C
ATOM 7538 CG MET A 468 88.914 63.518 75.165 1.00 0.00 C
ATOM 7539 SD MET A 468 90.437 62.724 75.789 1.00 0.00 S
ATOM 7540 CE MET A 468 91.541 62.648 74.410 1.00 0.00 C
ATOM 7541 H MET A 468 88.036 67.699 73.777 1.00 0.00 H
ATOM 7542 HA MET A 468 87.256 64.998 73.411 1.00 0.00 H
ATOM 7543 HB2 MET A 468 89.790 64.930 73.656 1.00 0.00 H
ATOM 7544 HB3 MET A 468 89.659 65.547 75.272 1.00 0.00 H
ATOM 7545 HG2 MET A 468 88.265 63.467 76.039 1.00 0.00 H
ATOM 7546 HG3 MET A 468 88.480 62.863 74.411 1.00 0.00 H
ATOM 7547 HE1 MET A 468 92.435 62.074 74.656 1.00 0.00 H
ATOM 7548 HE2 MET A 468 91.097 62.124 73.563 1.00 0.00 H
ATOM 7549 HE3 MET A 468 91.965 63.617 74.147 1.00 0.00 H
ATOM 7550 N LEU A 469 86.181 65.012 75.740 1.00 0.00 N
ATOM 7551 CA LEU A 469 85.504 64.901 77.048 1.00 0.00 C
ATOM 7552 C LEU A 469 86.061 63.731 77.931 1.00 0.00 C
ATOM 7553 O LEU A 469 86.073 62.564 77.481 1.00 0.00 O
ATOM 7554 CB LEU A 469 83.974 64.769 76.760 1.00 0.00 C
ATOM 7555 CG LEU A 469 83.152 64.695 78.043 1.00 0.00 C
ATOM 7556 CD1 LEU A 469 81.916 65.507 77.946 1.00 0.00 C
ATOM 7557 CD2 LEU A 469 82.867 63.213 78.492 1.00 0.00 C
ATOM 7558 H LEU A 469 86.115 64.179 75.172 1.00 0.00 H
ATOM 7559 HA LEU A 469 85.744 65.806 77.605 1.00 0.00 H
ATOM 7560 HB2 LEU A 469 83.515 65.439 76.033 1.00 0.00 H
ATOM 7561 HB3 LEU A 469 83.772 63.827 76.251 1.00 0.00 H
ATOM 7562 HG LEU A 469 83.786 65.154 78.802 1.00 0.00 H
ATOM 7563 HD11 LEU A 469 81.215 65.175 77.180 1.00 0.00 H
ATOM 7564 HD12 LEU A 469 81.380 65.535 78.895 1.00 0.00 H
ATOM 7565 HD13 LEU A 469 82.112 66.577 77.879 1.00 0.00 H
ATOM 7566 HD21 LEU A 469 83.790 62.777 78.873 1.00 0.00 H
ATOM 7567 HD22 LEU A 469 82.212 63.279 79.361 1.00 0.00 H
ATOM 7568 HD23 LEU A 469 82.372 62.660 77.694 1.00 0.00 H
ATOM 7569 N LEU A 470 86.268 63.944 79.282 1.00 0.00 N
ATOM 7570 CA LEU A 470 86.623 62.925 80.277 1.00 0.00 C
ATOM 7571 C LEU A 470 85.576 62.778 81.392 1.00 0.00 C
ATOM 7572 O LEU A 470 84.902 63.765 81.838 1.00 0.00 O
ATOM 7573 CB LEU A 470 88.022 63.252 80.842 1.00 0.00 C
ATOM 7574 CG LEU A 470 89.043 63.101 79.708 1.00 0.00 C
ATOM 7575 CD1 LEU A 470 90.425 63.420 80.207 1.00 0.00 C
ATOM 7576 CD2 LEU A 470 89.085 61.603 79.259 1.00 0.00 C
ATOM 7577 H LEU A 470 86.002 64.853 79.633 1.00 0.00 H
ATOM 7578 HA LEU A 470 86.621 61.940 79.812 1.00 0.00 H
ATOM 7579 HB2 LEU A 470 88.025 64.233 81.318 1.00 0.00 H
ATOM 7580 HB3 LEU A 470 88.309 62.552 81.627 1.00 0.00 H
ATOM 7581 HG LEU A 470 88.725 63.767 78.906 1.00 0.00 H
ATOM 7582 HD11 LEU A 470 90.426 64.391 80.701 1.00 0.00 H
ATOM 7583 HD12 LEU A 470 90.744 62.621 80.876 1.00 0.00 H
ATOM 7584 HD13 LEU A 470 91.010 63.462 79.288 1.00 0.00 H
ATOM 7585 HD21 LEU A 470 88.338 61.335 78.512 1.00 0.00 H
ATOM 7586 HD22 LEU A 470 90.079 61.483 78.828 1.00 0.00 H
ATOM 7587 HD23 LEU A 470 89.108 60.944 80.126 1.00 0.00 H
ATOM 7588 N GLY A 471 85.441 61.562 81.975 1.00 0.00 N
ATOM 7589 CA GLY A 471 84.588 61.464 83.161 1.00 0.00 C
ATOM 7590 C GLY A 471 84.963 60.241 83.934 1.00 0.00 C
ATOM 7591 O GLY A 471 84.997 59.123 83.366 1.00 0.00 O
ATOM 7592 H GLY A 471 85.844 60.721 81.586 1.00 0.00 H
ATOM 7593 HA2 GLY A 471 84.808 62.320 83.800 1.00 0.00 H
ATOM 7594 HA3 GLY A 471 83.522 61.431 82.934 1.00 0.00 H
ATOM 7595 N TYR A 472 85.240 60.338 85.238 1.00 0.00 N
ATOM 7596 CA TYR A 472 85.630 59.223 86.131 1.00 0.00 C
ATOM 7597 C TYR A 472 86.819 58.297 85.736 1.00 0.00 C
ATOM 7598 O TYR A 472 86.922 57.144 86.180 1.00 0.00 O
ATOM 7599 CB TYR A 472 84.268 58.458 86.511 1.00 0.00 C
ATOM 7600 CG TYR A 472 83.494 59.343 87.503 1.00 0.00 C
ATOM 7601 CD1 TYR A 472 84.050 59.681 88.728 1.00 0.00 C
ATOM 7602 CD2 TYR A 472 82.148 59.735 87.212 1.00 0.00 C
ATOM 7603 CE1 TYR A 472 83.363 60.504 89.664 1.00 0.00 C
ATOM 7604 CE2 TYR A 472 81.439 60.537 88.108 1.00 0.00 C
ATOM 7605 CZ TYR A 472 82.030 60.923 89.330 1.00 0.00 C
ATOM 7606 OH TYR A 472 81.336 61.735 90.216 1.00 0.00 O
ATOM 7607 H TYR A 472 85.141 61.271 85.612 1.00 0.00 H
ATOM 7608 HA TYR A 472 86.097 59.698 86.994 1.00 0.00 H
ATOM 7609 HB2 TYR A 472 83.656 58.188 85.651 1.00 0.00 H
ATOM 7610 HB3 TYR A 472 84.413 57.505 87.018 1.00 0.00 H
ATOM 7611 HD1 TYR A 472 85.094 59.452 88.886 1.00 0.00 H
ATOM 7612 HD2 TYR A 472 81.600 59.521 86.306 1.00 0.00 H
ATOM 7613 HE1 TYR A 472 83.903 60.907 90.508 1.00 0.00 H
ATOM 7614 HE2 TYR A 472 80.462 60.934 87.878 1.00 0.00 H
ATOM 7615 HH TYR A 472 81.736 61.631 91.082 1.00 0.00 H
ATOM 7616 N VAL A 473 87.750 58.851 84.960 1.00 0.00 N
ATOM 7617 CA VAL A 473 89.009 58.228 84.585 1.00 0.00 C
ATOM 7618 C VAL A 473 90.022 58.547 85.721 1.00 0.00 C
ATOM 7619 O VAL A 473 90.128 59.691 86.155 1.00 0.00 O
ATOM 7620 CB VAL A 473 89.499 58.630 83.185 1.00 0.00 C
ATOM 7621 CG1 VAL A 473 88.524 58.102 82.147 1.00 0.00 C
ATOM 7622 CG2 VAL A 473 89.744 60.101 82.971 1.00 0.00 C
ATOM 7623 H VAL A 473 87.605 59.806 84.666 1.00 0.00 H
ATOM 7624 HA VAL A 473 88.935 57.142 84.541 1.00 0.00 H
ATOM 7625 HB VAL A 473 90.436 58.107 82.994 1.00 0.00 H
ATOM 7626 HG11 VAL A 473 88.862 58.463 81.176 1.00 0.00 H
ATOM 7627 HG12 VAL A 473 88.388 57.027 82.022 1.00 0.00 H
ATOM 7628 HG13 VAL A 473 87.542 58.538 82.331 1.00 0.00 H
ATOM 7629 HG21 VAL A 473 88.822 60.675 83.067 1.00 0.00 H
ATOM 7630 HG22 VAL A 473 90.459 60.427 83.726 1.00 0.00 H
ATOM 7631 HG23 VAL A 473 90.080 60.221 81.941 1.00 0.00 H
ATOM 7632 N GLY A 474 90.851 57.543 86.118 1.00 0.00 N
ATOM 7633 CA GLY A 474 91.942 57.705 87.123 1.00 0.00 C
ATOM 7634 C GLY A 474 91.428 58.271 88.456 1.00 0.00 C
ATOM 7635 O GLY A 474 90.283 58.099 88.782 1.00 0.00 O
ATOM 7636 H GLY A 474 90.831 56.676 85.600 1.00 0.00 H
ATOM 7637 HA2 GLY A 474 92.461 56.784 87.391 1.00 0.00 H
ATOM 7638 HA3 GLY A 474 92.699 58.363 86.697 1.00 0.00 H
ATOM 7639 N GLU A 475 92.358 58.628 89.332 1.00 0.00 N
ATOM 7640 CA GLU A 475 92.079 58.967 90.742 1.00 0.00 C
ATOM 7641 C GLU A 475 92.939 60.069 91.271 1.00 0.00 C
ATOM 7642 O GLU A 475 92.386 61.094 91.700 1.00 0.00 O
ATOM 7643 CB GLU A 475 92.217 57.624 91.575 1.00 0.00 C
ATOM 7644 CG GLU A 475 92.315 57.611 93.147 1.00 0.00 C
ATOM 7645 CD GLU A 475 91.122 58.356 93.792 1.00 0.00 C
ATOM 7646 OE1 GLU A 475 89.968 57.871 93.791 1.00 0.00 O
ATOM 7647 OE2 GLU A 475 91.411 59.394 94.415 1.00 0.00 O1-
ATOM 7648 H GLU A 475 93.332 58.476 89.111 1.00 0.00 H
ATOM 7649 HA GLU A 475 91.093 59.408 90.887 1.00 0.00 H
ATOM 7650 HB2 GLU A 475 91.473 56.934 91.178 1.00 0.00 H
ATOM 7651 HB3 GLU A 475 93.142 57.115 91.304 1.00 0.00 H
ATOM 7652 HG2 GLU A 475 92.337 56.593 93.534 1.00 0.00 H
ATOM 7653 HG3 GLU A 475 93.232 58.115 93.452 1.00 0.00 H
ATOM 7654 N SER A 476 94.259 59.818 91.203 1.00 0.00 N
ATOM 7655 CA SER A 476 95.209 60.720 91.854 1.00 0.00 C
ATOM 7656 C SER A 476 95.335 62.148 91.223 1.00 0.00 C
ATOM 7657 O SER A 476 95.169 62.204 89.975 1.00 0.00 O
ATOM 7658 CB SER A 476 96.599 60.057 91.989 1.00 0.00 C
ATOM 7659 OG SER A 476 97.214 59.946 90.757 1.00 0.00 O
ATOM 7660 H SER A 476 94.556 59.008 90.678 1.00 0.00 H
ATOM 7661 HA SER A 476 94.882 60.797 92.891 1.00 0.00 H
ATOM 7662 HB2 SER A 476 97.138 60.810 92.565 1.00 0.00 H
ATOM 7663 HB3 SER A 476 96.643 59.124 92.551 1.00 0.00 H
ATOM 7664 HG SER A 476 96.815 59.210 90.287 1.00 0.00 H
ATOM 7665 N ASP A 477 95.828 63.169 91.916 1.00 0.00 N
ATOM 7666 CA ASP A 477 96.438 64.319 91.350 1.00 0.00 C
ATOM 7667 C ASP A 477 97.662 63.995 90.437 1.00 0.00 C
ATOM 7668 O ASP A 477 98.011 64.752 89.500 1.00 0.00 O
ATOM 7669 CB ASP A 477 97.023 65.265 92.465 1.00 0.00 C
ATOM 7670 CG ASP A 477 95.817 65.621 93.434 1.00 0.00 C
ATOM 7671 OD1 ASP A 477 95.827 65.120 94.573 1.00 0.00 O
ATOM 7672 OD2 ASP A 477 94.796 66.176 92.994 1.00 0.00 O1-
ATOM 7673 H ASP A 477 95.974 63.039 92.906 1.00 0.00 H
ATOM 7674 HA ASP A 477 95.770 64.904 90.719 1.00 0.00 H
ATOM 7675 HB2 ASP A 477 97.702 64.712 93.114 1.00 0.00 H
ATOM 7676 HB3 ASP A 477 97.426 66.162 91.995 1.00 0.00 H
ATOM 7677 N GLU A 478 98.320 62.817 90.661 1.00 0.00 N
ATOM 7678 CA GLU A 478 99.514 62.440 89.886 1.00 0.00 C
ATOM 7679 C GLU A 478 99.173 62.055 88.464 1.00 0.00 C
ATOM 7680 O GLU A 478 99.840 62.451 87.458 1.00 0.00 O
ATOM 7681 CB GLU A 478 100.402 61.453 90.583 1.00 0.00 C
ATOM 7682 CG GLU A 478 100.616 61.697 92.070 1.00 0.00 C
ATOM 7683 CD GLU A 478 101.468 62.874 92.414 1.00 0.00 C
ATOM 7684 OE1 GLU A 478 101.969 63.566 91.530 1.00 0.00 O
ATOM 7685 OE2 GLU A 478 101.740 63.132 93.639 1.00 0.00 O1-
ATOM 7686 H GLU A 478 97.910 62.141 91.290 1.00 0.00 H
ATOM 7687 HA GLU A 478 100.075 63.370 89.797 1.00 0.00 H
ATOM 7688 HB2 GLU A 478 99.859 60.512 90.487 1.00 0.00 H
ATOM 7689 HB3 GLU A 478 101.364 61.343 90.082 1.00 0.00 H
ATOM 7690 HG2 GLU A 478 99.716 61.719 92.685 1.00 0.00 H
ATOM 7691 HG3 GLU A 478 101.163 60.792 92.335 1.00 0.00 H
ATOM 7692 N GLY A 479 97.962 61.506 88.295 1.00 0.00 N
ATOM 7693 CA GLY A 479 97.361 60.960 87.119 1.00 0.00 C
ATOM 7694 C GLY A 479 97.207 62.103 86.104 1.00 0.00 C
ATOM 7695 O GLY A 479 97.548 61.919 84.905 1.00 0.00 O
ATOM 7696 H GLY A 479 97.542 61.256 89.178 1.00 0.00 H
ATOM 7697 HA2 GLY A 479 97.984 60.130 86.787 1.00 0.00 H
ATOM 7698 HA3 GLY A 479 96.370 60.576 87.359 1.00 0.00 H
ATOM 7699 N LEU A 480 96.546 63.246 86.471 1.00 0.00 N
ATOM 7700 CA LEU A 480 96.286 64.327 85.582 1.00 0.00 C
ATOM 7701 C LEU A 480 97.536 65.136 85.039 1.00 0.00 C
ATOM 7702 O LEU A 480 97.589 65.612 83.894 1.00 0.00 O
ATOM 7703 CB LEU A 480 95.261 65.213 86.251 1.00 0.00 C
ATOM 7704 CG LEU A 480 94.568 66.218 85.296 1.00 0.00 C
ATOM 7705 CD1 LEU A 480 93.521 65.425 84.479 1.00 0.00 C
ATOM 7706 CD2 LEU A 480 93.802 67.311 86.005 1.00 0.00 C
ATOM 7707 H LEU A 480 96.198 63.247 87.420 1.00 0.00 H
ATOM 7708 HA LEU A 480 95.784 63.791 84.776 1.00 0.00 H
ATOM 7709 HB2 LEU A 480 94.507 64.636 86.787 1.00 0.00 H
ATOM 7710 HB3 LEU A 480 95.772 65.822 86.996 1.00 0.00 H
ATOM 7711 HG LEU A 480 95.232 66.730 84.599 1.00 0.00 H
ATOM 7712 HD11 LEU A 480 92.582 65.226 84.994 1.00 0.00 H
ATOM 7713 HD12 LEU A 480 93.444 65.976 83.542 1.00 0.00 H
ATOM 7714 HD13 LEU A 480 94.028 64.523 84.138 1.00 0.00 H
ATOM 7715 HD21 LEU A 480 94.338 67.762 86.840 1.00 0.00 H
ATOM 7716 HD22 LEU A 480 93.468 68.100 85.331 1.00 0.00 H
ATOM 7717 HD23 LEU A 480 92.904 66.836 86.401 1.00 0.00 H
ATOM 7718 N MET A 481 98.659 65.010 85.737 1.00 0.00 N
ATOM 7719 CA MET A 481 99.994 65.212 85.172 1.00 0.00 C
ATOM 7720 C MET A 481 100.619 64.169 84.307 1.00 0.00 C
ATOM 7721 O MET A 481 101.418 64.477 83.422 1.00 0.00 O
ATOM 7722 CB MET A 481 100.889 65.582 86.339 1.00 0.00 C
ATOM 7723 CG MET A 481 100.695 66.933 86.980 1.00 0.00 C
ATOM 7724 SD MET A 481 100.940 68.209 85.726 1.00 0.00 S
ATOM 7725 CE MET A 481 102.579 68.664 86.259 1.00 0.00 C
ATOM 7726 H MET A 481 98.678 64.555 86.638 1.00 0.00 H
ATOM 7727 HA MET A 481 99.954 66.128 84.583 1.00 0.00 H
ATOM 7728 HB2 MET A 481 100.900 64.815 87.114 1.00 0.00 H
ATOM 7729 HB3 MET A 481 101.895 65.655 85.926 1.00 0.00 H
ATOM 7730 HG2 MET A 481 99.704 67.072 87.412 1.00 0.00 H
ATOM 7731 HG3 MET A 481 101.206 67.130 87.923 1.00 0.00 H
ATOM 7732 HE1 MET A 481 102.535 69.017 87.289 1.00 0.00 H
ATOM 7733 HE2 MET A 481 103.314 67.860 86.250 1.00 0.00 H
ATOM 7734 HE3 MET A 481 102.972 69.437 85.598 1.00 0.00 H
ATOM 7735 N GLU A 482 100.274 62.860 84.561 1.00 0.00 N
ATOM 7736 CA GLU A 482 100.782 61.786 83.676 1.00 0.00 C
ATOM 7737 C GLU A 482 100.061 61.848 82.299 1.00 0.00 C
ATOM 7738 O GLU A 482 100.755 62.004 81.295 1.00 0.00 O
ATOM 7739 CB GLU A 482 100.744 60.393 84.334 1.00 0.00 C
ATOM 7740 CG GLU A 482 101.763 60.141 85.508 1.00 0.00 C
ATOM 7741 CD GLU A 482 103.234 60.247 85.103 1.00 0.00 C
ATOM 7742 OE1 GLU A 482 104.133 60.227 86.009 1.00 0.00 O
ATOM 7743 OE2 GLU A 482 103.607 60.556 83.924 1.00 0.00 O1-
ATOM 7744 H GLU A 482 99.667 62.601 85.325 1.00 0.00 H
ATOM 7745 HA GLU A 482 101.785 62.133 83.425 1.00 0.00 H
ATOM 7746 HB2 GLU A 482 99.711 60.133 84.567 1.00 0.00 H
ATOM 7747 HB3 GLU A 482 100.966 59.754 83.480 1.00 0.00 H
ATOM 7748 HG2 GLU A 482 101.570 60.813 86.344 1.00 0.00 H
ATOM 7749 HG3 GLU A 482 101.690 59.088 85.779 1.00 0.00 H
ATOM 7750 N PHE A 483 98.791 62.020 82.237 1.00 0.00 N
ATOM 7751 CA PHE A 483 98.022 62.533 81.126 1.00 0.00 C
ATOM 7752 C PHE A 483 98.645 63.708 80.412 1.00 0.00 C
ATOM 7753 O PHE A 483 98.805 63.690 79.190 1.00 0.00 O
ATOM 7754 CB PHE A 483 96.656 62.915 81.637 1.00 0.00 C
ATOM 7755 CG PHE A 483 95.695 63.483 80.662 1.00 0.00 C
ATOM 7756 CD1 PHE A 483 95.300 64.793 80.748 1.00 0.00 C
ATOM 7757 CD2 PHE A 483 95.203 62.708 79.639 1.00 0.00 C
ATOM 7758 CE1 PHE A 483 94.455 65.389 79.766 1.00 0.00 C
ATOM 7759 CE2 PHE A 483 94.396 63.269 78.601 1.00 0.00 C
ATOM 7760 CZ PHE A 483 94.021 64.600 78.673 1.00 0.00 C
ATOM 7761 H PHE A 483 98.189 61.910 83.041 1.00 0.00 H
ATOM 7762 HA PHE A 483 97.877 61.787 80.345 1.00 0.00 H
ATOM 7763 HB2 PHE A 483 96.114 62.071 82.065 1.00 0.00 H
ATOM 7764 HB3 PHE A 483 96.849 63.754 82.305 1.00 0.00 H
ATOM 7765 HD1 PHE A 483 95.730 65.434 81.503 1.00 0.00 H
ATOM 7766 HD2 PHE A 483 95.346 61.638 79.647 1.00 0.00 H
ATOM 7767 HE1 PHE A 483 94.145 66.418 79.873 1.00 0.00 H
ATOM 7768 HE2 PHE A 483 94.210 62.683 77.713 1.00 0.00 H
ATOM 7769 HZ PHE A 483 93.449 65.042 77.870 1.00 0.00 H
ATOM 7770 N SER A 484 99.190 64.679 81.175 1.00 0.00 N
ATOM 7771 CA SER A 484 99.771 65.863 80.694 1.00 0.00 C
ATOM 7772 C SER A 484 101.189 65.725 80.261 1.00 0.00 C
ATOM 7773 O SER A 484 101.669 66.723 79.594 1.00 0.00 O
ATOM 7774 CB SER A 484 99.724 67.072 81.670 1.00 0.00 C
ATOM 7775 OG SER A 484 98.401 67.334 82.046 1.00 0.00 O
ATOM 7776 H SER A 484 98.930 64.617 82.149 1.00 0.00 H
ATOM 7777 HA SER A 484 99.261 66.207 79.795 1.00 0.00 H
ATOM 7778 HB2 SER A 484 100.211 66.838 82.617 1.00 0.00 H
ATOM 7779 HB3 SER A 484 100.080 67.960 81.148 1.00 0.00 H
ATOM 7780 HG SER A 484 98.131 66.702 82.716 1.00 0.00 H
ATOM 7781 N ARG A 485 101.904 64.581 80.498 1.00 0.00 N
ATOM 7782 CA ARG A 485 103.204 64.179 79.898 1.00 0.00 C
ATOM 7783 C ARG A 485 103.116 63.932 78.406 1.00 0.00 C
ATOM 7784 O ARG A 485 104.141 64.009 77.749 1.00 0.00 O
ATOM 7785 CB ARG A 485 103.839 63.041 80.654 1.00 0.00 C
ATOM 7786 CG ARG A 485 105.277 62.700 80.297 1.00 0.00 C
ATOM 7787 CD ARG A 485 105.907 61.595 81.185 1.00 0.00 C
ATOM 7788 NE ARG A 485 105.619 61.707 82.585 1.00 0.00 N
ATOM 7789 CZ ARG A 485 106.452 62.193 83.478 1.00 0.00 C
ATOM 7790 NH1 ARG A 485 107.526 62.892 83.265 1.00 0.00 N1+
ATOM 7791 NH2 ARG A 485 106.150 61.937 84.744 1.00 0.00 N
ATOM 7792 H ARG A 485 101.542 63.900 81.150 1.00 0.00 H
ATOM 7793 HA ARG A 485 103.821 65.078 79.870 1.00 0.00 H
ATOM 7794 HB2 ARG A 485 103.655 63.266 81.704 1.00 0.00 H
ATOM 7795 HB3 ARG A 485 103.104 62.246 80.530 1.00 0.00 H
ATOM 7796 HG2 ARG A 485 105.333 62.296 79.286 1.00 0.00 H
ATOM 7797 HG3 ARG A 485 105.851 63.623 80.374 1.00 0.00 H
ATOM 7798 HD2 ARG A 485 105.486 60.632 80.898 1.00 0.00 H
ATOM 7799 HD3 ARG A 485 106.987 61.501 81.071 1.00 0.00 H
ATOM 7800 HE ARG A 485 104.830 61.239 83.007 1.00 0.00 H
ATOM 7801 HH11 ARG A 485 107.766 63.173 82.325 1.00 0.00 H
ATOM 7802 HH12 ARG A 485 108.148 63.172 84.010 1.00 0.00 H
ATOM 7803 HH21 ARG A 485 105.273 61.485 84.963 1.00 0.00 H
ATOM 7804 HH22 ARG A 485 106.676 62.394 85.475 1.00 0.00 H
ATOM 7805 N GLY A 486 101.925 63.513 77.907 1.00 0.00 N
ATOM 7806 CA GLY A 486 101.652 63.424 76.506 1.00 0.00 C
ATOM 7807 C GLY A 486 101.884 64.744 75.853 1.00 0.00 C
ATOM 7808 O GLY A 486 101.610 65.785 76.384 1.00 0.00 O
ATOM 7809 H GLY A 486 101.153 63.402 78.549 1.00 0.00 H
ATOM 7810 HA2 GLY A 486 102.214 62.629 76.017 1.00 0.00 H
ATOM 7811 HA3 GLY A 486 100.632 63.144 76.240 1.00 0.00 H
ATOM 7812 N CYS A 487 102.507 64.665 74.658 1.00 0.00 N
ATOM 7813 CA CYS A 487 102.859 65.859 73.957 1.00 0.00 C
ATOM 7814 C CYS A 487 101.666 66.817 73.700 1.00 0.00 C
ATOM 7815 O CYS A 487 100.571 66.374 73.352 1.00 0.00 O
ATOM 7816 CB CYS A 487 103.481 65.404 72.638 1.00 0.00 C
ATOM 7817 SG CYS A 487 104.357 66.853 71.740 1.00 0.00 S
ATOM 7818 H CYS A 487 102.605 63.745 74.251 1.00 0.00 H
ATOM 7819 HA CYS A 487 103.515 66.468 74.578 1.00 0.00 H
ATOM 7820 HB2 CYS A 487 104.213 64.613 72.803 1.00 0.00 H
ATOM 7821 HB3 CYS A 487 102.723 64.953 71.998 1.00 0.00 H
ATOM 7822 HG CYS A 487 105.309 67.170 72.622 1.00 0.00 H
ATOM 7823 N PRO A 488 101.755 68.175 73.898 1.00 0.00 N
ATOM 7824 CA PRO A 488 100.640 69.120 73.867 1.00 0.00 C
ATOM 7825 C PRO A 488 99.972 69.276 72.479 1.00 0.00 C
ATOM 7826 O PRO A 488 100.612 69.841 71.558 1.00 0.00 O
ATOM 7827 CB PRO A 488 101.092 70.495 74.336 1.00 0.00 C
ATOM 7828 CG PRO A 488 102.644 70.455 74.152 1.00 0.00 C
ATOM 7829 CD PRO A 488 102.999 68.968 74.318 1.00 0.00 C
ATOM 7830 HA PRO A 488 99.904 68.762 74.586 1.00 0.00 H
ATOM 7831 HB2 PRO A 488 100.579 71.272 73.769 1.00 0.00 H
ATOM 7832 HB3 PRO A 488 100.907 70.484 75.410 1.00 0.00 H
ATOM 7833 HG2 PRO A 488 102.855 70.822 73.147 1.00 0.00 H
ATOM 7834 HG3 PRO A 488 103.123 71.104 74.885 1.00 0.00 H
ATOM 7835 HD2 PRO A 488 103.941 68.769 73.807 1.00 0.00 H
ATOM 7836 HD3 PRO A 488 103.187 68.920 75.390 1.00 0.00 H
ATOM 7837 N ASN A 489 98.763 68.734 72.259 1.00 0.00 N
ATOM 7838 CA ASN A 489 97.983 68.538 71.087 1.00 0.00 C
ATOM 7839 C ASN A 489 96.530 68.803 71.269 1.00 0.00 C
ATOM 7840 O ASN A 489 95.856 69.395 70.377 1.00 0.00 O
ATOM 7841 CB ASN A 489 98.220 67.119 70.587 1.00 0.00 C
ATOM 7842 CG ASN A 489 99.544 67.053 69.796 1.00 0.00 C
ATOM 7843 ND2 ASN A 489 100.524 66.379 70.232 1.00 0.00 N
ATOM 7844 OD1 ASN A 489 99.588 67.544 68.654 1.00 0.00 O
ATOM 7845 H ASN A 489 98.465 68.202 73.063 1.00 0.00 H
ATOM 7846 HA ASN A 489 98.354 69.181 70.289 1.00 0.00 H
ATOM 7847 HB2 ASN A 489 98.201 66.609 71.550 1.00 0.00 H
ATOM 7848 HB3 ASN A 489 97.455 66.874 69.851 1.00 0.00 H
ATOM 7849 HD21 ASN A 489 101.257 66.233 69.553 1.00 0.00 H
ATOM 7850 HD22 ASN A 489 100.513 66.089 71.199 1.00 0.00 H
ATOM 7851 N LEU A 490 95.948 68.597 72.436 1.00 0.00 N
ATOM 7852 CA LEU A 490 94.562 68.831 72.784 1.00 0.00 C
ATOM 7853 C LEU A 490 94.298 70.364 72.760 1.00 0.00 C
ATOM 7854 O LEU A 490 95.182 71.128 73.250 1.00 0.00 O
ATOM 7855 CB LEU A 490 94.299 68.296 74.232 1.00 0.00 C
ATOM 7856 CG LEU A 490 93.473 66.954 74.292 1.00 0.00 C
ATOM 7857 CD1 LEU A 490 94.436 65.803 74.235 1.00 0.00 C
ATOM 7858 CD2 LEU A 490 92.625 66.794 75.572 1.00 0.00 C
ATOM 7859 H LEU A 490 96.558 68.437 73.225 1.00 0.00 H
ATOM 7860 HA LEU A 490 93.896 68.383 72.047 1.00 0.00 H
ATOM 7861 HB2 LEU A 490 95.202 68.338 74.842 1.00 0.00 H
ATOM 7862 HB3 LEU A 490 93.611 69.016 74.676 1.00 0.00 H
ATOM 7863 HG LEU A 490 92.904 66.866 73.366 1.00 0.00 H
ATOM 7864 HD11 LEU A 490 94.891 65.625 75.209 1.00 0.00 H
ATOM 7865 HD12 LEU A 490 93.890 64.875 74.062 1.00 0.00 H
ATOM 7866 HD13 LEU A 490 95.147 65.909 73.416 1.00 0.00 H
ATOM 7867 HD21 LEU A 490 91.838 67.548 75.603 1.00 0.00 H
ATOM 7868 HD22 LEU A 490 92.279 65.772 75.724 1.00 0.00 H
ATOM 7869 HD23 LEU A 490 93.296 67.004 76.405 1.00 0.00 H
ATOM 7870 N GLN A 491 93.147 70.808 72.268 1.00 0.00 N
ATOM 7871 CA GLN A 491 92.810 72.198 72.137 1.00 0.00 C
ATOM 7872 C GLN A 491 91.593 72.501 73.014 1.00 0.00 C
ATOM 7873 O GLN A 491 91.528 73.501 73.645 1.00 0.00 O
ATOM 7874 CB GLN A 491 92.618 72.617 70.698 1.00 0.00 C
ATOM 7875 CG GLN A 491 94.003 72.703 69.983 1.00 0.00 C
ATOM 7876 CD GLN A 491 94.069 73.741 68.887 1.00 0.00 C
ATOM 7877 NE2 GLN A 491 95.174 74.060 68.282 1.00 0.00 N
ATOM 7878 OE1 GLN A 491 93.068 74.361 68.547 1.00 0.00 O
ATOM 7879 H GLN A 491 92.566 70.155 71.762 1.00 0.00 H
ATOM 7880 HA GLN A 491 93.591 72.776 72.631 1.00 0.00 H
ATOM 7881 HB2 GLN A 491 91.800 72.047 70.256 1.00 0.00 H
ATOM 7882 HB3 GLN A 491 92.067 73.558 70.672 1.00 0.00 H
ATOM 7883 HG2 GLN A 491 94.776 72.875 70.733 1.00 0.00 H
ATOM 7884 HG3 GLN A 491 94.227 71.769 69.468 1.00 0.00 H
ATOM 7885 HE21 GLN A 491 95.158 74.875 67.686 1.00 0.00 H
ATOM 7886 HE22 GLN A 491 96.093 73.716 68.520 1.00 0.00 H
ATOM 7887 N LYS A 492 90.641 71.642 72.951 1.00 0.00 N
ATOM 7888 CA LYS A 492 89.362 71.816 73.745 1.00 0.00 C
ATOM 7889 C LYS A 492 89.142 70.679 74.688 1.00 0.00 C
ATOM 7890 O LYS A 492 89.402 69.537 74.194 1.00 0.00 O
ATOM 7891 CB LYS A 492 88.109 71.943 72.799 1.00 0.00 C
ATOM 7892 CG LYS A 492 88.146 73.113 71.730 1.00 0.00 C
ATOM 7893 CD LYS A 492 87.068 72.953 70.658 1.00 0.00 C
ATOM 7894 CE LYS A 492 86.773 74.134 69.657 1.00 0.00 C
ATOM 7895 NZ LYS A 492 87.805 74.276 68.605 1.00 0.00 N1+
ATOM 7896 H LYS A 492 90.724 70.763 72.461 1.00 0.00 H
ATOM 7897 HA LYS A 492 89.343 72.688 74.399 1.00 0.00 H
ATOM 7898 HB2 LYS A 492 87.903 70.993 72.305 1.00 0.00 H
ATOM 7899 HB3 LYS A 492 87.161 71.988 73.334 1.00 0.00 H
ATOM 7900 HG2 LYS A 492 87.892 74.020 72.279 1.00 0.00 H
ATOM 7901 HG3 LYS A 492 89.072 73.153 71.157 1.00 0.00 H
ATOM 7902 HD2 LYS A 492 87.306 72.081 70.049 1.00 0.00 H
ATOM 7903 HD3 LYS A 492 86.134 72.691 71.155 1.00 0.00 H
ATOM 7904 HE2 LYS A 492 85.866 74.011 69.066 1.00 0.00 H
ATOM 7905 HE3 LYS A 492 86.813 75.064 70.224 1.00 0.00 H
ATOM 7906 HZ1 LYS A 492 88.730 74.504 68.941 1.00 0.00 H
ATOM 7907 HZ2 LYS A 492 87.892 73.384 68.139 1.00 0.00 H
ATOM 7908 HZ3 LYS A 492 87.444 74.930 67.925 1.00 0.00 H
ATOM 7909 N LEU A 493 88.926 70.935 75.998 1.00 0.00 N
ATOM 7910 CA LEU A 493 88.709 69.857 76.979 1.00 0.00 C
ATOM 7911 C LEU A 493 87.516 70.023 77.945 1.00 0.00 C
ATOM 7912 O LEU A 493 87.437 71.026 78.608 1.00 0.00 O
ATOM 7913 CB LEU A 493 90.016 69.630 77.783 1.00 0.00 C
ATOM 7914 CG LEU A 493 89.962 68.541 78.854 1.00 0.00 C
ATOM 7915 CD1 LEU A 493 89.842 67.107 78.207 1.00 0.00 C
ATOM 7916 CD2 LEU A 493 91.285 68.483 79.676 1.00 0.00 C
ATOM 7917 H LEU A 493 89.112 71.856 76.368 1.00 0.00 H
ATOM 7918 HA LEU A 493 88.476 68.942 76.435 1.00 0.00 H
ATOM 7919 HB2 LEU A 493 90.734 69.357 77.009 1.00 0.00 H
ATOM 7920 HB3 LEU A 493 90.429 70.529 78.240 1.00 0.00 H
ATOM 7921 HG LEU A 493 89.136 68.775 79.524 1.00 0.00 H
ATOM 7922 HD11 LEU A 493 90.690 66.916 77.549 1.00 0.00 H
ATOM 7923 HD12 LEU A 493 89.794 66.230 78.852 1.00 0.00 H
ATOM 7924 HD13 LEU A 493 88.938 67.053 77.600 1.00 0.00 H
ATOM 7925 HD21 LEU A 493 91.248 67.663 80.393 1.00 0.00 H
ATOM 7926 HD22 LEU A 493 92.119 68.280 79.004 1.00 0.00 H
ATOM 7927 HD23 LEU A 493 91.435 69.326 80.350 1.00 0.00 H
ATOM 7928 N GLU A 494 86.673 69.018 78.070 1.00 0.00 N
ATOM 7929 CA GLU A 494 85.538 69.059 78.932 1.00 0.00 C
ATOM 7930 C GLU A 494 85.467 67.961 79.958 1.00 0.00 C
ATOM 7931 O GLU A 494 85.770 66.853 79.626 1.00 0.00 O
ATOM 7932 CB GLU A 494 84.260 68.910 78.082 1.00 0.00 C
ATOM 7933 CG GLU A 494 84.121 70.128 77.187 1.00 0.00 C
ATOM 7934 CD GLU A 494 82.893 70.082 76.233 1.00 0.00 C
ATOM 7935 OE1 GLU A 494 81.846 69.572 76.649 1.00 0.00 O
ATOM 7936 OE2 GLU A 494 82.942 70.573 75.078 1.00 0.00 O1-
ATOM 7937 H GLU A 494 86.879 68.148 77.601 1.00 0.00 H
ATOM 7938 HA GLU A 494 85.448 69.987 79.498 1.00 0.00 H
ATOM 7939 HB2 GLU A 494 84.332 67.927 77.618 1.00 0.00 H
ATOM 7940 HB3 GLU A 494 83.386 68.715 78.703 1.00 0.00 H
ATOM 7941 HG2 GLU A 494 83.816 70.942 77.844 1.00 0.00 H
ATOM 7942 HG3 GLU A 494 85.028 70.368 76.632 1.00 0.00 H
ATOM 7943 N MET A 495 85.267 68.277 81.258 1.00 0.00 N
ATOM 7944 CA MET A 495 85.418 67.301 82.428 1.00 0.00 C
ATOM 7945 C MET A 495 84.194 67.420 83.317 1.00 0.00 C
ATOM 7946 O MET A 495 83.763 68.438 83.801 1.00 0.00 O
ATOM 7947 CB MET A 495 86.713 67.541 83.149 1.00 0.00 C
ATOM 7948 CG MET A 495 87.994 67.104 82.349 1.00 0.00 C
ATOM 7949 SD MET A 495 89.425 66.610 83.330 1.00 0.00 S
ATOM 7950 CE MET A 495 89.928 68.187 83.824 1.00 0.00 C
ATOM 7951 H MET A 495 85.240 69.272 81.426 1.00 0.00 H
ATOM 7952 HA MET A 495 85.375 66.300 81.997 1.00 0.00 H
ATOM 7953 HB2 MET A 495 86.761 68.596 83.419 1.00 0.00 H
ATOM 7954 HB3 MET A 495 86.656 66.980 84.082 1.00 0.00 H
ATOM 7955 HG2 MET A 495 87.782 66.204 81.771 1.00 0.00 H
ATOM 7956 HG3 MET A 495 88.250 67.957 81.721 1.00 0.00 H
ATOM 7957 HE1 MET A 495 90.867 68.163 84.378 1.00 0.00 H
ATOM 7958 HE2 MET A 495 90.109 68.899 83.018 1.00 0.00 H
ATOM 7959 HE3 MET A 495 89.161 68.546 84.510 1.00 0.00 H
ATOM 7960 N ARG A 496 83.591 66.275 83.460 1.00 0.00 N
ATOM 7961 CA ARG A 496 82.385 66.094 84.284 1.00 0.00 C
ATOM 7962 C ARG A 496 82.570 64.871 85.112 1.00 0.00 C
ATOM 7963 O ARG A 496 82.533 63.790 84.537 1.00 0.00 O
ATOM 7964 CB ARG A 496 81.045 66.083 83.451 1.00 0.00 C
ATOM 7965 CG ARG A 496 79.881 66.298 84.402 1.00 0.00 C
ATOM 7966 CD ARG A 496 78.545 66.409 83.646 1.00 0.00 C
ATOM 7967 NE ARG A 496 77.511 67.019 84.469 1.00 0.00 N
ATOM 7968 CZ ARG A 496 76.481 66.462 85.125 1.00 0.00 C
ATOM 7969 NH1 ARG A 496 76.076 65.310 84.757 1.00 0.00 N1+
ATOM 7970 NH2 ARG A 496 75.848 67.202 86.001 1.00 0.00 N
ATOM 7971 H ARG A 496 83.997 65.535 82.906 1.00 0.00 H
ATOM 7972 HA ARG A 496 82.348 66.940 84.970 1.00 0.00 H
ATOM 7973 HB2 ARG A 496 81.054 66.974 82.823 1.00 0.00 H
ATOM 7974 HB3 ARG A 496 80.927 65.188 82.840 1.00 0.00 H
ATOM 7975 HG2 ARG A 496 79.868 65.426 85.055 1.00 0.00 H
ATOM 7976 HG3 ARG A 496 79.895 67.210 85.000 1.00 0.00 H
ATOM 7977 HD2 ARG A 496 78.751 67.068 82.803 1.00 0.00 H
ATOM 7978 HD3 ARG A 496 78.336 65.400 83.292 1.00 0.00 H
ATOM 7979 HE ARG A 496 77.816 67.909 84.838 1.00 0.00 H
ATOM 7980 HH11 ARG A 496 76.692 64.682 84.261 1.00 0.00 H
ATOM 7981 HH12 ARG A 496 75.252 64.945 85.213 1.00 0.00 H
ATOM 7982 HH21 ARG A 496 76.145 68.150 86.178 1.00 0.00 H
ATOM 7983 HH22 ARG A 496 75.145 66.749 86.568 1.00 0.00 H
ATOM 7984 N GLY A 497 82.752 65.036 86.418 1.00 0.00 N
ATOM 7985 CA GLY A 497 82.888 63.901 87.394 1.00 0.00 C
ATOM 7986 C GLY A 497 84.363 63.509 87.418 1.00 0.00 C
ATOM 7987 O GLY A 497 84.833 62.828 86.464 1.00 0.00 O
ATOM 7988 H GLY A 497 82.884 65.996 86.706 1.00 0.00 H
ATOM 7989 HA2 GLY A 497 82.555 64.256 88.369 1.00 0.00 H
ATOM 7990 HA3 GLY A 497 82.377 62.977 87.125 1.00 0.00 H
ATOM 7991 N CYS A 498 85.176 63.945 88.384 1.00 0.00 N
ATOM 7992 CA CYS A 498 86.580 63.516 88.562 1.00 0.00 C
ATOM 7993 C CYS A 498 86.999 63.503 89.964 1.00 0.00 C
ATOM 7994 O CYS A 498 86.457 64.226 90.793 1.00 0.00 O
ATOM 7995 CB CYS A 498 87.482 64.264 87.617 1.00 0.00 C
ATOM 7996 SG CYS A 498 87.629 66.027 88.054 1.00 0.00 S
ATOM 7997 H CYS A 498 84.844 64.545 89.125 1.00 0.00 H
ATOM 7998 HA CYS A 498 86.672 62.434 88.473 1.00 0.00 H
ATOM 7999 HB2 CYS A 498 88.489 63.855 87.700 1.00 0.00 H
ATOM 8000 HB3 CYS A 498 87.153 64.101 86.591 1.00 0.00 H
ATOM 8001 HG CYS A 498 86.451 66.565 87.727 1.00 0.00 H
ATOM 8002 N CYS A 499 87.900 62.566 90.316 1.00 0.00 N
ATOM 8003 CA CYS A 499 88.665 62.540 91.574 1.00 0.00 C
ATOM 8004 C CYS A 499 89.854 63.519 91.623 1.00 0.00 C
ATOM 8005 O CYS A 499 90.684 63.472 92.544 1.00 0.00 O
ATOM 8006 CB CYS A 499 89.084 61.097 91.958 1.00 0.00 C
ATOM 8007 SG CYS A 499 88.150 59.669 91.215 1.00 0.00 S
ATOM 8008 H CYS A 499 88.245 61.944 89.600 1.00 0.00 H
ATOM 8009 HA CYS A 499 87.882 62.852 92.266 1.00 0.00 H
ATOM 8010 HB2 CYS A 499 90.162 60.998 91.830 1.00 0.00 H
ATOM 8011 HB3 CYS A 499 88.953 60.985 93.034 1.00 0.00 H
ATOM 8012 HG CYS A 499 88.956 59.841 90.163 1.00 0.00 H
ATOM 8013 N PHE A 500 90.064 64.395 90.618 1.00 0.00 N
ATOM 8014 CA PHE A 500 91.186 65.348 90.585 1.00 0.00 C
ATOM 8015 C PHE A 500 90.795 66.620 91.387 1.00 0.00 C
ATOM 8016 O PHE A 500 89.718 66.786 91.868 1.00 0.00 O
ATOM 8017 CB PHE A 500 91.501 65.806 89.156 1.00 0.00 C
ATOM 8018 CG PHE A 500 91.425 64.728 88.174 1.00 0.00 C
ATOM 8019 CD1 PHE A 500 92.333 63.626 88.204 1.00 0.00 C
ATOM 8020 CD2 PHE A 500 90.616 64.792 87.048 1.00 0.00 C
ATOM 8021 CE1 PHE A 500 92.287 62.598 87.267 1.00 0.00 C
ATOM 8022 CE2 PHE A 500 90.536 63.687 86.084 1.00 0.00 C
ATOM 8023 CZ PHE A 500 91.322 62.515 86.287 1.00 0.00 C
ATOM 8024 H PHE A 500 89.325 64.436 89.931 1.00 0.00 H
ATOM 8025 HA PHE A 500 92.044 64.848 91.035 1.00 0.00 H
ATOM 8026 HB2 PHE A 500 90.769 66.581 88.930 1.00 0.00 H
ATOM 8027 HB3 PHE A 500 92.487 66.271 89.168 1.00 0.00 H
ATOM 8028 HD1 PHE A 500 93.021 63.523 89.030 1.00 0.00 H
ATOM 8029 HD2 PHE A 500 89.922 65.592 86.835 1.00 0.00 H
ATOM 8030 HE1 PHE A 500 92.964 61.757 87.285 1.00 0.00 H
ATOM 8031 HE2 PHE A 500 89.738 63.782 85.363 1.00 0.00 H
ATOM 8032 HZ PHE A 500 91.258 61.742 85.535 1.00 0.00 H
ATOM 8033 N SER A 501 91.814 67.477 91.627 1.00 0.00 N
ATOM 8034 CA SER A 501 91.715 68.719 92.511 1.00 0.00 C
ATOM 8035 C SER A 501 92.055 70.057 91.754 1.00 0.00 C
ATOM 8036 O SER A 501 92.556 69.855 90.624 1.00 0.00 O
ATOM 8037 CB SER A 501 92.684 68.578 93.641 1.00 0.00 C
ATOM 8038 OG SER A 501 94.031 68.563 93.085 1.00 0.00 O
ATOM 8039 H SER A 501 92.717 67.240 91.241 1.00 0.00 H
ATOM 8040 HA SER A 501 90.730 68.777 92.975 1.00 0.00 H
ATOM 8041 HB2 SER A 501 92.621 69.488 94.237 1.00 0.00 H
ATOM 8042 HB3 SER A 501 92.475 67.741 94.307 1.00 0.00 H
ATOM 8043 HG SER A 501 94.334 67.656 93.007 1.00 0.00 H
ATOM 8044 N GLU A 502 91.701 71.170 92.323 1.00 0.00 N
ATOM 8045 CA GLU A 502 92.105 72.374 91.630 1.00 0.00 C
ATOM 8046 C GLU A 502 93.613 72.538 91.319 1.00 0.00 C
ATOM 8047 O GLU A 502 94.001 73.075 90.268 1.00 0.00 O
ATOM 8048 CB GLU A 502 91.668 73.584 92.480 1.00 0.00 C
ATOM 8049 CG GLU A 502 90.280 73.496 93.095 1.00 0.00 C
ATOM 8050 CD GLU A 502 89.834 74.745 93.888 1.00 0.00 C
ATOM 8051 OE1 GLU A 502 90.535 75.796 93.781 1.00 0.00 O
ATOM 8052 OE2 GLU A 502 88.837 74.746 94.637 1.00 0.00 O1-
ATOM 8053 H GLU A 502 91.415 71.203 93.291 1.00 0.00 H
ATOM 8054 HA GLU A 502 91.615 72.472 90.661 1.00 0.00 H
ATOM 8055 HB2 GLU A 502 92.383 73.770 93.282 1.00 0.00 H
ATOM 8056 HB3 GLU A 502 91.649 74.390 91.746 1.00 0.00 H
ATOM 8057 HG2 GLU A 502 89.542 73.195 92.351 1.00 0.00 H
ATOM 8058 HG3 GLU A 502 90.263 72.664 93.800 1.00 0.00 H
ATOM 8059 N ARG A 503 94.494 72.268 92.291 1.00 0.00 N
ATOM 8060 CA ARG A 503 95.973 72.303 92.116 1.00 0.00 C
ATOM 8061 C ARG A 503 96.485 71.445 90.940 1.00 0.00 C
ATOM 8062 O ARG A 503 97.311 71.874 90.137 1.00 0.00 O
ATOM 8063 CB ARG A 503 96.609 71.838 93.385 1.00 0.00 C
ATOM 8064 CG ARG A 503 98.097 71.858 93.577 1.00 0.00 C
ATOM 8065 CD ARG A 503 98.781 73.186 93.298 1.00 0.00 C
ATOM 8066 NE ARG A 503 98.814 74.039 94.479 1.00 0.00 N
ATOM 8067 CZ ARG A 503 99.662 73.989 95.486 1.00 0.00 C
ATOM 8068 NH1 ARG A 503 100.809 73.333 95.484 1.00 0.00 N1+
ATOM 8069 NH2 ARG A 503 99.471 74.765 96.507 1.00 0.00 N
ATOM 8070 H ARG A 503 94.186 72.006 93.217 1.00 0.00 H
ATOM 8071 HA ARG A 503 96.210 73.356 91.967 1.00 0.00 H
ATOM 8072 HB2 ARG A 503 96.315 72.587 94.120 1.00 0.00 H
ATOM 8073 HB3 ARG A 503 96.206 70.878 93.709 1.00 0.00 H
ATOM 8074 HG2 ARG A 503 98.288 71.595 94.618 1.00 0.00 H
ATOM 8075 HG3 ARG A 503 98.582 71.182 92.872 1.00 0.00 H
ATOM 8076 HD2 ARG A 503 99.809 72.981 92.998 1.00 0.00 H
ATOM 8077 HD3 ARG A 503 98.306 73.660 92.439 1.00 0.00 H
ATOM 8078 HE ARG A 503 98.078 74.730 94.476 1.00 0.00 H
ATOM 8079 HH11 ARG A 503 100.987 72.615 94.796 1.00 0.00 H
ATOM 8080 HH12 ARG A 503 101.479 73.365 96.239 1.00 0.00 H
ATOM 8081 HH21 ARG A 503 98.568 75.216 96.521 1.00 0.00 H
ATOM 8082 HH22 ARG A 503 100.116 74.972 97.257 1.00 0.00 H
ATOM 8083 N ALA A 504 95.854 70.250 90.726 1.00 0.00 N
ATOM 8084 CA ALA A 504 96.107 69.296 89.694 1.00 0.00 C
ATOM 8085 C ALA A 504 95.674 69.769 88.282 1.00 0.00 C
ATOM 8086 O ALA A 504 96.433 69.649 87.342 1.00 0.00 O
ATOM 8087 CB ALA A 504 95.336 68.007 90.079 1.00 0.00 C
ATOM 8088 H ALA A 504 95.325 69.839 91.481 1.00 0.00 H
ATOM 8089 HA ALA A 504 97.152 68.987 89.675 1.00 0.00 H
ATOM 8090 HB1 ALA A 504 95.688 67.646 91.046 1.00 0.00 H
ATOM 8091 HB2 ALA A 504 94.257 68.150 90.020 1.00 0.00 H
ATOM 8092 HB3 ALA A 504 95.493 67.211 89.351 1.00 0.00 H
ATOM 8093 N ILE A 505 94.414 70.245 88.173 1.00 0.00 N
ATOM 8094 CA ILE A 505 93.874 70.938 86.969 1.00 0.00 C
ATOM 8095 C ILE A 505 94.820 72.034 86.579 1.00 0.00 C
ATOM 8096 O ILE A 505 95.167 72.132 85.399 1.00 0.00 O
ATOM 8097 CB ILE A 505 92.423 71.431 87.328 1.00 0.00 C
ATOM 8098 CG1 ILE A 505 91.455 70.230 87.466 1.00 0.00 C
ATOM 8099 CG2 ILE A 505 91.940 72.379 86.152 1.00 0.00 C
ATOM 8100 CD1 ILE A 505 90.077 70.593 87.983 1.00 0.00 C
ATOM 8101 H ILE A 505 93.796 70.166 88.968 1.00 0.00 H
ATOM 8102 HA ILE A 505 93.905 70.263 86.113 1.00 0.00 H
ATOM 8103 HB ILE A 505 92.529 72.084 88.195 1.00 0.00 H
ATOM 8104 HG12 ILE A 505 91.362 69.939 86.419 1.00 0.00 H
ATOM 8105 HG13 ILE A 505 91.829 69.456 88.136 1.00 0.00 H
ATOM 8106 HG21 ILE A 505 92.663 73.181 86.007 1.00 0.00 H
ATOM 8107 HG22 ILE A 505 91.772 71.826 85.228 1.00 0.00 H
ATOM 8108 HG23 ILE A 505 91.081 72.827 86.651 1.00 0.00 H
ATOM 8109 HD11 ILE A 505 89.424 69.749 88.206 1.00 0.00 H
ATOM 8110 HD12 ILE A 505 90.142 71.106 88.943 1.00 0.00 H
ATOM 8111 HD13 ILE A 505 89.698 71.402 87.359 1.00 0.00 H
ATOM 8112 N ALA A 506 95.244 72.968 87.506 1.00 0.00 N
ATOM 8113 CA ALA A 506 96.045 74.118 87.107 1.00 0.00 C
ATOM 8114 C ALA A 506 97.435 73.638 86.720 1.00 0.00 C
ATOM 8115 O ALA A 506 97.944 74.170 85.782 1.00 0.00 O
ATOM 8116 CB ALA A 506 96.127 75.156 88.308 1.00 0.00 C
ATOM 8117 H ALA A 506 94.940 72.955 88.469 1.00 0.00 H
ATOM 8118 HA ALA A 506 95.724 74.639 86.205 1.00 0.00 H
ATOM 8119 HB1 ALA A 506 96.309 74.579 89.215 1.00 0.00 H
ATOM 8120 HB2 ALA A 506 96.916 75.880 88.102 1.00 0.00 H
ATOM 8121 HB3 ALA A 506 95.123 75.564 88.419 1.00 0.00 H
ATOM 8122 N ALA A 507 97.948 72.614 87.451 1.00 0.00 N
ATOM 8123 CA ALA A 507 99.179 71.880 87.060 1.00 0.00 C
ATOM 8124 C ALA A 507 99.097 71.340 85.676 1.00 0.00 C
ATOM 8125 O ALA A 507 99.956 71.719 84.875 1.00 0.00 O
ATOM 8126 CB ALA A 507 99.521 70.664 88.000 1.00 0.00 C
ATOM 8127 H ALA A 507 97.467 72.183 88.227 1.00 0.00 H
ATOM 8128 HA ALA A 507 100.008 72.587 87.104 1.00 0.00 H
ATOM 8129 HB1 ALA A 507 98.607 70.108 88.211 1.00 0.00 H
ATOM 8130 HB2 ALA A 507 100.240 69.987 87.540 1.00 0.00 H
ATOM 8131 HB3 ALA A 507 99.978 71.081 88.898 1.00 0.00 H
ATOM 8132 N ALA A 508 98.064 70.601 85.293 1.00 0.00 N
ATOM 8133 CA ALA A 508 97.923 70.003 83.928 1.00 0.00 C
ATOM 8134 C ALA A 508 97.808 71.114 82.845 1.00 0.00 C
ATOM 8135 O ALA A 508 98.598 71.130 81.937 1.00 0.00 O
ATOM 8136 CB ALA A 508 96.664 69.110 83.987 1.00 0.00 C
ATOM 8137 H ALA A 508 97.428 70.298 86.016 1.00 0.00 H
ATOM 8138 HA ALA A 508 98.781 69.421 83.591 1.00 0.00 H
ATOM 8139 HB1 ALA A 508 95.792 69.749 84.132 1.00 0.00 H
ATOM 8140 HB2 ALA A 508 96.536 68.476 83.110 1.00 0.00 H
ATOM 8141 HB3 ALA A 508 96.786 68.545 84.911 1.00 0.00 H
ATOM 8142 N VAL A 509 96.994 72.216 82.983 1.00 0.00 N
ATOM 8143 CA VAL A 509 96.970 73.358 82.061 1.00 0.00 C
ATOM 8144 C VAL A 509 98.289 74.114 81.984 1.00 0.00 C
ATOM 8145 O VAL A 509 98.803 74.518 80.910 1.00 0.00 O
ATOM 8146 CB VAL A 509 95.768 74.276 82.270 1.00 0.00 C
ATOM 8147 CG1 VAL A 509 95.647 75.566 81.390 1.00 0.00 C
ATOM 8148 CG2 VAL A 509 94.454 73.438 82.131 1.00 0.00 C
ATOM 8149 H VAL A 509 96.484 72.292 83.852 1.00 0.00 H
ATOM 8150 HA VAL A 509 96.925 72.939 81.056 1.00 0.00 H
ATOM 8151 HB VAL A 509 95.856 74.593 83.310 1.00 0.00 H
ATOM 8152 HG11 VAL A 509 96.508 76.210 81.565 1.00 0.00 H
ATOM 8153 HG12 VAL A 509 95.678 75.305 80.332 1.00 0.00 H
ATOM 8154 HG13 VAL A 509 94.744 76.136 81.607 1.00 0.00 H
ATOM 8155 HG21 VAL A 509 93.622 74.099 82.372 1.00 0.00 H
ATOM 8156 HG22 VAL A 509 94.478 73.108 81.092 1.00 0.00 H
ATOM 8157 HG23 VAL A 509 94.438 72.651 82.886 1.00 0.00 H
ATOM 8158 N THR A 510 99.094 74.154 83.054 1.00 0.00 N
ATOM 8159 CA THR A 510 100.411 74.766 82.985 1.00 0.00 C
ATOM 8160 C THR A 510 101.344 73.957 82.091 1.00 0.00 C
ATOM 8161 O THR A 510 102.100 74.599 81.364 1.00 0.00 O
ATOM 8162 CB THR A 510 100.924 74.902 84.333 1.00 0.00 C
ATOM 8163 CG2 THR A 510 102.327 75.544 84.433 1.00 0.00 C
ATOM 8164 OG1 THR A 510 100.065 75.854 85.043 1.00 0.00 O
ATOM 8165 H THR A 510 98.828 73.777 83.953 1.00 0.00 H
ATOM 8166 HA THR A 510 100.311 75.809 82.682 1.00 0.00 H
ATOM 8167 HB THR A 510 100.991 73.899 84.755 1.00 0.00 H
ATOM 8168 HG1 THR A 510 99.318 75.265 85.178 1.00 0.00 H
ATOM 8169 HG21 THR A 510 102.656 75.391 85.461 1.00 0.00 H
ATOM 8170 HG22 THR A 510 102.990 75.103 83.689 1.00 0.00 H
ATOM 8171 HG23 THR A 510 102.275 76.595 84.150 1.00 0.00 H
ATOM 8172 N LYS A 511 101.264 72.592 82.077 1.00 0.00 N
ATOM 8173 CA LYS A 511 102.108 71.662 81.232 1.00 0.00 C
ATOM 8174 C LYS A 511 101.776 71.811 79.737 1.00 0.00 C
ATOM 8175 O LYS A 511 102.568 71.345 78.904 1.00 0.00 O
ATOM 8176 CB LYS A 511 101.853 70.203 81.646 1.00 0.00 C
ATOM 8177 CG LYS A 511 102.805 69.806 82.757 1.00 0.00 C
ATOM 8178 CD LYS A 511 104.201 69.483 82.066 1.00 0.00 C
ATOM 8179 CE LYS A 511 105.114 68.921 83.072 1.00 0.00 C
ATOM 8180 NZ LYS A 511 106.366 68.491 82.534 1.00 0.00 N1+
ATOM 8181 H LYS A 511 100.560 72.101 82.609 1.00 0.00 H
ATOM 8182 HA LYS A 511 103.160 71.932 81.327 1.00 0.00 H
ATOM 8183 HB2 LYS A 511 100.831 69.954 81.929 1.00 0.00 H
ATOM 8184 HB3 LYS A 511 101.930 69.500 80.816 1.00 0.00 H
ATOM 8185 HG2 LYS A 511 102.940 70.620 83.468 1.00 0.00 H
ATOM 8186 HG3 LYS A 511 102.452 68.914 83.275 1.00 0.00 H
ATOM 8187 HD2 LYS A 511 103.944 68.720 81.331 1.00 0.00 H
ATOM 8188 HD3 LYS A 511 104.592 70.408 81.642 1.00 0.00 H
ATOM 8189 HE2 LYS A 511 105.371 69.728 83.758 1.00 0.00 H
ATOM 8190 HE3 LYS A 511 104.655 68.131 83.666 1.00 0.00 H
ATOM 8191 HZ1 LYS A 511 106.815 67.821 83.142 1.00 0.00 H
ATOM 8192 HZ2 LYS A 511 106.175 67.931 81.716 1.00 0.00 H
ATOM 8193 HZ3 LYS A 511 106.989 69.182 82.140 1.00 0.00 H
ATOM 8194 N LEU A 512 100.547 72.174 79.422 1.00 0.00 N
ATOM 8195 CA LEU A 512 99.765 71.959 78.216 1.00 0.00 C
ATOM 8196 C LEU A 512 99.416 73.234 77.421 1.00 0.00 C
ATOM 8197 O LEU A 512 98.257 73.704 77.493 1.00 0.00 O
ATOM 8198 CB LEU A 512 98.603 71.011 78.558 1.00 0.00 C
ATOM 8199 CG LEU A 512 98.997 69.526 78.897 1.00 0.00 C
ATOM 8200 CD1 LEU A 512 97.724 68.868 79.328 1.00 0.00 C
ATOM 8201 CD2 LEU A 512 99.700 68.824 77.779 1.00 0.00 C
ATOM 8202 H LEU A 512 100.034 72.462 80.243 1.00 0.00 H
ATOM 8203 HA LEU A 512 100.372 71.376 77.524 1.00 0.00 H
ATOM 8204 HB2 LEU A 512 97.951 71.393 79.343 1.00 0.00 H
ATOM 8205 HB3 LEU A 512 97.961 71.082 77.679 1.00 0.00 H
ATOM 8206 HG LEU A 512 99.690 69.617 79.734 1.00 0.00 H
ATOM 8207 HD11 LEU A 512 97.770 67.780 79.286 1.00 0.00 H
ATOM 8208 HD12 LEU A 512 97.557 69.136 80.372 1.00 0.00 H
ATOM 8209 HD13 LEU A 512 96.788 69.207 78.883 1.00 0.00 H
ATOM 8210 HD21 LEU A 512 99.847 67.755 77.931 1.00 0.00 H
ATOM 8211 HD22 LEU A 512 99.250 69.012 76.805 1.00 0.00 H
ATOM 8212 HD23 LEU A 512 100.724 69.198 77.747 1.00 0.00 H
ATOM 8213 N PRO A 513 100.355 73.816 76.693 1.00 0.00 N
ATOM 8214 CA PRO A 513 100.251 75.099 75.961 1.00 0.00 C
ATOM 8215 C PRO A 513 99.266 75.164 74.732 1.00 0.00 C
ATOM 8216 O PRO A 513 98.793 76.186 74.310 1.00 0.00 O
ATOM 8217 CB PRO A 513 101.609 75.474 75.582 1.00 0.00 C
ATOM 8218 CG PRO A 513 102.485 74.160 75.646 1.00 0.00 C
ATOM 8219 CD PRO A 513 101.774 73.358 76.754 1.00 0.00 C
ATOM 8220 HA PRO A 513 99.810 75.872 76.591 1.00 0.00 H
ATOM 8221 HB2 PRO A 513 101.645 75.824 74.550 1.00 0.00 H
ATOM 8222 HB3 PRO A 513 102.016 76.128 76.353 1.00 0.00 H
ATOM 8223 HG2 PRO A 513 102.465 73.660 74.677 1.00 0.00 H
ATOM 8224 HG3 PRO A 513 103.542 74.385 75.785 1.00 0.00 H
ATOM 8225 HD2 PRO A 513 102.013 72.324 76.506 1.00 0.00 H
ATOM 8226 HD3 PRO A 513 102.070 73.695 77.747 1.00 0.00 H
ATOM 8227 N SER A 514 99.003 73.991 74.183 1.00 0.00 N
ATOM 8228 CA SER A 514 97.967 73.851 73.154 1.00 0.00 C
ATOM 8229 C SER A 514 96.473 73.941 73.544 1.00 0.00 C
ATOM 8230 O SER A 514 95.606 74.061 72.667 1.00 0.00 O
ATOM 8231 CB SER A 514 98.155 72.438 72.502 1.00 0.00 C
ATOM 8232 OG SER A 514 97.908 71.497 73.518 1.00 0.00 O
ATOM 8233 H SER A 514 99.450 73.172 74.569 1.00 0.00 H
ATOM 8234 HA SER A 514 98.035 74.538 72.311 1.00 0.00 H
ATOM 8235 HB2 SER A 514 97.441 72.265 71.696 1.00 0.00 H
ATOM 8236 HB3 SER A 514 99.152 72.300 72.083 1.00 0.00 H
ATOM 8237 HG SER A 514 96.967 71.313 73.553 1.00 0.00 H
ATOM 8238 N LEU A 515 96.126 73.913 74.824 1.00 0.00 N
ATOM 8239 CA LEU A 515 94.688 74.038 75.306 1.00 0.00 C
ATOM 8240 C LEU A 515 94.206 75.459 74.952 1.00 0.00 C
ATOM 8241 O LEU A 515 94.647 76.457 75.580 1.00 0.00 O
ATOM 8242 CB LEU A 515 94.514 73.593 76.763 1.00 0.00 C
ATOM 8243 CG LEU A 515 94.277 72.047 76.992 1.00 0.00 C
ATOM 8244 CD1 LEU A 515 94.357 71.673 78.453 1.00 0.00 C
ATOM 8245 CD2 LEU A 515 93.015 71.454 76.538 1.00 0.00 C
ATOM 8246 H LEU A 515 96.926 73.921 75.441 1.00 0.00 H
ATOM 8247 HA LEU A 515 94.086 73.387 74.672 1.00 0.00 H
ATOM 8248 HB2 LEU A 515 95.364 73.954 77.342 1.00 0.00 H
ATOM 8249 HB3 LEU A 515 93.677 74.134 77.203 1.00 0.00 H
ATOM 8250 HG LEU A 515 95.091 71.600 76.422 1.00 0.00 H
ATOM 8251 HD11 LEU A 515 94.577 70.609 78.548 1.00 0.00 H
ATOM 8252 HD12 LEU A 515 95.228 72.247 78.769 1.00 0.00 H
ATOM 8253 HD13 LEU A 515 93.419 71.859 78.976 1.00 0.00 H
ATOM 8254 HD21 LEU A 515 92.981 70.374 76.680 1.00 0.00 H
ATOM 8255 HD22 LEU A 515 92.181 71.976 77.007 1.00 0.00 H
ATOM 8256 HD23 LEU A 515 92.976 71.671 75.471 1.00 0.00 H
ATOM 8257 N ARG A 516 93.229 75.675 74.044 1.00 0.00 N
ATOM 8258 CA ARG A 516 92.540 76.959 73.768 1.00 0.00 C
ATOM 8259 C ARG A 516 91.197 77.194 74.540 1.00 0.00 C
ATOM 8260 O ARG A 516 90.767 78.363 74.551 1.00 0.00 O
ATOM 8261 CB ARG A 516 92.352 77.076 72.208 1.00 0.00 C
ATOM 8262 CG ARG A 516 93.680 77.052 71.457 1.00 0.00 C
ATOM 8263 CD ARG A 516 94.643 78.177 71.721 1.00 0.00 C
ATOM 8264 NE ARG A 516 95.361 78.046 73.032 1.00 0.00 N
ATOM 8265 CZ ARG A 516 96.067 78.990 73.616 1.00 0.00 C
ATOM 8266 NH1 ARG A 516 96.297 80.061 72.937 1.00 0.00 N1+
ATOM 8267 NH2 ARG A 516 96.416 78.843 74.876 1.00 0.00 N
ATOM 8268 H ARG A 516 92.897 74.858 73.552 1.00 0.00 H
ATOM 8269 HA ARG A 516 93.139 77.828 74.042 1.00 0.00 H
ATOM 8270 HB2 ARG A 516 91.817 76.195 71.853 1.00 0.00 H
ATOM 8271 HB3 ARG A 516 91.849 77.992 71.899 1.00 0.00 H
ATOM 8272 HG2 ARG A 516 94.176 76.101 71.653 1.00 0.00 H
ATOM 8273 HG3 ARG A 516 93.385 77.092 70.408 1.00 0.00 H
ATOM 8274 HD2 ARG A 516 95.352 78.242 70.895 1.00 0.00 H
ATOM 8275 HD3 ARG A 516 94.134 79.141 71.697 1.00 0.00 H
ATOM 8276 HE ARG A 516 95.077 77.268 73.611 1.00 0.00 H
ATOM 8277 HH11 ARG A 516 95.914 80.124 72.005 1.00 0.00 H
ATOM 8278 HH12 ARG A 516 96.590 80.872 73.464 1.00 0.00 H
ATOM 8279 HH21 ARG A 516 96.379 77.909 75.259 1.00 0.00 H
ATOM 8280 HH22 ARG A 516 96.839 79.616 75.369 1.00 0.00 H
ATOM 8281 N TYR A 517 90.621 76.133 75.102 1.00 0.00 N
ATOM 8282 CA TYR A 517 89.316 76.085 75.861 1.00 0.00 C
ATOM 8283 C TYR A 517 89.360 74.958 76.879 1.00 0.00 C
ATOM 8284 O TYR A 517 90.016 73.948 76.764 1.00 0.00 O
ATOM 8285 CB TYR A 517 88.228 75.856 74.778 1.00 0.00 C
ATOM 8286 CG TYR A 517 86.881 75.737 75.456 1.00 0.00 C
ATOM 8287 CD1 TYR A 517 86.428 74.492 75.979 1.00 0.00 C
ATOM 8288 CD2 TYR A 517 86.013 76.870 75.618 1.00 0.00 C
ATOM 8289 CE1 TYR A 517 85.095 74.291 76.505 1.00 0.00 C
ATOM 8290 CE2 TYR A 517 84.684 76.738 76.057 1.00 0.00 C
ATOM 8291 CZ TYR A 517 84.275 75.441 76.492 1.00 0.00 C
ATOM 8292 OH TYR A 517 82.942 75.390 76.801 1.00 0.00 O
ATOM 8293 H TYR A 517 91.229 75.327 75.088 1.00 0.00 H
ATOM 8294 HA TYR A 517 89.253 77.035 76.391 1.00 0.00 H
ATOM 8295 HB2 TYR A 517 88.237 76.714 74.105 1.00 0.00 H
ATOM 8296 HB3 TYR A 517 88.476 74.993 74.160 1.00 0.00 H
ATOM 8297 HD1 TYR A 517 87.092 73.641 75.959 1.00 0.00 H
ATOM 8298 HD2 TYR A 517 86.203 77.864 75.241 1.00 0.00 H
ATOM 8299 HE1 TYR A 517 84.741 73.395 76.993 1.00 0.00 H
ATOM 8300 HE2 TYR A 517 84.058 77.619 76.050 1.00 0.00 H
ATOM 8301 HH TYR A 517 82.514 74.568 76.548 1.00 0.00 H
ATOM 8302 N LEU A 518 88.631 75.147 77.984 1.00 0.00 N
ATOM 8303 CA LEU A 518 88.437 74.131 79.061 1.00 0.00 C
ATOM 8304 C LEU A 518 87.039 74.388 79.753 1.00 0.00 C
ATOM 8305 O LEU A 518 86.717 75.552 79.969 1.00 0.00 O
ATOM 8306 CB LEU A 518 89.653 74.143 80.020 1.00 0.00 C
ATOM 8307 CG LEU A 518 89.480 73.410 81.373 1.00 0.00 C
ATOM 8308 CD1 LEU A 518 89.323 71.875 81.119 1.00 0.00 C
ATOM 8309 CD2 LEU A 518 90.732 73.647 82.281 1.00 0.00 C
ATOM 8310 H LEU A 518 88.054 75.976 78.001 1.00 0.00 H
ATOM 8311 HA LEU A 518 88.515 73.186 78.523 1.00 0.00 H
ATOM 8312 HB2 LEU A 518 90.549 73.606 79.707 1.00 0.00 H
ATOM 8313 HB3 LEU A 518 89.892 75.181 80.254 1.00 0.00 H
ATOM 8314 HG LEU A 518 88.673 73.813 81.985 1.00 0.00 H
ATOM 8315 HD11 LEU A 518 88.363 71.550 80.717 1.00 0.00 H
ATOM 8316 HD12 LEU A 518 90.079 71.644 80.369 1.00 0.00 H
ATOM 8317 HD13 LEU A 518 89.531 71.200 81.949 1.00 0.00 H
ATOM 8318 HD21 LEU A 518 91.558 73.539 81.577 1.00 0.00 H
ATOM 8319 HD22 LEU A 518 90.625 74.682 82.602 1.00 0.00 H
ATOM 8320 HD23 LEU A 518 90.800 72.888 83.061 1.00 0.00 H
ATOM 8321 N TRP A 519 86.342 73.325 80.084 1.00 0.00 N
ATOM 8322 CA TRP A 519 85.286 73.327 81.051 1.00 0.00 C
ATOM 8323 C TRP A 519 85.405 72.156 82.066 1.00 0.00 C
ATOM 8324 O TRP A 519 85.442 71.060 81.562 1.00 0.00 O
ATOM 8325 CB TRP A 519 83.912 73.425 80.320 1.00 0.00 C
ATOM 8326 CG TRP A 519 82.743 73.312 81.252 1.00 0.00 C
ATOM 8327 CD1 TRP A 519 82.181 74.362 81.913 1.00 0.00 C
ATOM 8328 CD2 TRP A 519 82.049 72.084 81.644 1.00 0.00 C
ATOM 8329 CE2 TRP A 519 80.915 72.508 82.357 1.00 0.00 C
ATOM 8330 CE3 TRP A 519 82.169 70.721 81.367 1.00 0.00 C
ATOM 8331 NE1 TRP A 519 81.134 73.844 82.702 1.00 0.00 N
ATOM 8332 CZ2 TRP A 519 79.860 71.658 82.724 1.00 0.00 C
ATOM 8333 CZ3 TRP A 519 81.175 69.837 81.753 1.00 0.00 C
ATOM 8334 CH2 TRP A 519 79.973 70.309 82.422 1.00 0.00 C
ATOM 8335 H TRP A 519 86.569 72.408 79.726 1.00 0.00 H
ATOM 8336 HA TRP A 519 85.484 74.189 81.688 1.00 0.00 H
ATOM 8337 HB2 TRP A 519 83.772 74.359 79.776 1.00 0.00 H
ATOM 8338 HB3 TRP A 519 83.845 72.554 79.668 1.00 0.00 H
ATOM 8339 HD1 TRP A 519 82.490 75.397 81.876 1.00 0.00 H
ATOM 8340 HE1 TRP A 519 80.492 74.449 83.194 1.00 0.00 H
ATOM 8341 HE3 TRP A 519 83.084 70.365 80.916 1.00 0.00 H
ATOM 8342 HZ2 TRP A 519 79.029 71.938 83.355 1.00 0.00 H
ATOM 8343 HZ3 TRP A 519 81.295 68.776 81.587 1.00 0.00 H
ATOM 8344 HH2 TRP A 519 79.174 69.610 82.620 1.00 0.00 H
ATOM 8345 N VAL A 520 85.083 72.332 83.363 1.00 0.00 N
ATOM 8346 CA VAL A 520 85.231 71.242 84.405 1.00 0.00 C
ATOM 8347 C VAL A 520 84.177 71.361 85.486 1.00 0.00 C
ATOM 8348 O VAL A 520 84.046 72.410 86.090 1.00 0.00 O
ATOM 8349 CB VAL A 520 86.602 71.458 85.103 1.00 0.00 C
ATOM 8350 CG1 VAL A 520 86.764 70.253 85.981 1.00 0.00 C
ATOM 8351 CG2 VAL A 520 87.814 71.313 84.179 1.00 0.00 C
ATOM 8352 H VAL A 520 84.740 73.260 83.564 1.00 0.00 H
ATOM 8353 HA VAL A 520 85.101 70.243 83.990 1.00 0.00 H
ATOM 8354 HB VAL A 520 86.503 72.335 85.743 1.00 0.00 H
ATOM 8355 HG11 VAL A 520 86.233 70.332 86.930 1.00 0.00 H
ATOM 8356 HG12 VAL A 520 86.366 69.355 85.510 1.00 0.00 H
ATOM 8357 HG13 VAL A 520 87.759 69.907 86.260 1.00 0.00 H
ATOM 8358 HG21 VAL A 520 87.994 72.326 83.819 1.00 0.00 H
ATOM 8359 HG22 VAL A 520 88.721 71.252 84.781 1.00 0.00 H
ATOM 8360 HG23 VAL A 520 87.657 70.544 83.423 1.00 0.00 H
ATOM 8361 N GLN A 521 83.410 70.312 85.680 1.00 0.00 N
ATOM 8362 CA GLN A 521 82.408 70.088 86.705 1.00 0.00 C
ATOM 8363 C GLN A 521 82.720 68.891 87.613 1.00 0.00 C
ATOM 8364 O GLN A 521 82.984 67.797 87.120 1.00 0.00 O
ATOM 8365 CB GLN A 521 80.969 69.929 86.112 1.00 0.00 C
ATOM 8366 CG GLN A 521 79.921 69.884 87.260 1.00 0.00 C
ATOM 8367 CD GLN A 521 78.439 70.007 86.792 1.00 0.00 C
ATOM 8368 NE2 GLN A 521 77.876 71.190 87.009 1.00 0.00 N
ATOM 8369 OE1 GLN A 521 77.858 69.064 86.274 1.00 0.00 O
ATOM 8370 H GLN A 521 83.469 69.547 85.023 1.00 0.00 H
ATOM 8371 HA GLN A 521 82.611 70.967 87.317 1.00 0.00 H
ATOM 8372 HB2 GLN A 521 80.781 70.865 85.586 1.00 0.00 H
ATOM 8373 HB3 GLN A 521 80.935 69.096 85.409 1.00 0.00 H
ATOM 8374 HG2 GLN A 521 80.053 68.912 87.736 1.00 0.00 H
ATOM 8375 HG3 GLN A 521 80.255 70.636 87.976 1.00 0.00 H
ATOM 8376 HE21 GLN A 521 77.001 71.500 86.611 1.00 0.00 H
ATOM 8377 HE22 GLN A 521 78.324 71.943 87.511 1.00 0.00 H
ATOM 8378 N GLY A 522 82.701 69.087 88.933 1.00 0.00 N
ATOM 8379 CA GLY A 522 82.839 68.054 89.869 1.00 0.00 C
ATOM 8380 C GLY A 522 84.289 67.580 89.871 1.00 0.00 C
ATOM 8381 O GLY A 522 84.770 66.825 89.099 1.00 0.00 O
ATOM 8382 H GLY A 522 82.528 69.999 89.332 1.00 0.00 H
ATOM 8383 HA2 GLY A 522 82.450 68.395 90.828 1.00 0.00 H
ATOM 8384 HA3 GLY A 522 82.343 67.122 89.599 1.00 0.00 H
ATOM 8385 N TYR A 523 84.938 68.049 90.924 1.00 0.00 N
ATOM 8386 CA TYR A 523 86.370 68.002 91.215 1.00 0.00 C
ATOM 8387 C TYR A 523 86.619 68.265 92.674 1.00 0.00 C
ATOM 8388 O TYR A 523 85.766 68.926 93.307 1.00 0.00 O
ATOM 8389 CB TYR A 523 87.169 68.998 90.324 1.00 0.00 C
ATOM 8390 CG TYR A 523 86.653 70.406 90.364 1.00 0.00 C
ATOM 8391 CD1 TYR A 523 85.581 70.917 89.608 1.00 0.00 C
ATOM 8392 CD2 TYR A 523 87.202 71.299 91.283 1.00 0.00 C
ATOM 8393 CE1 TYR A 523 85.054 72.202 89.715 1.00 0.00 C
ATOM 8394 CE2 TYR A 523 86.693 72.655 91.418 1.00 0.00 C
ATOM 8395 CZ TYR A 523 85.688 73.144 90.602 1.00 0.00 C
ATOM 8396 OH TYR A 523 85.261 74.381 90.805 1.00 0.00 O
ATOM 8397 H TYR A 523 84.457 68.589 91.629 1.00 0.00 H
ATOM 8398 HA TYR A 523 86.732 66.983 91.082 1.00 0.00 H
ATOM 8399 HB2 TYR A 523 88.204 68.956 90.664 1.00 0.00 H
ATOM 8400 HB3 TYR A 523 87.093 68.622 89.304 1.00 0.00 H
ATOM 8401 HD1 TYR A 523 85.074 70.217 88.960 1.00 0.00 H
ATOM 8402 HD2 TYR A 523 87.999 70.871 91.872 1.00 0.00 H
ATOM 8403 HE1 TYR A 523 84.279 72.513 89.031 1.00 0.00 H
ATOM 8404 HE2 TYR A 523 87.202 73.298 92.120 1.00 0.00 H
ATOM 8405 HH TYR A 523 86.101 74.759 91.074 1.00 0.00 H
ATOM 8406 N ARG A 524 87.651 67.789 93.301 1.00 0.00 N
ATOM 8407 CA ARG A 524 88.025 68.074 94.699 1.00 0.00 C
ATOM 8408 C ARG A 524 88.408 69.572 94.872 1.00 0.00 C
ATOM 8409 O ARG A 524 89.335 70.047 94.221 1.00 0.00 O
ATOM 8410 CB ARG A 524 89.145 67.194 95.154 1.00 0.00 C
ATOM 8411 CG ARG A 524 88.595 65.768 95.481 1.00 0.00 C
ATOM 8412 CD ARG A 524 89.573 64.814 96.112 1.00 0.00 C
ATOM 8413 NE ARG A 524 90.669 64.526 95.230 1.00 0.00 N
ATOM 8414 CZ ARG A 524 91.876 65.011 95.096 1.00 0.00 C
ATOM 8415 NH1 ARG A 524 92.364 65.829 95.948 1.00 0.00 N1+
ATOM 8416 NH2 ARG A 524 92.590 64.664 94.105 1.00 0.00 N
ATOM 8417 H ARG A 524 88.379 67.324 92.778 1.00 0.00 H
ATOM 8418 HA ARG A 524 87.220 67.983 95.427 1.00 0.00 H
ATOM 8419 HB2 ARG A 524 89.980 67.284 94.459 1.00 0.00 H
ATOM 8420 HB3 ARG A 524 89.566 67.438 96.129 1.00 0.00 H
ATOM 8421 HG2 ARG A 524 87.692 65.728 96.090 1.00 0.00 H
ATOM 8422 HG3 ARG A 524 88.303 65.342 94.521 1.00 0.00 H
ATOM 8423 HD2 ARG A 524 89.899 65.262 97.050 1.00 0.00 H
ATOM 8424 HD3 ARG A 524 89.118 63.906 96.508 1.00 0.00 H
ATOM 8425 HE ARG A 524 90.470 63.855 94.501 1.00 0.00 H
ATOM 8426 HH11 ARG A 524 91.776 66.094 96.726 1.00 0.00 H
ATOM 8427 HH12 ARG A 524 93.349 66.054 95.953 1.00 0.00 H
ATOM 8428 HH21 ARG A 524 92.218 64.062 93.384 1.00 0.00 H
ATOM 8429 HH22 ARG A 524 93.487 65.113 93.987 1.00 0.00 H
ATOM 8430 N ALA A 525 87.760 70.301 95.783 1.00 0.00 N
ATOM 8431 CA ALA A 525 88.221 71.571 96.247 1.00 0.00 C
ATOM 8432 C ALA A 525 89.646 71.813 96.684 1.00 0.00 C
ATOM 8433 O ALA A 525 90.291 70.934 97.222 1.00 0.00 O
ATOM 8434 CB ALA A 525 87.314 71.887 97.505 1.00 0.00 C
ATOM 8435 H ALA A 525 87.043 69.948 96.400 1.00 0.00 H
ATOM 8436 HA ALA A 525 87.958 72.273 95.456 1.00 0.00 H
ATOM 8437 HB1 ALA A 525 87.396 72.965 97.641 1.00 0.00 H
ATOM 8438 HB2 ALA A 525 86.249 71.694 97.380 1.00 0.00 H
ATOM 8439 HB3 ALA A 525 87.677 71.328 98.368 1.00 0.00 H
ATOM 8440 N SER A 526 90.154 73.065 96.509 1.00 0.00 N
ATOM 8441 CA SER A 526 91.346 73.477 97.325 1.00 0.00 C
ATOM 8442 C SER A 526 90.996 73.892 98.773 1.00 0.00 C
ATOM 8443 O SER A 526 89.854 74.215 99.113 1.00 0.00 O
ATOM 8444 CB SER A 526 91.930 74.708 96.618 1.00 0.00 C
ATOM 8445 OG SER A 526 92.948 75.474 97.286 1.00 0.00 O
ATOM 8446 H SER A 526 89.605 73.741 95.997 1.00 0.00 H
ATOM 8447 HA SER A 526 92.070 72.662 97.351 1.00 0.00 H
ATOM 8448 HB2 SER A 526 92.386 74.442 95.664 1.00 0.00 H
ATOM 8449 HB3 SER A 526 91.110 75.358 96.315 1.00 0.00 H
ATOM 8450 HG SER A 526 93.757 75.095 96.934 1.00 0.00 H
ATOM 8451 N MET A 527 91.979 73.823 99.683 1.00 0.00 N
ATOM 8452 CA MET A 527 91.848 74.185 101.125 1.00 0.00 C
ATOM 8453 C MET A 527 91.887 75.725 101.338 1.00 0.00 C
ATOM 8454 O MET A 527 91.023 76.298 101.983 1.00 0.00 O
ATOM 8455 CB MET A 527 92.880 73.459 102.059 1.00 0.00 C
ATOM 8456 CG MET A 527 94.337 73.696 101.789 1.00 0.00 C
ATOM 8457 SD MET A 527 95.111 73.358 100.223 1.00 0.00 S
ATOM 8458 CE MET A 527 94.796 71.549 100.202 1.00 0.00 C
ATOM 8459 H MET A 527 92.869 73.444 99.393 1.00 0.00 H
ATOM 8460 HA MET A 527 90.845 73.944 101.477 1.00 0.00 H
ATOM 8461 HB2 MET A 527 92.788 73.686 103.121 1.00 0.00 H
ATOM 8462 HB3 MET A 527 92.752 72.377 102.024 1.00 0.00 H
ATOM 8463 HG2 MET A 527 94.531 74.735 102.054 1.00 0.00 H
ATOM 8464 HG3 MET A 527 94.941 73.318 102.614 1.00 0.00 H
ATOM 8465 HE1 MET A 527 95.479 71.055 99.511 1.00 0.00 H
ATOM 8466 HE2 MET A 527 94.887 71.115 101.197 1.00 0.00 H
ATOM 8467 HE3 MET A 527 93.744 71.343 100.007 1.00 0.00 H
ATOM 8468 N THR A 528 92.898 76.328 100.790 1.00 0.00 N
ATOM 8469 CA THR A 528 93.102 77.792 100.685 1.00 0.00 C
ATOM 8470 C THR A 528 92.227 78.644 99.901 1.00 0.00 C
ATOM 8471 O THR A 528 92.119 79.804 100.161 1.00 0.00 O
ATOM 8472 CB THR A 528 94.601 77.946 100.136 1.00 0.00 C
ATOM 8473 CG2 THR A 528 95.533 77.417 101.105 1.00 0.00 C
ATOM 8474 OG1 THR A 528 94.772 77.291 98.896 1.00 0.00 O
ATOM 8475 H THR A 528 93.476 75.738 100.208 1.00 0.00 H
ATOM 8476 HA THR A 528 93.174 78.266 101.664 1.00 0.00 H
ATOM 8477 HB THR A 528 94.813 79.002 99.972 1.00 0.00 H
ATOM 8478 HG1 THR A 528 95.719 77.133 98.896 1.00 0.00 H
ATOM 8479 HG21 THR A 528 95.710 76.341 101.100 1.00 0.00 H
ATOM 8480 HG22 THR A 528 96.436 78.015 100.982 1.00 0.00 H
ATOM 8481 HG23 THR A 528 95.260 77.652 102.134 1.00 0.00 H
ATOM 8482 N GLY A 529 91.845 78.091 98.736 1.00 0.00 N
ATOM 8483 CA GLY A 529 91.358 78.717 97.487 1.00 0.00 C
ATOM 8484 C GLY A 529 92.498 79.608 96.924 1.00 0.00 C
ATOM 8485 O GLY A 529 92.193 80.724 96.384 1.00 0.00 O
ATOM 8486 H GLY A 529 91.943 77.087 98.680 1.00 0.00 H
ATOM 8487 HA2 GLY A 529 91.154 77.866 96.838 1.00 0.00 H
ATOM 8488 HA3 GLY A 529 90.438 79.300 97.529 1.00 0.00 H
ATOM 8489 N GLN A 530 93.768 79.261 96.916 1.00 0.00 N
ATOM 8490 CA GLN A 530 94.854 79.904 96.225 1.00 0.00 C
ATOM 8491 C GLN A 530 95.697 79.014 95.281 1.00 0.00 C
ATOM 8492 O GLN A 530 96.922 79.230 95.096 1.00 0.00 O
ATOM 8493 CB GLN A 530 95.746 80.732 97.165 1.00 0.00 C
ATOM 8494 CG GLN A 530 94.929 81.729 97.991 1.00 0.00 C
ATOM 8495 CD GLN A 530 94.373 82.938 97.153 1.00 0.00 C
ATOM 8496 NE2 GLN A 530 94.390 84.072 97.796 1.00 0.00 N
ATOM 8497 OE1 GLN A 530 93.983 82.864 96.027 1.00 0.00 O
ATOM 8498 H GLN A 530 93.972 78.442 97.472 1.00 0.00 H
ATOM 8499 HA GLN A 530 94.439 80.565 95.465 1.00 0.00 H
ATOM 8500 HB2 GLN A 530 96.212 80.068 97.893 1.00 0.00 H
ATOM 8501 HB3 GLN A 530 96.490 81.331 96.639 1.00 0.00 H
ATOM 8502 HG2 GLN A 530 94.160 81.197 98.551 1.00 0.00 H
ATOM 8503 HG3 GLN A 530 95.632 82.035 98.765 1.00 0.00 H
ATOM 8504 HE21 GLN A 530 94.431 84.964 97.325 1.00 0.00 H
ATOM 8505 HE22 GLN A 530 94.821 84.068 98.709 1.00 0.00 H
ATOM 8506 N ASP A 531 95.040 77.958 94.782 1.00 0.00 N
ATOM 8507 CA ASP A 531 95.629 76.987 93.896 1.00 0.00 C
ATOM 8508 C ASP A 531 95.140 77.217 92.400 1.00 0.00 C
ATOM 8509 O ASP A 531 95.962 77.234 91.525 1.00 0.00 O
ATOM 8510 CB ASP A 531 95.172 75.523 94.188 1.00 0.00 C
ATOM 8511 CG ASP A 531 95.643 75.026 95.552 1.00 0.00 C
ATOM 8512 OD1 ASP A 531 96.647 75.465 96.133 1.00 0.00 O
ATOM 8513 OD2 ASP A 531 94.981 74.036 96.053 1.00 0.00 O1-
ATOM 8514 H ASP A 531 94.051 77.783 94.890 1.00 0.00 H
ATOM 8515 HA ASP A 531 96.716 76.995 93.978 1.00 0.00 H
ATOM 8516 HB2 ASP A 531 94.087 75.427 94.143 1.00 0.00 H
ATOM 8517 HB3 ASP A 531 95.645 74.932 93.403 1.00 0.00 H
ATOM 8518 N LEU A 532 93.851 77.609 92.152 1.00 0.00 N
ATOM 8519 CA LEU A 532 93.478 77.686 90.682 1.00 0.00 C
ATOM 8520 C LEU A 532 94.101 78.912 90.079 1.00 0.00 C
ATOM 8521 O LEU A 532 94.343 78.890 88.881 1.00 0.00 O
ATOM 8522 CB LEU A 532 91.947 77.733 90.529 1.00 0.00 C
ATOM 8523 CG LEU A 532 91.290 77.721 89.104 1.00 0.00 C
ATOM 8524 CD1 LEU A 532 91.633 76.428 88.441 1.00 0.00 C
ATOM 8525 CD2 LEU A 532 89.767 77.918 89.338 1.00 0.00 C
ATOM 8526 H LEU A 532 93.171 77.763 92.882 1.00 0.00 H
ATOM 8527 HA LEU A 532 93.877 76.817 90.160 1.00 0.00 H
ATOM 8528 HB2 LEU A 532 91.567 76.857 91.054 1.00 0.00 H
ATOM 8529 HB3 LEU A 532 91.522 78.612 91.014 1.00 0.00 H
ATOM 8530 HG LEU A 532 91.733 78.554 88.558 1.00 0.00 H
ATOM 8531 HD11 LEU A 532 91.123 76.374 87.479 1.00 0.00 H
ATOM 8532 HD12 LEU A 532 92.711 76.349 88.299 1.00 0.00 H
ATOM 8533 HD13 LEU A 532 91.325 75.632 89.119 1.00 0.00 H
ATOM 8534 HD21 LEU A 532 89.390 77.087 89.935 1.00 0.00 H
ATOM 8535 HD22 LEU A 532 89.573 78.875 89.821 1.00 0.00 H
ATOM 8536 HD23 LEU A 532 89.244 77.952 88.382 1.00 0.00 H
ATOM 8537 N MET A 533 94.410 79.985 90.853 1.00 0.00 N
ATOM 8538 CA MET A 533 95.016 81.232 90.292 1.00 0.00 C
ATOM 8539 C MET A 533 96.409 81.051 89.680 1.00 0.00 C
ATOM 8540 O MET A 533 96.888 81.947 88.971 1.00 0.00 O
ATOM 8541 CB MET A 533 95.187 82.185 91.441 1.00 0.00 C
ATOM 8542 CG MET A 533 96.060 81.674 92.574 1.00 0.00 C
ATOM 8543 SD MET A 533 96.102 82.931 93.913 1.00 0.00 S
ATOM 8544 CE MET A 533 96.765 84.384 93.069 1.00 0.00 C
ATOM 8545 H MET A 533 94.006 80.056 91.776 1.00 0.00 H
ATOM 8546 HA MET A 533 94.352 81.608 89.513 1.00 0.00 H
ATOM 8547 HB2 MET A 533 95.502 83.128 90.994 1.00 0.00 H
ATOM 8548 HB3 MET A 533 94.239 82.396 91.937 1.00 0.00 H
ATOM 8549 HG2 MET A 533 95.687 80.755 93.027 1.00 0.00 H
ATOM 8550 HG3 MET A 533 97.120 81.554 92.348 1.00 0.00 H
ATOM 8551 HE1 MET A 533 96.766 85.282 93.686 1.00 0.00 H
ATOM 8552 HE2 MET A 533 97.793 84.231 92.740 1.00 0.00 H
ATOM 8553 HE3 MET A 533 96.112 84.572 92.216 1.00 0.00 H
ATOM 8554 N GLN A 534 97.077 79.827 89.932 1.00 0.00 N
ATOM 8555 CA GLN A 534 98.279 79.323 89.278 1.00 0.00 C
ATOM 8556 C GLN A 534 98.188 79.330 87.791 1.00 0.00 C
ATOM 8557 O GLN A 534 98.999 79.986 87.118 1.00 0.00 O
ATOM 8558 CB GLN A 534 98.752 78.020 89.927 1.00 0.00 C
ATOM 8559 CG GLN A 534 98.985 78.406 91.379 1.00 0.00 C
ATOM 8560 CD GLN A 534 99.260 77.167 92.211 1.00 0.00 C
ATOM 8561 NE2 GLN A 534 99.644 77.251 93.519 1.00 0.00 N
ATOM 8562 OE1 GLN A 534 99.038 76.067 91.738 1.00 0.00 O
ATOM 8563 H GLN A 534 96.617 79.183 90.560 1.00 0.00 H
ATOM 8564 HA GLN A 534 98.981 80.148 89.399 1.00 0.00 H
ATOM 8565 HB2 GLN A 534 97.891 77.353 89.885 1.00 0.00 H
ATOM 8566 HB3 GLN A 534 99.558 77.586 89.334 1.00 0.00 H
ATOM 8567 HG2 GLN A 534 99.769 79.149 91.524 1.00 0.00 H
ATOM 8568 HG3 GLN A 534 98.111 78.818 91.884 1.00 0.00 H
ATOM 8569 HE21 GLN A 534 99.801 76.432 94.087 1.00 0.00 H
ATOM 8570 HE22 GLN A 534 99.643 78.186 93.902 1.00 0.00 H
ATOM 8571 N MET A 535 97.143 78.741 87.188 1.00 0.00 N
ATOM 8572 CA MET A 535 96.962 78.697 85.689 1.00 0.00 C
ATOM 8573 C MET A 535 96.472 80.054 85.107 1.00 0.00 C
ATOM 8574 O MET A 535 96.122 80.052 83.861 1.00 0.00 O
ATOM 8575 CB MET A 535 96.104 77.491 85.312 1.00 0.00 C
ATOM 8576 CG MET A 535 94.681 77.518 85.822 1.00 0.00 C
ATOM 8577 SD MET A 535 93.552 76.467 84.866 1.00 0.00 S
ATOM 8578 CE MET A 535 93.254 77.681 83.532 1.00 0.00 C
ATOM 8579 H MET A 535 96.341 78.510 87.756 1.00 0.00 H
ATOM 8580 HA MET A 535 97.956 78.539 85.272 1.00 0.00 H
ATOM 8581 HB2 MET A 535 95.892 77.416 84.245 1.00 0.00 H
ATOM 8582 HB3 MET A 535 96.630 76.579 85.595 1.00 0.00 H
ATOM 8583 HG2 MET A 535 94.715 77.303 86.890 1.00 0.00 H
ATOM 8584 HG3 MET A 535 94.415 78.547 85.581 1.00 0.00 H
ATOM 8585 HE1 MET A 535 92.871 77.281 82.593 1.00 0.00 H
ATOM 8586 HE2 MET A 535 92.466 78.390 83.785 1.00 0.00 H
ATOM 8587 HE3 MET A 535 94.199 78.133 83.230 1.00 0.00 H
ATOM 8588 N ALA A 536 96.474 81.199 85.769 1.00 0.00 N
ATOM 8589 CA ALA A 536 96.131 82.500 85.181 1.00 0.00 C
ATOM 8590 C ALA A 536 97.224 82.984 84.286 1.00 0.00 C
ATOM 8591 O ALA A 536 98.375 82.810 84.642 1.00 0.00 O
ATOM 8592 CB ALA A 536 95.707 83.429 86.313 1.00 0.00 C
ATOM 8593 H ALA A 536 96.861 81.123 86.699 1.00 0.00 H
ATOM 8594 HA ALA A 536 95.227 82.411 84.578 1.00 0.00 H
ATOM 8595 HB1 ALA A 536 94.887 82.953 86.851 1.00 0.00 H
ATOM 8596 HB2 ALA A 536 96.537 83.625 86.992 1.00 0.00 H
ATOM 8597 HB3 ALA A 536 95.308 84.353 85.895 1.00 0.00 H
ATOM 8598 N ARG A 537 96.883 83.525 83.086 1.00 0.00 N
ATOM 8599 CA ARG A 537 97.914 84.124 82.152 1.00 0.00 C
ATOM 8600 C ARG A 537 97.341 85.456 81.454 1.00 0.00 C
ATOM 8601 O ARG A 537 96.120 85.616 81.502 1.00 0.00 O
ATOM 8602 CB ARG A 537 98.281 83.111 81.025 1.00 0.00 C
ATOM 8603 CG ARG A 537 99.091 81.870 81.531 1.00 0.00 C
ATOM 8604 CD ARG A 537 100.538 82.177 81.937 1.00 0.00 C
ATOM 8605 NE ARG A 537 101.155 80.849 82.294 1.00 0.00 N
ATOM 8606 CZ ARG A 537 100.987 80.231 83.454 1.00 0.00 C
ATOM 8607 NH1 ARG A 537 100.360 80.699 84.531 1.00 0.00 N1+
ATOM 8608 NH2 ARG A 537 101.387 79.001 83.610 1.00 0.00 N
ATOM 8609 H ARG A 537 95.922 83.738 82.861 1.00 0.00 H
ATOM 8610 HA ARG A 537 98.843 84.337 82.682 1.00 0.00 H
ATOM 8611 HB2 ARG A 537 97.410 82.767 80.467 1.00 0.00 H
ATOM 8612 HB3 ARG A 537 98.947 83.561 80.290 1.00 0.00 H
ATOM 8613 HG2 ARG A 537 98.590 81.465 82.411 1.00 0.00 H
ATOM 8614 HG3 ARG A 537 99.053 81.133 80.729 1.00 0.00 H
ATOM 8615 HD2 ARG A 537 101.109 82.530 81.078 1.00 0.00 H
ATOM 8616 HD3 ARG A 537 100.495 82.876 82.772 1.00 0.00 H
ATOM 8617 HE ARG A 537 101.697 80.430 81.552 1.00 0.00 H
ATOM 8618 HH11 ARG A 537 99.835 81.562 84.558 1.00 0.00 H
ATOM 8619 HH12 ARG A 537 100.369 80.162 85.387 1.00 0.00 H
ATOM 8620 HH21 ARG A 537 101.982 78.627 82.884 1.00 0.00 H
ATOM 8621 HH22 ARG A 537 101.121 78.529 84.462 1.00 0.00 H
ATOM 8622 N PRO A 538 98.137 86.274 80.802 1.00 0.00 N
ATOM 8623 CA PRO A 538 97.750 87.304 79.898 1.00 0.00 C
ATOM 8624 C PRO A 538 97.230 86.808 78.586 1.00 0.00 C
ATOM 8625 O PRO A 538 97.824 85.821 78.094 1.00 0.00 O
ATOM 8626 CB PRO A 538 99.016 88.173 79.653 1.00 0.00 C
ATOM 8627 CG PRO A 538 100.082 87.619 80.525 1.00 0.00 C
ATOM 8628 CD PRO A 538 99.595 86.268 80.969 1.00 0.00 C
ATOM 8629 HA PRO A 538 96.990 87.953 80.333 1.00 0.00 H
ATOM 8630 HB2 PRO A 538 99.487 88.012 78.684 1.00 0.00 H
ATOM 8631 HB3 PRO A 538 98.875 89.235 79.853 1.00 0.00 H
ATOM 8632 HG2 PRO A 538 100.949 87.499 79.876 1.00 0.00 H
ATOM 8633 HG3 PRO A 538 100.229 88.167 81.455 1.00 0.00 H
ATOM 8634 HD2 PRO A 538 100.031 85.552 80.272 1.00 0.00 H
ATOM 8635 HD3 PRO A 538 99.837 86.147 82.025 1.00 0.00 H
ATOM 8636 N TYR A 539 96.230 87.442 78.058 1.00 0.00 N
ATOM 8637 CA TYR A 539 95.455 87.018 76.881 1.00 0.00 C
ATOM 8638 C TYR A 539 94.764 85.607 77.045 1.00 0.00 C
ATOM 8639 O TYR A 539 94.278 85.004 76.073 1.00 0.00 O
ATOM 8640 CB TYR A 539 96.152 87.203 75.556 1.00 0.00 C
ATOM 8641 CG TYR A 539 96.206 88.720 75.249 1.00 0.00 C
ATOM 8642 CD1 TYR A 539 95.121 89.336 74.575 1.00 0.00 C
ATOM 8643 CD2 TYR A 539 97.285 89.540 75.574 1.00 0.00 C
ATOM 8644 CE1 TYR A 539 95.128 90.696 74.196 1.00 0.00 C
ATOM 8645 CE2 TYR A 539 97.282 90.907 75.214 1.00 0.00 C
ATOM 8646 CZ TYR A 539 96.252 91.498 74.539 1.00 0.00 C
ATOM 8647 OH TYR A 539 96.313 92.827 74.120 1.00 0.00 O
ATOM 8648 H TYR A 539 95.852 88.191 78.620 1.00 0.00 H
ATOM 8649 HA TYR A 539 94.657 87.753 76.780 1.00 0.00 H
ATOM 8650 HB2 TYR A 539 97.142 86.750 75.607 1.00 0.00 H
ATOM 8651 HB3 TYR A 539 95.552 86.739 74.773 1.00 0.00 H
ATOM 8652 HD1 TYR A 539 94.202 88.815 74.352 1.00 0.00 H
ATOM 8653 HD2 TYR A 539 98.084 89.041 76.103 1.00 0.00 H
ATOM 8654 HE1 TYR A 539 94.287 91.103 73.654 1.00 0.00 H
ATOM 8655 HE2 TYR A 539 98.053 91.576 75.567 1.00 0.00 H
ATOM 8656 HH TYR A 539 97.186 93.226 74.092 1.00 0.00 H
ATOM 8657 N TRP A 540 94.612 85.196 78.296 1.00 0.00 N
ATOM 8658 CA TRP A 540 93.954 83.895 78.725 1.00 0.00 C
ATOM 8659 C TRP A 540 92.887 84.181 79.800 1.00 0.00 C
ATOM 8660 O TRP A 540 93.130 84.764 80.810 1.00 0.00 O
ATOM 8661 CB TRP A 540 94.899 82.863 79.251 1.00 0.00 C
ATOM 8662 CG TRP A 540 94.366 81.609 79.813 1.00 0.00 C
ATOM 8663 CD1 TRP A 540 94.017 81.371 81.112 1.00 0.00 C
ATOM 8664 CD2 TRP A 540 93.850 80.402 79.132 1.00 0.00 C
ATOM 8665 CE2 TRP A 540 93.431 79.411 80.100 1.00 0.00 C
ATOM 8666 CE3 TRP A 540 93.777 79.988 77.821 1.00 0.00 C
ATOM 8667 NE1 TRP A 540 93.432 80.087 81.293 1.00 0.00 N
ATOM 8668 CZ2 TRP A 540 92.967 78.152 79.741 1.00 0.00 C
ATOM 8669 CZ3 TRP A 540 93.294 78.774 77.422 1.00 0.00 C
ATOM 8670 CH2 TRP A 540 92.845 77.875 78.376 1.00 0.00 C
ATOM 8671 H TRP A 540 94.975 85.819 79.003 1.00 0.00 H
ATOM 8672 HA TRP A 540 93.401 83.569 77.844 1.00 0.00 H
ATOM 8673 HB2 TRP A 540 95.540 82.637 78.399 1.00 0.00 H
ATOM 8674 HB3 TRP A 540 95.567 83.379 79.940 1.00 0.00 H
ATOM 8675 HD1 TRP A 540 94.320 82.041 81.903 1.00 0.00 H
ATOM 8676 HE1 TRP A 540 93.133 79.673 82.164 1.00 0.00 H
ATOM 8677 HE3 TRP A 540 94.239 80.656 77.109 1.00 0.00 H
ATOM 8678 HZ2 TRP A 540 92.601 77.424 80.450 1.00 0.00 H
ATOM 8679 HZ3 TRP A 540 93.308 78.526 76.371 1.00 0.00 H
ATOM 8680 HH2 TRP A 540 92.610 76.856 78.105 1.00 0.00 H
ATOM 8681 N ASN A 541 91.654 83.882 79.505 1.00 0.00 N
ATOM 8682 CA ASN A 541 90.407 84.139 80.292 1.00 0.00 C
ATOM 8683 C ASN A 541 89.863 82.998 81.114 1.00 0.00 C
ATOM 8684 O ASN A 541 89.807 81.914 80.554 1.00 0.00 O
ATOM 8685 CB ASN A 541 89.245 84.508 79.377 1.00 0.00 C
ATOM 8686 CG ASN A 541 89.239 85.966 78.849 1.00 0.00 C
ATOM 8687 ND2 ASN A 541 88.087 86.513 78.530 1.00 0.00 N
ATOM 8688 OD1 ASN A 541 90.240 86.497 78.516 1.00 0.00 O
ATOM 8689 H ASN A 541 91.542 83.253 78.723 1.00 0.00 H
ATOM 8690 HA ASN A 541 90.684 85.029 80.857 1.00 0.00 H
ATOM 8691 HB2 ASN A 541 89.190 83.933 78.453 1.00 0.00 H
ATOM 8692 HB3 ASN A 541 88.281 84.385 79.871 1.00 0.00 H
ATOM 8693 HD21 ASN A 541 87.976 87.453 78.177 1.00 0.00 H
ATOM 8694 HD22 ASN A 541 87.305 86.035 78.953 1.00 0.00 H
ATOM 8695 N ILE A 542 89.454 83.245 82.352 1.00 0.00 N
ATOM 8696 CA ILE A 542 88.861 82.245 83.255 1.00 0.00 C
ATOM 8697 C ILE A 542 87.539 82.791 83.789 1.00 0.00 C
ATOM 8698 O ILE A 542 87.454 84.021 84.002 1.00 0.00 O
ATOM 8699 CB ILE A 542 89.891 81.725 84.329 1.00 0.00 C
ATOM 8700 CG1 ILE A 542 91.224 81.256 83.735 1.00 0.00 C
ATOM 8701 CG2 ILE A 542 89.165 80.656 85.148 1.00 0.00 C
ATOM 8702 CD1 ILE A 542 92.244 80.856 84.851 1.00 0.00 C
ATOM 8703 H ILE A 542 89.508 84.178 82.735 1.00 0.00 H
ATOM 8704 HA ILE A 542 88.600 81.389 82.633 1.00 0.00 H
ATOM 8705 HB ILE A 542 90.074 82.557 85.010 1.00 0.00 H
ATOM 8706 HG12 ILE A 542 91.032 80.369 83.133 1.00 0.00 H
ATOM 8707 HG13 ILE A 542 91.724 82.054 83.185 1.00 0.00 H
ATOM 8708 HG21 ILE A 542 88.304 81.104 85.644 1.00 0.00 H
ATOM 8709 HG22 ILE A 542 88.889 79.768 84.579 1.00 0.00 H
ATOM 8710 HG23 ILE A 542 89.844 80.392 85.959 1.00 0.00 H
ATOM 8711 HD11 ILE A 542 93.240 80.562 84.519 1.00 0.00 H
ATOM 8712 HD12 ILE A 542 92.374 81.631 85.606 1.00 0.00 H
ATOM 8713 HD13 ILE A 542 91.911 79.967 85.386 1.00 0.00 H
ATOM 8714 N GLU A 543 86.522 81.919 84.007 1.00 0.00 N
ATOM 8715 CA GLU A 543 85.251 82.213 84.693 1.00 0.00 C
ATOM 8716 C GLU A 543 84.961 80.980 85.568 1.00 0.00 C
ATOM 8717 O GLU A 543 84.764 79.856 85.088 1.00 0.00 O
ATOM 8718 CB GLU A 543 84.125 82.366 83.677 1.00 0.00 C
ATOM 8719 CG GLU A 543 84.358 83.514 82.679 1.00 0.00 C
ATOM 8720 CD GLU A 543 83.101 83.717 81.898 1.00 0.00 C
ATOM 8721 OE1 GLU A 543 81.993 83.880 82.477 1.00 0.00 O
ATOM 8722 OE2 GLU A 543 83.178 83.764 80.638 1.00 0.00 O1-
ATOM 8723 H GLU A 543 86.575 80.944 83.750 1.00 0.00 H
ATOM 8724 HA GLU A 543 85.306 83.151 85.247 1.00 0.00 H
ATOM 8725 HB2 GLU A 543 83.982 81.408 83.176 1.00 0.00 H
ATOM 8726 HB3 GLU A 543 83.156 82.518 84.153 1.00 0.00 H
ATOM 8727 HG2 GLU A 543 84.638 84.472 83.118 1.00 0.00 H
ATOM 8728 HG3 GLU A 543 85.127 83.190 81.979 1.00 0.00 H
ATOM 8729 N LEU A 544 84.832 81.162 86.882 1.00 0.00 N
ATOM 8730 CA LEU A 544 84.333 80.099 87.753 1.00 0.00 C
ATOM 8731 C LEU A 544 82.815 80.377 87.976 1.00 0.00 C
ATOM 8732 O LEU A 544 82.533 81.321 88.742 1.00 0.00 O
ATOM 8733 CB LEU A 544 85.165 80.138 89.056 1.00 0.00 C
ATOM 8734 CG LEU A 544 84.697 79.250 90.302 1.00 0.00 C
ATOM 8735 CD1 LEU A 544 84.383 77.824 89.849 1.00 0.00 C
ATOM 8736 CD2 LEU A 544 85.839 79.340 91.278 1.00 0.00 C
ATOM 8737 H LEU A 544 85.027 82.081 87.254 1.00 0.00 H
ATOM 8738 HA LEU A 544 84.490 79.070 87.431 1.00 0.00 H
ATOM 8739 HB2 LEU A 544 86.194 79.838 88.861 1.00 0.00 H
ATOM 8740 HB3 LEU A 544 85.142 81.151 89.457 1.00 0.00 H
ATOM 8741 HG LEU A 544 83.851 79.703 90.819 1.00 0.00 H
ATOM 8742 HD11 LEU A 544 84.927 77.528 88.952 1.00 0.00 H
ATOM 8743 HD12 LEU A 544 84.636 77.153 90.670 1.00 0.00 H
ATOM 8744 HD13 LEU A 544 83.333 77.603 89.660 1.00 0.00 H
ATOM 8745 HD21 LEU A 544 85.527 78.696 92.100 1.00 0.00 H
ATOM 8746 HD22 LEU A 544 86.643 78.795 90.783 1.00 0.00 H
ATOM 8747 HD23 LEU A 544 85.995 80.376 91.581 1.00 0.00 H
ATOM 8748 N ILE A 545 81.995 79.556 87.418 1.00 0.00 N
ATOM 8749 CA ILE A 545 80.514 79.571 87.529 1.00 0.00 C
ATOM 8750 C ILE A 545 80.150 78.773 88.716 1.00 0.00 C
ATOM 8751 O ILE A 545 80.648 77.658 88.984 1.00 0.00 O
ATOM 8752 CB ILE A 545 79.855 79.058 86.191 1.00 0.00 C
ATOM 8753 CG1 ILE A 545 80.166 79.912 84.895 1.00 0.00 C
ATOM 8754 CG2 ILE A 545 78.337 79.094 86.307 1.00 0.00 C
ATOM 8755 CD1 ILE A 545 79.993 78.978 83.727 1.00 0.00 C
ATOM 8756 H ILE A 545 82.445 78.828 86.883 1.00 0.00 H
ATOM 8757 HA ILE A 545 80.214 80.593 87.762 1.00 0.00 H
ATOM 8758 HB ILE A 545 80.287 78.074 86.009 1.00 0.00 H
ATOM 8759 HG12 ILE A 545 79.544 80.801 84.788 1.00 0.00 H
ATOM 8760 HG13 ILE A 545 81.210 80.221 84.946 1.00 0.00 H
ATOM 8761 HG21 ILE A 545 77.915 80.087 86.149 1.00 0.00 H
ATOM 8762 HG22 ILE A 545 77.851 78.427 85.595 1.00 0.00 H
ATOM 8763 HG23 ILE A 545 77.935 78.713 87.245 1.00 0.00 H
ATOM 8764 HD11 ILE A 545 78.943 78.687 83.756 1.00 0.00 H
ATOM 8765 HD12 ILE A 545 80.142 79.460 82.761 1.00 0.00 H
ATOM 8766 HD13 ILE A 545 80.697 78.146 83.737 1.00 0.00 H
ATOM 8767 N PRO A 546 79.283 79.389 89.646 1.00 0.00 N
ATOM 8768 CA PRO A 546 78.948 78.687 90.890 1.00 0.00 C
ATOM 8769 C PRO A 546 77.928 77.533 90.752 1.00 0.00 C
ATOM 8770 O PRO A 546 77.402 77.323 89.715 1.00 0.00 O
ATOM 8771 CB PRO A 546 78.489 79.827 91.812 1.00 0.00 C
ATOM 8772 CG PRO A 546 77.755 80.706 90.850 1.00 0.00 C
ATOM 8773 CD PRO A 546 78.653 80.661 89.617 1.00 0.00 C
ATOM 8774 HA PRO A 546 79.863 78.263 91.302 1.00 0.00 H
ATOM 8775 HB2 PRO A 546 77.696 79.568 92.513 1.00 0.00 H
ATOM 8776 HB3 PRO A 546 79.324 80.334 92.296 1.00 0.00 H
ATOM 8777 HG2 PRO A 546 76.785 80.236 90.693 1.00 0.00 H
ATOM 8778 HG3 PRO A 546 77.546 81.760 91.034 1.00 0.00 H
ATOM 8779 HD2 PRO A 546 78.037 80.731 88.720 1.00 0.00 H
ATOM 8780 HD3 PRO A 546 79.380 81.473 89.592 1.00 0.00 H
ATOM 8781 N SER A 547 77.739 76.800 91.840 1.00 0.00 N
ATOM 8782 CA SER A 547 76.575 75.903 92.077 1.00 0.00 C
ATOM 8783 C SER A 547 75.349 76.716 92.285 1.00 0.00 C
ATOM 8784 O SER A 547 75.448 77.798 92.930 1.00 0.00 O
ATOM 8785 CB SER A 547 76.950 75.027 93.300 1.00 0.00 C
ATOM 8786 OG SER A 547 75.920 74.075 93.450 1.00 0.00 O
ATOM 8787 H SER A 547 78.175 77.152 92.681 1.00 0.00 H
ATOM 8788 HA SER A 547 76.450 75.287 91.187 1.00 0.00 H
ATOM 8789 HB2 SER A 547 77.828 74.483 92.950 1.00 0.00 H
ATOM 8790 HB3 SER A 547 77.219 75.688 94.123 1.00 0.00 H
ATOM 8791 HG SER A 547 76.363 73.305 93.813 1.00 0.00 H
ATOM 8792 N ARG A 548 74.181 76.210 91.851 1.00 0.00 N
ATOM 8793 CA ARG A 548 72.856 76.791 91.933 1.00 0.00 C
ATOM 8794 C ARG A 548 71.808 75.767 92.011 1.00 0.00 C
ATOM 8795 O ARG A 548 71.778 74.772 91.281 1.00 0.00 O
ATOM 8796 CB ARG A 548 72.543 77.794 90.805 1.00 0.00 C
ATOM 8797 CG ARG A 548 72.278 77.248 89.385 1.00 0.00 C
ATOM 8798 CD ARG A 548 71.901 78.370 88.331 1.00 0.00 C
ATOM 8799 NE ARG A 548 71.158 77.864 87.187 1.00 0.00 N
ATOM 8800 CZ ARG A 548 70.499 78.651 86.351 1.00 0.00 C
ATOM 8801 NH1 ARG A 548 70.288 79.981 86.603 1.00 0.00 N1+
ATOM 8802 NH2 ARG A 548 69.988 78.171 85.258 1.00 0.00 N
ATOM 8803 H ARG A 548 74.267 75.270 91.491 1.00 0.00 H
ATOM 8804 HA ARG A 548 72.855 77.319 92.887 1.00 0.00 H
ATOM 8805 HB2 ARG A 548 71.689 78.424 91.053 1.00 0.00 H
ATOM 8806 HB3 ARG A 548 73.413 78.441 90.694 1.00 0.00 H
ATOM 8807 HG2 ARG A 548 73.193 76.765 89.041 1.00 0.00 H
ATOM 8808 HG3 ARG A 548 71.545 76.443 89.327 1.00 0.00 H
ATOM 8809 HD2 ARG A 548 71.199 79.081 88.768 1.00 0.00 H
ATOM 8810 HD3 ARG A 548 72.846 78.851 88.078 1.00 0.00 H
ATOM 8811 HE ARG A 548 71.370 76.902 86.965 1.00 0.00 H
ATOM 8812 HH11 ARG A 548 70.615 80.520 87.391 1.00 0.00 H
ATOM 8813 HH12 ARG A 548 69.636 80.521 86.052 1.00 0.00 H
ATOM 8814 HH21 ARG A 548 70.178 77.211 85.008 1.00 0.00 H
ATOM 8815 HH22 ARG A 548 69.291 78.705 84.759 1.00 0.00 H
ATOM 8816 N ARG A 549 70.808 76.154 92.815 1.00 0.00 N
ATOM 8817 CA ARG A 549 69.617 75.326 93.040 1.00 0.00 C
ATOM 8818 C ARG A 549 68.454 76.081 92.552 1.00 0.00 C
ATOM 8819 O ARG A 549 68.142 77.206 93.032 1.00 0.00 O
ATOM 8820 CB ARG A 549 69.659 74.774 94.482 1.00 0.00 C
ATOM 8821 CG ARG A 549 68.693 73.719 94.865 1.00 0.00 C
ATOM 8822 CD ARG A 549 69.143 73.142 96.248 1.00 0.00 C
ATOM 8823 NE ARG A 549 68.184 72.133 96.862 1.00 0.00 N
ATOM 8824 CZ ARG A 549 68.145 70.834 96.713 1.00 0.00 C
ATOM 8825 NH1 ARG A 549 69.166 70.158 96.308 1.00 0.00 N1+
ATOM 8826 NH2 ARG A 549 67.065 70.182 97.031 1.00 0.00 N
ATOM 8827 H ARG A 549 70.922 77.063 93.240 1.00 0.00 H
ATOM 8828 HA ARG A 549 69.792 74.409 92.476 1.00 0.00 H
ATOM 8829 HB2 ARG A 549 70.722 74.584 94.628 1.00 0.00 H
ATOM 8830 HB3 ARG A 549 69.550 75.586 95.201 1.00 0.00 H
ATOM 8831 HG2 ARG A 549 67.648 74.029 94.868 1.00 0.00 H
ATOM 8832 HG3 ARG A 549 68.686 72.880 94.169 1.00 0.00 H
ATOM 8833 HD2 ARG A 549 70.137 72.713 96.125 1.00 0.00 H
ATOM 8834 HD3 ARG A 549 69.205 74.023 96.887 1.00 0.00 H
ATOM 8835 HE ARG A 549 67.243 72.423 97.084 1.00 0.00 H
ATOM 8836 HH11 ARG A 549 70.059 70.557 96.056 1.00 0.00 H
ATOM 8837 HH12 ARG A 549 69.088 69.157 96.195 1.00 0.00 H
ATOM 8838 HH21 ARG A 549 66.179 70.645 97.175 1.00 0.00 H
ATOM 8839 HH22 ARG A 549 67.185 69.180 97.061 1.00 0.00 H
ATOM 8840 N VAL A 550 67.610 75.399 91.800 1.00 0.00 N
ATOM 8841 CA VAL A 550 66.695 76.120 90.845 1.00 0.00 C
ATOM 8842 C VAL A 550 65.339 75.450 90.943 1.00 0.00 C
ATOM 8843 O VAL A 550 65.349 74.211 90.612 1.00 0.00 O
ATOM 8844 CB VAL A 550 67.232 76.188 89.473 1.00 0.00 C
ATOM 8845 CG1 VAL A 550 66.219 76.785 88.472 1.00 0.00 C
ATOM 8846 CG2 VAL A 550 68.542 76.923 89.377 1.00 0.00 C
ATOM 8847 H VAL A 550 67.790 74.438 91.546 1.00 0.00 H
ATOM 8848 HA VAL A 550 66.656 77.180 91.093 1.00 0.00 H
ATOM 8849 HB VAL A 550 67.446 75.196 89.076 1.00 0.00 H
ATOM 8850 HG11 VAL A 550 65.920 77.774 88.821 1.00 0.00 H
ATOM 8851 HG12 VAL A 550 66.707 76.819 87.498 1.00 0.00 H
ATOM 8852 HG13 VAL A 550 65.341 76.139 88.469 1.00 0.00 H
ATOM 8853 HG21 VAL A 550 68.915 77.025 88.358 1.00 0.00 H
ATOM 8854 HG22 VAL A 550 68.496 77.964 89.699 1.00 0.00 H
ATOM 8855 HG23 VAL A 550 69.334 76.439 89.949 1.00 0.00 H
ATOM 8856 N PRO A 551 64.218 76.117 91.107 1.00 0.00 N
ATOM 8857 CA PRO A 551 62.866 75.527 91.138 1.00 0.00 C
ATOM 8858 C PRO A 551 62.521 74.701 89.870 1.00 0.00 C
ATOM 8859 O PRO A 551 62.784 75.106 88.772 1.00 0.00 O
ATOM 8860 CB PRO A 551 61.935 76.707 91.256 1.00 0.00 C
ATOM 8861 CG PRO A 551 62.704 77.753 92.022 1.00 0.00 C
ATOM 8862 CD PRO A 551 64.170 77.521 91.628 1.00 0.00 C
ATOM 8863 HA PRO A 551 62.715 74.958 92.055 1.00 0.00 H
ATOM 8864 HB2 PRO A 551 61.819 76.997 90.212 1.00 0.00 H
ATOM 8865 HB3 PRO A 551 61.018 76.405 91.761 1.00 0.00 H
ATOM 8866 HG2 PRO A 551 62.326 78.747 91.780 1.00 0.00 H
ATOM 8867 HG3 PRO A 551 62.536 77.436 93.052 1.00 0.00 H
ATOM 8868 HD2 PRO A 551 64.314 78.193 90.782 1.00 0.00 H
ATOM 8869 HD3 PRO A 551 64.860 77.768 92.434 1.00 0.00 H
ATOM 8870 N GLU A 552 61.839 73.575 89.957 1.00 0.00 N
ATOM 8871 CA GLU A 552 61.545 72.624 88.810 1.00 0.00 C
ATOM 8872 C GLU A 552 60.054 72.470 88.679 1.00 0.00 C
ATOM 8873 O GLU A 552 59.449 72.119 89.727 1.00 0.00 O
ATOM 8874 CB GLU A 552 62.442 71.328 88.972 1.00 0.00 C
ATOM 8875 CG GLU A 552 62.068 70.141 87.999 1.00 0.00 C
ATOM 8876 CD GLU A 552 62.346 70.341 86.518 1.00 0.00 C
ATOM 8877 OE1 GLU A 552 62.540 69.347 85.750 1.00 0.00 O
ATOM 8878 OE2 GLU A 552 62.227 71.469 86.016 1.00 0.00 O1-
ATOM 8879 H GLU A 552 61.499 73.439 90.899 1.00 0.00 H
ATOM 8880 HA GLU A 552 61.868 73.041 87.856 1.00 0.00 H
ATOM 8881 HB2 GLU A 552 63.494 71.566 88.809 1.00 0.00 H
ATOM 8882 HB3 GLU A 552 62.429 70.965 90.000 1.00 0.00 H
ATOM 8883 HG2 GLU A 552 62.736 69.391 88.422 1.00 0.00 H
ATOM 8884 HG3 GLU A 552 61.036 69.801 88.091 1.00 0.00 H
ATOM 8885 N VAL A 553 59.352 72.704 87.530 1.00 0.00 N
ATOM 8886 CA VAL A 553 58.033 72.113 87.322 1.00 0.00 C
ATOM 8887 C VAL A 553 58.144 70.931 86.321 1.00 0.00 C
ATOM 8888 O VAL A 553 58.791 71.023 85.267 1.00 0.00 O
ATOM 8889 CB VAL A 553 56.907 73.133 87.029 1.00 0.00 C
ATOM 8890 CG1 VAL A 553 55.625 72.421 86.588 1.00 0.00 C
ATOM 8891 CG2 VAL A 553 56.640 73.935 88.244 1.00 0.00 C
ATOM 8892 H VAL A 553 59.878 73.052 86.741 1.00 0.00 H
ATOM 8893 HA VAL A 553 57.696 71.672 88.260 1.00 0.00 H
ATOM 8894 HB VAL A 553 57.311 73.754 86.230 1.00 0.00 H
ATOM 8895 HG11 VAL A 553 55.526 72.202 85.524 1.00 0.00 H
ATOM 8896 HG12 VAL A 553 55.568 71.470 87.119 1.00 0.00 H
ATOM 8897 HG13 VAL A 553 54.704 72.968 86.788 1.00 0.00 H
ATOM 8898 HG21 VAL A 553 56.325 73.191 88.976 1.00 0.00 H
ATOM 8899 HG22 VAL A 553 57.592 74.389 88.517 1.00 0.00 H
ATOM 8900 HG23 VAL A 553 55.867 74.654 87.971 1.00 0.00 H
ATOM 8901 N ASN A 554 57.697 69.708 86.721 1.00 0.00 N
ATOM 8902 CA ASN A 554 57.757 68.514 85.850 1.00 0.00 C
ATOM 8903 C ASN A 554 56.518 68.447 84.936 1.00 0.00 C
ATOM 8904 O ASN A 554 55.530 69.139 85.167 1.00 0.00 O
ATOM 8905 CB ASN A 554 58.172 67.270 86.662 1.00 0.00 C
ATOM 8906 CG ASN A 554 57.875 65.968 85.979 1.00 0.00 C
ATOM 8907 ND2 ASN A 554 58.631 65.720 84.961 1.00 0.00 N
ATOM 8908 OD1 ASN A 554 56.878 65.302 86.205 1.00 0.00 O
ATOM 8909 H ASN A 554 57.178 69.637 87.584 1.00 0.00 H
ATOM 8910 HA ASN A 554 58.640 68.631 85.222 1.00 0.00 H
ATOM 8911 HB2 ASN A 554 59.246 67.382 86.812 1.00 0.00 H
ATOM 8912 HB3 ASN A 554 57.638 67.195 87.609 1.00 0.00 H
ATOM 8913 HD21 ASN A 554 58.512 64.763 84.661 1.00 0.00 H
ATOM 8914 HD22 ASN A 554 59.543 66.149 85.030 1.00 0.00 H
ATOM 8915 N GLN A 555 56.626 67.632 83.856 1.00 0.00 N
ATOM 8916 CA GLN A 555 55.655 67.561 82.800 1.00 0.00 C
ATOM 8917 C GLN A 555 54.175 67.372 83.253 1.00 0.00 C
ATOM 8918 O GLN A 555 53.233 67.895 82.685 1.00 0.00 O
ATOM 8919 CB GLN A 555 56.182 66.404 81.828 1.00 0.00 C
ATOM 8920 CG GLN A 555 55.058 65.916 80.908 1.00 0.00 C
ATOM 8921 CD GLN A 555 55.566 64.882 79.817 1.00 0.00 C
ATOM 8922 NE2 GLN A 555 56.139 65.322 78.771 1.00 0.00 N
ATOM 8923 OE1 GLN A 555 55.408 63.703 79.856 1.00 0.00 O
ATOM 8924 H GLN A 555 57.520 67.169 83.773 1.00 0.00 H
ATOM 8925 HA GLN A 555 55.712 68.560 82.368 1.00 0.00 H
ATOM 8926 HB2 GLN A 555 57.089 66.732 81.319 1.00 0.00 H
ATOM 8927 HB3 GLN A 555 56.573 65.604 82.456 1.00 0.00 H
ATOM 8928 HG2 GLN A 555 54.222 65.499 81.469 1.00 0.00 H
ATOM 8929 HG3 GLN A 555 54.558 66.628 80.251 1.00 0.00 H
ATOM 8930 HE21 GLN A 555 56.604 64.704 78.121 1.00 0.00 H
ATOM 8931 HE22 GLN A 555 56.173 66.306 78.548 1.00 0.00 H
ATOM 8932 N GLN A 556 53.992 66.530 84.303 1.00 0.00 N
ATOM 8933 CA GLN A 556 52.639 66.238 84.896 1.00 0.00 C
ATOM 8934 C GLN A 556 52.078 67.370 85.807 1.00 0.00 C
ATOM 8935 O GLN A 556 51.019 67.275 86.395 1.00 0.00 O
ATOM 8936 CB GLN A 556 52.649 64.854 85.669 1.00 0.00 C
ATOM 8937 CG GLN A 556 52.872 63.713 84.666 1.00 0.00 C
ATOM 8938 CD GLN A 556 53.002 62.339 85.341 1.00 0.00 C
ATOM 8939 NE2 GLN A 556 54.178 61.905 85.607 1.00 0.00 N
ATOM 8940 OE1 GLN A 556 52.065 61.629 85.642 1.00 0.00 O
ATOM 8941 H GLN A 556 54.813 66.043 84.634 1.00 0.00 H
ATOM 8942 HA GLN A 556 51.919 66.239 84.077 1.00 0.00 H
ATOM 8943 HB2 GLN A 556 53.540 64.838 86.297 1.00 0.00 H
ATOM 8944 HB3 GLN A 556 51.743 64.610 86.223 1.00 0.00 H
ATOM 8945 HG2 GLN A 556 52.016 63.764 83.992 1.00 0.00 H
ATOM 8946 HG3 GLN A 556 53.793 63.935 84.126 1.00 0.00 H
ATOM 8947 HE21 GLN A 556 54.294 60.970 85.970 1.00 0.00 H
ATOM 8948 HE22 GLN A 556 55.022 62.365 85.295 1.00 0.00 H
ATOM 8949 N GLY A 557 52.769 68.471 85.950 1.00 0.00 N
ATOM 8950 CA GLY A 557 52.335 69.563 86.862 1.00 0.00 C
ATOM 8951 C GLY A 557 52.906 69.392 88.303 1.00 0.00 C
ATOM 8952 O GLY A 557 52.498 70.103 89.192 1.00 0.00 O
ATOM 8953 H GLY A 557 53.642 68.658 85.477 1.00 0.00 H
ATOM 8954 HA2 GLY A 557 52.813 70.490 86.545 1.00 0.00 H
ATOM 8955 HA3 GLY A 557 51.257 69.670 86.981 1.00 0.00 H
ATOM 8956 N GLU A 558 53.858 68.516 88.508 1.00 0.00 N
ATOM 8957 CA GLU A 558 54.482 68.253 89.871 1.00 0.00 C
ATOM 8958 C GLU A 558 55.519 69.324 90.216 1.00 0.00 C
ATOM 8959 O GLU A 558 56.319 69.709 89.352 1.00 0.00 O
ATOM 8960 CB GLU A 558 55.213 66.889 89.742 1.00 0.00 C
ATOM 8961 CG GLU A 558 55.589 66.216 91.141 1.00 0.00 C
ATOM 8962 CD GLU A 558 56.280 64.858 90.847 1.00 0.00 C
ATOM 8963 OE1 GLU A 558 57.245 64.510 91.528 1.00 0.00 O
ATOM 8964 OE2 GLU A 558 55.766 64.120 89.938 1.00 0.00 O1-
ATOM 8965 H GLU A 558 54.254 68.163 87.648 1.00 0.00 H
ATOM 8966 HA GLU A 558 53.650 68.254 90.575 1.00 0.00 H
ATOM 8967 HB2 GLU A 558 54.458 66.254 89.279 1.00 0.00 H
ATOM 8968 HB3 GLU A 558 56.050 66.876 89.044 1.00 0.00 H
ATOM 8969 HG2 GLU A 558 56.167 66.906 91.757 1.00 0.00 H
ATOM 8970 HG3 GLU A 558 54.616 65.899 91.516 1.00 0.00 H
ATOM 8971 N ILE A 559 55.665 69.695 91.531 1.00 0.00 N
ATOM 8972 CA ILE A 559 56.659 70.646 92.020 1.00 0.00 C
ATOM 8973 C ILE A 559 57.959 69.980 92.557 1.00 0.00 C
ATOM 8974 O ILE A 559 57.916 69.153 93.453 1.00 0.00 O
ATOM 8975 CB ILE A 559 56.089 71.651 93.110 1.00 0.00 C
ATOM 8976 CG1 ILE A 559 54.752 72.257 92.781 1.00 0.00 C
ATOM 8977 CG2 ILE A 559 57.102 72.779 93.429 1.00 0.00 C
ATOM 8978 CD1 ILE A 559 54.765 72.976 91.445 1.00 0.00 C
ATOM 8979 H ILE A 559 55.003 69.444 92.250 1.00 0.00 H
ATOM 8980 HA ILE A 559 56.851 71.305 91.173 1.00 0.00 H
ATOM 8981 HB ILE A 559 55.978 71.010 93.985 1.00 0.00 H
ATOM 8982 HG12 ILE A 559 53.980 71.519 92.568 1.00 0.00 H
ATOM 8983 HG13 ILE A 559 54.405 72.883 93.603 1.00 0.00 H
ATOM 8984 HG21 ILE A 559 56.683 73.441 94.187 1.00 0.00 H
ATOM 8985 HG22 ILE A 559 58.029 72.333 93.791 1.00 0.00 H
ATOM 8986 HG23 ILE A 559 57.420 73.270 92.509 1.00 0.00 H
ATOM 8987 HD11 ILE A 559 53.745 73.171 91.113 1.00 0.00 H
ATOM 8988 HD12 ILE A 559 55.274 73.930 91.582 1.00 0.00 H
ATOM 8989 HD13 ILE A 559 55.188 72.444 90.593 1.00 0.00 H
ATOM 8990 N ARG A 560 59.110 70.409 92.024 1.00 0.00 N
ATOM 8991 CA ARG A 560 60.481 69.930 92.454 1.00 0.00 C
ATOM 8992 C ARG A 560 61.429 71.096 92.580 1.00 0.00 C
ATOM 8993 O ARG A 560 61.056 72.303 92.626 1.00 0.00 O
ATOM 8994 CB ARG A 560 61.003 68.757 91.528 1.00 0.00 C
ATOM 8995 CG ARG A 560 59.882 67.720 91.231 1.00 0.00 C
ATOM 8996 CD ARG A 560 60.575 66.583 90.514 1.00 0.00 C
ATOM 8997 NE ARG A 560 59.687 65.431 90.321 1.00 0.00 N
ATOM 8998 CZ ARG A 560 59.594 64.601 89.306 1.00 0.00 C
ATOM 8999 NH1 ARG A 560 60.409 64.744 88.295 1.00 0.00 N1+
ATOM 9000 NH2 ARG A 560 58.663 63.724 89.186 1.00 0.00 N
ATOM 9001 H ARG A 560 59.018 71.123 91.316 1.00 0.00 H
ATOM 9002 HA ARG A 560 60.383 69.471 93.438 1.00 0.00 H
ATOM 9003 HB2 ARG A 560 61.212 69.168 90.541 1.00 0.00 H
ATOM 9004 HB3 ARG A 560 61.967 68.366 91.855 1.00 0.00 H
ATOM 9005 HG2 ARG A 560 59.394 67.367 92.139 1.00 0.00 H
ATOM 9006 HG3 ARG A 560 59.090 68.075 90.572 1.00 0.00 H
ATOM 9007 HD2 ARG A 560 61.123 66.894 89.625 1.00 0.00 H
ATOM 9008 HD3 ARG A 560 61.257 66.251 91.298 1.00 0.00 H
ATOM 9009 HE ARG A 560 59.081 65.089 91.053 1.00 0.00 H
ATOM 9010 HH11 ARG A 560 61.212 65.342 88.423 1.00 0.00 H
ATOM 9011 HH12 ARG A 560 60.343 64.077 87.538 1.00 0.00 H
ATOM 9012 HH21 ARG A 560 57.837 63.860 89.750 1.00 0.00 H
ATOM 9013 HH22 ARG A 560 58.634 63.197 88.325 1.00 0.00 H
ATOM 9014 N GLU A 561 62.773 70.746 92.594 1.00 0.00 N
ATOM 9015 CA GLU A 561 63.928 71.699 92.298 1.00 0.00 C
ATOM 9016 C GLU A 561 65.167 70.931 91.947 1.00 0.00 C
ATOM 9017 O GLU A 561 65.257 69.697 92.186 1.00 0.00 O
ATOM 9018 CB GLU A 561 64.225 72.627 93.539 1.00 0.00 C
ATOM 9019 CG GLU A 561 64.651 71.996 94.828 1.00 0.00 C
ATOM 9020 CD GLU A 561 64.910 72.987 95.929 1.00 0.00 C
ATOM 9021 OE1 GLU A 561 64.698 74.214 95.825 1.00 0.00 O
ATOM 9022 OE2 GLU A 561 65.343 72.481 96.990 1.00 0.00 O1-
ATOM 9023 H GLU A 561 62.916 69.758 92.742 1.00 0.00 H
ATOM 9024 HA GLU A 561 63.644 72.385 91.499 1.00 0.00 H
ATOM 9025 HB2 GLU A 561 65.115 73.209 93.297 1.00 0.00 H
ATOM 9026 HB3 GLU A 561 63.379 73.264 93.795 1.00 0.00 H
ATOM 9027 HG2 GLU A 561 63.829 71.398 95.222 1.00 0.00 H
ATOM 9028 HG3 GLU A 561 65.485 71.298 94.758 1.00 0.00 H
ATOM 9029 N MET A 562 66.115 71.569 91.328 1.00 0.00 N
ATOM 9030 CA MET A 562 67.311 70.926 90.679 1.00 0.00 C
ATOM 9031 C MET A 562 68.587 71.535 91.097 1.00 0.00 C
ATOM 9032 O MET A 562 68.621 72.759 91.212 1.00 0.00 O
ATOM 9033 CB MET A 562 67.096 70.841 89.193 1.00 0.00 C
ATOM 9034 CG MET A 562 66.070 69.756 88.970 1.00 0.00 C
ATOM 9035 SD MET A 562 65.786 69.281 87.297 1.00 0.00 S
ATOM 9036 CE MET A 562 67.377 68.511 86.805 1.00 0.00 C
ATOM 9037 H MET A 562 65.869 72.459 90.918 1.00 0.00 H
ATOM 9038 HA MET A 562 67.312 69.890 91.019 1.00 0.00 H
ATOM 9039 HB2 MET A 562 66.708 71.818 88.904 1.00 0.00 H
ATOM 9040 HB3 MET A 562 68.035 70.576 88.707 1.00 0.00 H
ATOM 9041 HG2 MET A 562 66.378 68.850 89.493 1.00 0.00 H
ATOM 9042 HG3 MET A 562 65.080 70.025 89.338 1.00 0.00 H
ATOM 9043 HE1 MET A 562 67.528 67.722 87.541 1.00 0.00 H
ATOM 9044 HE2 MET A 562 67.395 68.017 85.833 1.00 0.00 H
ATOM 9045 HE3 MET A 562 68.194 69.232 86.836 1.00 0.00 H
ATOM 9046 N GLU A 563 69.659 70.795 91.157 1.00 0.00 N
ATOM 9047 CA GLU A 563 71.012 71.457 91.439 1.00 0.00 C
ATOM 9048 C GLU A 563 72.083 70.600 90.802 1.00 0.00 C
ATOM 9049 O GLU A 563 72.113 69.378 90.930 1.00 0.00 O
ATOM 9050 CB GLU A 563 71.225 71.652 92.901 1.00 0.00 C
ATOM 9051 CG GLU A 563 72.649 71.977 93.373 1.00 0.00 C
ATOM 9052 CD GLU A 563 72.673 71.964 94.874 1.00 0.00 C
ATOM 9053 OE1 GLU A 563 72.219 70.991 95.471 1.00 0.00 O
ATOM 9054 OE2 GLU A 563 73.204 72.872 95.507 1.00 0.00 O1-
ATOM 9055 H GLU A 563 69.554 69.819 90.919 1.00 0.00 H
ATOM 9056 HA GLU A 563 71.033 72.460 91.014 1.00 0.00 H
ATOM 9057 HB2 GLU A 563 70.516 72.368 93.316 1.00 0.00 H
ATOM 9058 HB3 GLU A 563 71.091 70.680 93.376 1.00 0.00 H
ATOM 9059 HG2 GLU A 563 73.359 71.168 93.200 1.00 0.00 H
ATOM 9060 HG3 GLU A 563 72.996 72.938 92.995 1.00 0.00 H
ATOM 9061 N HIE A 564 73.099 71.314 90.301 1.00 0.00 N
ATOM 9062 CA HIE A 564 74.301 70.831 89.749 1.00 0.00 C
ATOM 9063 C HIE A 564 75.553 71.582 90.261 1.00 0.00 C
ATOM 9064 O HIE A 564 75.482 72.802 90.437 1.00 0.00 O
ATOM 9065 CB HIE A 564 74.185 70.850 88.188 1.00 0.00 C
ATOM 9066 CG HIE A 564 73.084 70.023 87.714 1.00 0.00 C
ATOM 9067 CD2 HIE A 564 71.947 70.482 87.075 1.00 0.00 C
ATOM 9068 ND1 HIE A 564 73.148 68.678 87.613 1.00 0.00 N
ATOM 9069 CE1 HIE A 564 71.995 68.318 86.978 1.00 0.00 C
ATOM 9070 NE2 HIE A 564 71.265 69.373 86.616 1.00 0.00 N
ATOM 9071 H HIE A 564 72.988 72.315 90.375 1.00 0.00 H
ATOM 9072 HA HIE A 564 74.296 69.788 90.066 1.00 0.00 H
ATOM 9073 HB2 HIE A 564 74.061 71.884 87.866 1.00 0.00 H
ATOM 9074 HB3 HIE A 564 75.121 70.445 87.802 1.00 0.00 H
ATOM 9075 HD2 HIE A 564 71.689 71.518 86.909 1.00 0.00 H
ATOM 9076 HE1 HIE A 564 71.750 67.309 86.679 1.00 0.00 H
ATOM 9077 HE2 HIE A 564 70.360 69.342 86.168 1.00 0.00 H
ATOM 9078 N PRO A 565 76.807 71.005 90.420 1.00 0.00 N
ATOM 9079 CA PRO A 565 77.908 71.666 91.100 1.00 0.00 C
ATOM 9080 C PRO A 565 78.550 72.860 90.375 1.00 0.00 C
ATOM 9081 O PRO A 565 78.493 73.116 89.161 1.00 0.00 O
ATOM 9082 CB PRO A 565 78.982 70.572 91.380 1.00 0.00 C
ATOM 9083 CG PRO A 565 78.305 69.205 91.169 1.00 0.00 C
ATOM 9084 CD PRO A 565 77.161 69.542 90.147 1.00 0.00 C
ATOM 9085 HA PRO A 565 77.503 72.016 92.050 1.00 0.00 H
ATOM 9086 HB2 PRO A 565 79.899 70.680 90.801 1.00 0.00 H
ATOM 9087 HB3 PRO A 565 79.327 70.638 92.412 1.00 0.00 H
ATOM 9088 HG2 PRO A 565 78.865 68.348 90.793 1.00 0.00 H
ATOM 9089 HG3 PRO A 565 77.825 68.945 92.113 1.00 0.00 H
ATOM 9090 HD2 PRO A 565 77.564 69.579 89.136 1.00 0.00 H
ATOM 9091 HD3 PRO A 565 76.301 68.900 90.339 1.00 0.00 H
ATOM 9092 N ALA A 566 79.266 73.717 91.081 1.00 0.00 N
ATOM 9093 CA ALA A 566 80.149 74.798 90.590 1.00 0.00 C
ATOM 9094 C ALA A 566 81.209 74.181 89.518 1.00 0.00 C
ATOM 9095 O ALA A 566 81.641 72.969 89.610 1.00 0.00 O
ATOM 9096 CB ALA A 566 81.022 75.324 91.792 1.00 0.00 C
ATOM 9097 H ALA A 566 79.489 73.429 92.023 1.00 0.00 H
ATOM 9098 HA ALA A 566 79.654 75.562 89.990 1.00 0.00 H
ATOM 9099 HB1 ALA A 566 81.786 76.004 91.416 1.00 0.00 H
ATOM 9100 HB2 ALA A 566 80.327 75.941 92.362 1.00 0.00 H
ATOM 9101 HB3 ALA A 566 81.472 74.538 92.400 1.00 0.00 H
ATOM 9102 N HIE A 567 81.452 74.983 88.524 1.00 0.00 N
ATOM 9103 CA HIE A 567 82.101 74.539 87.350 1.00 0.00 C
ATOM 9104 C HIE A 567 82.836 75.679 86.678 1.00 0.00 C
ATOM 9105 O HIE A 567 82.350 76.764 86.394 1.00 0.00 O
ATOM 9106 CB HIE A 567 81.087 73.846 86.421 1.00 0.00 C
ATOM 9107 CG HIE A 567 79.773 74.466 86.060 1.00 0.00 C
ATOM 9108 CD2 HIE A 567 79.092 75.407 86.764 1.00 0.00 C
ATOM 9109 ND1 HIE A 567 79.004 74.112 84.989 1.00 0.00 N
ATOM 9110 CE1 HIE A 567 77.782 74.568 85.227 1.00 0.00 C
ATOM 9111 NE2 HIE A 567 77.849 75.476 86.211 1.00 0.00 N
ATOM 9112 H HIE A 567 81.099 75.929 88.536 1.00 0.00 H
ATOM 9113 HA HIE A 567 82.864 73.800 87.596 1.00 0.00 H
ATOM 9114 HB2 HIE A 567 81.640 73.715 85.491 1.00 0.00 H
ATOM 9115 HB3 HIE A 567 80.869 72.841 86.785 1.00 0.00 H
ATOM 9116 HD2 HIE A 567 79.338 75.843 87.721 1.00 0.00 H
ATOM 9117 HE1 HIE A 567 76.887 74.357 84.661 1.00 0.00 H
ATOM 9118 HE2 HIE A 567 77.077 76.049 86.523 1.00 0.00 H
ATOM 9119 N ILE A 568 84.128 75.406 86.441 1.00 0.00 N
ATOM 9120 CA ILE A 568 85.073 76.255 85.793 1.00 0.00 C
ATOM 9121 C ILE A 568 84.980 76.301 84.255 1.00 0.00 C
ATOM 9122 O ILE A 568 84.924 75.278 83.557 1.00 0.00 O
ATOM 9123 CB ILE A 568 86.508 75.727 86.026 1.00 0.00 C
ATOM 9124 CG1 ILE A 568 86.963 75.668 87.535 1.00 0.00 C
ATOM 9125 CG2 ILE A 568 87.410 76.845 85.435 1.00 0.00 C
ATOM 9126 CD1 ILE A 568 87.877 74.467 87.860 1.00 0.00 C
ATOM 9127 H ILE A 568 84.474 74.483 86.665 1.00 0.00 H
ATOM 9128 HA ILE A 568 84.845 77.221 86.244 1.00 0.00 H
ATOM 9129 HB ILE A 568 86.722 74.721 85.667 1.00 0.00 H
ATOM 9130 HG12 ILE A 568 87.369 76.616 87.887 1.00 0.00 H
ATOM 9131 HG13 ILE A 568 86.050 75.584 88.125 1.00 0.00 H
ATOM 9132 HG21 ILE A 568 87.544 76.799 84.354 1.00 0.00 H
ATOM 9133 HG22 ILE A 568 87.095 77.837 85.761 1.00 0.00 H
ATOM 9134 HG23 ILE A 568 88.407 76.682 85.843 1.00 0.00 H
ATOM 9135 HD11 ILE A 568 88.099 74.342 88.920 1.00 0.00 H
ATOM 9136 HD12 ILE A 568 87.508 73.491 87.544 1.00 0.00 H
ATOM 9137 HD13 ILE A 568 88.860 74.663 87.432 1.00 0.00 H
ATOM 9138 N LEU A 569 85.029 77.469 83.668 1.00 0.00 N
ATOM 9139 CA LEU A 569 85.351 77.816 82.315 1.00 0.00 C
ATOM 9140 C LEU A 569 86.671 78.518 82.016 1.00 0.00 C
ATOM 9141 O LEU A 569 86.928 79.542 82.611 1.00 0.00 O
ATOM 9142 CB LEU A 569 84.146 78.562 81.666 1.00 0.00 C
ATOM 9143 CG LEU A 569 84.218 78.950 80.199 1.00 0.00 C
ATOM 9144 CD1 LEU A 569 83.883 77.828 79.155 1.00 0.00 C
ATOM 9145 CD2 LEU A 569 83.291 80.156 79.940 1.00 0.00 C
ATOM 9146 H LEU A 569 85.021 78.291 84.254 1.00 0.00 H
ATOM 9147 HA LEU A 569 85.380 76.892 81.737 1.00 0.00 H
ATOM 9148 HB2 LEU A 569 83.286 77.894 81.704 1.00 0.00 H
ATOM 9149 HB3 LEU A 569 84.008 79.468 82.257 1.00 0.00 H
ATOM 9150 HG LEU A 569 85.181 79.402 79.963 1.00 0.00 H
ATOM 9151 HD11 LEU A 569 83.863 78.234 78.144 1.00 0.00 H
ATOM 9152 HD12 LEU A 569 84.690 77.095 79.181 1.00 0.00 H
ATOM 9153 HD13 LEU A 569 82.966 77.262 79.320 1.00 0.00 H
ATOM 9154 HD21 LEU A 569 83.602 81.018 80.531 1.00 0.00 H
ATOM 9155 HD22 LEU A 569 83.328 80.390 78.876 1.00 0.00 H
ATOM 9156 HD23 LEU A 569 82.279 79.810 80.150 1.00 0.00 H
ATOM 9157 N ALA A 570 87.435 78.123 81.002 1.00 0.00 N
ATOM 9158 CA ALA A 570 88.587 78.863 80.556 1.00 0.00 C
ATOM 9159 C ALA A 570 88.762 78.930 79.020 1.00 0.00 C
ATOM 9160 O ALA A 570 88.330 78.035 78.260 1.00 0.00 O
ATOM 9161 CB ALA A 570 89.928 78.430 81.288 1.00 0.00 C
ATOM 9162 H ALA A 570 87.254 77.206 80.622 1.00 0.00 H
ATOM 9163 HA ALA A 570 88.478 79.893 80.895 1.00 0.00 H
ATOM 9164 HB1 ALA A 570 89.799 78.443 82.370 1.00 0.00 H
ATOM 9165 HB2 ALA A 570 90.116 77.384 81.045 1.00 0.00 H
ATOM 9166 HB3 ALA A 570 90.771 79.104 81.132 1.00 0.00 H
ATOM 9167 N TYR A 571 89.519 79.923 78.591 1.00 0.00 N
ATOM 9168 CA TYR A 571 89.743 80.131 77.119 1.00 0.00 C
ATOM 9169 C TYR A 571 90.679 81.300 76.716 1.00 0.00 C
ATOM 9170 O TYR A 571 90.772 82.343 77.369 1.00 0.00 O
ATOM 9171 CB TYR A 571 88.320 80.391 76.486 1.00 0.00 C
ATOM 9172 CG TYR A 571 87.556 81.630 76.995 1.00 0.00 C
ATOM 9173 CD1 TYR A 571 86.695 81.535 78.138 1.00 0.00 C
ATOM 9174 CD2 TYR A 571 87.511 82.797 76.200 1.00 0.00 C
ATOM 9175 CE1 TYR A 571 85.978 82.682 78.611 1.00 0.00 C
ATOM 9176 CE2 TYR A 571 86.750 83.926 76.721 1.00 0.00 C
ATOM 9177 CZ TYR A 571 85.954 83.834 77.882 1.00 0.00 C
ATOM 9178 OH TYR A 571 85.207 84.848 78.394 1.00 0.00 O
ATOM 9179 H TYR A 571 89.822 80.637 79.238 1.00 0.00 H
ATOM 9180 HA TYR A 571 90.108 79.222 76.641 1.00 0.00 H
ATOM 9181 HB2 TYR A 571 88.498 80.646 75.441 1.00 0.00 H
ATOM 9182 HB3 TYR A 571 87.729 79.476 76.492 1.00 0.00 H
ATOM 9183 HD1 TYR A 571 86.683 80.590 78.660 1.00 0.00 H
ATOM 9184 HD2 TYR A 571 88.087 82.963 75.302 1.00 0.00 H
ATOM 9185 HE1 TYR A 571 85.495 82.566 79.570 1.00 0.00 H
ATOM 9186 HE2 TYR A 571 86.695 84.839 76.147 1.00 0.00 H
ATOM 9187 HH TYR A 571 84.618 84.744 79.145 1.00 0.00 H
ATOM 9188 N TYR A 572 91.346 81.089 75.626 1.00 0.00 N
ATOM 9189 CA TYR A 572 92.165 82.020 74.932 1.00 0.00 C
ATOM 9190 C TYR A 572 91.320 83.194 74.419 1.00 0.00 C
ATOM 9191 O TYR A 572 90.397 82.850 73.650 1.00 0.00 O
ATOM 9192 CB TYR A 572 93.060 81.409 73.839 1.00 0.00 C
ATOM 9193 CG TYR A 572 94.141 82.338 73.220 1.00 0.00 C
ATOM 9194 CD1 TYR A 572 93.989 82.780 71.860 1.00 0.00 C
ATOM 9195 CD2 TYR A 572 95.191 82.790 73.979 1.00 0.00 C
ATOM 9196 CE1 TYR A 572 94.922 83.701 71.228 1.00 0.00 C
ATOM 9197 CE2 TYR A 572 96.183 83.589 73.336 1.00 0.00 C
ATOM 9198 CZ TYR A 572 95.934 84.216 72.065 1.00 0.00 C
ATOM 9199 OH TYR A 572 96.826 85.029 71.539 1.00 0.00 O
ATOM 9200 H TYR A 572 91.109 80.338 74.993 1.00 0.00 H
ATOM 9201 HA TYR A 572 92.808 82.440 75.705 1.00 0.00 H
ATOM 9202 HB2 TYR A 572 93.429 80.422 74.118 1.00 0.00 H
ATOM 9203 HB3 TYR A 572 92.383 81.261 72.999 1.00 0.00 H
ATOM 9204 HD1 TYR A 572 93.139 82.455 71.277 1.00 0.00 H
ATOM 9205 HD2 TYR A 572 95.262 82.535 75.026 1.00 0.00 H
ATOM 9206 HE1 TYR A 572 94.927 84.029 70.198 1.00 0.00 H
ATOM 9207 HE2 TYR A 572 97.019 84.000 73.883 1.00 0.00 H
ATOM 9208 HH TYR A 572 96.472 85.309 70.692 1.00 0.00 H
ATOM 9209 N SER A 573 91.590 84.447 74.585 1.00 0.00 N
ATOM 9210 CA SER A 573 90.748 85.507 74.009 1.00 0.00 C
ATOM 9211 C SER A 573 91.480 86.781 73.671 1.00 0.00 C
ATOM 9212 O SER A 573 92.286 87.289 74.399 1.00 0.00 O
ATOM 9213 CB SER A 573 89.728 85.807 75.053 1.00 0.00 C
ATOM 9214 OG SER A 573 89.043 86.952 74.669 1.00 0.00 O
ATOM 9215 H SER A 573 92.468 84.627 75.050 1.00 0.00 H
ATOM 9216 HA SER A 573 90.297 85.198 73.067 1.00 0.00 H
ATOM 9217 HB2 SER A 573 89.024 84.977 75.106 1.00 0.00 H
ATOM 9218 HB3 SER A 573 90.149 85.934 76.051 1.00 0.00 H
ATOM 9219 HG SER A 573 88.153 86.778 74.984 1.00 0.00 H
ATOM 9220 N LEU A 574 91.298 87.318 72.468 1.00 0.00 N
ATOM 9221 CA LEU A 574 91.755 88.623 72.026 1.00 0.00 C
ATOM 9222 C LEU A 574 90.961 89.802 72.556 1.00 0.00 C
ATOM 9223 O LEU A 574 91.307 90.941 72.144 1.00 0.00 O
ATOM 9224 CB LEU A 574 91.837 88.700 70.422 1.00 0.00 C
ATOM 9225 CG LEU A 574 92.416 87.487 69.700 1.00 0.00 C
ATOM 9226 CD1 LEU A 574 92.257 87.651 68.177 1.00 0.00 C
ATOM 9227 CD2 LEU A 574 93.907 87.322 70.117 1.00 0.00 C
ATOM 9228 H LEU A 574 90.625 86.914 71.832 1.00 0.00 H
ATOM 9229 HA LEU A 574 92.758 88.803 72.413 1.00 0.00 H
ATOM 9230 HB2 LEU A 574 90.824 88.893 70.071 1.00 0.00 H
ATOM 9231 HB3 LEU A 574 92.507 89.532 70.204 1.00 0.00 H
ATOM 9232 HG LEU A 574 91.903 86.578 70.013 1.00 0.00 H
ATOM 9233 HD11 LEU A 574 92.845 86.853 67.725 1.00 0.00 H
ATOM 9234 HD12 LEU A 574 91.275 87.566 67.711 1.00 0.00 H
ATOM 9235 HD13 LEU A 574 92.518 88.662 67.863 1.00 0.00 H
ATOM 9236 HD21 LEU A 574 94.515 88.171 69.807 1.00 0.00 H
ATOM 9237 HD22 LEU A 574 93.868 87.162 71.195 1.00 0.00 H
ATOM 9238 HD23 LEU A 574 94.187 86.477 69.488 1.00 0.00 H
ATOM 9239 N ALA A 575 89.871 89.610 73.268 1.00 0.00 N
ATOM 9240 CA ALA A 575 89.043 90.646 73.807 1.00 0.00 C
ATOM 9241 C ALA A 575 89.393 91.156 75.245 1.00 0.00 C
ATOM 9242 O ALA A 575 88.793 92.149 75.716 1.00 0.00 O
ATOM 9243 CB ALA A 575 87.597 90.044 73.922 1.00 0.00 C
ATOM 9244 H ALA A 575 89.640 88.718 73.681 1.00 0.00 H
ATOM 9245 HA ALA A 575 89.047 91.490 73.117 1.00 0.00 H
ATOM 9246 HB1 ALA A 575 87.672 89.157 74.550 1.00 0.00 H
ATOM 9247 HB2 ALA A 575 86.963 90.727 74.487 1.00 0.00 H
ATOM 9248 HB3 ALA A 575 87.230 89.715 72.950 1.00 0.00 H
ATOM 9249 N GLY A 576 90.515 90.667 75.799 1.00 0.00 N
ATOM 9250 CA GLY A 576 90.809 90.793 77.212 1.00 0.00 C
ATOM 9251 C GLY A 576 89.741 90.124 78.098 1.00 0.00 C
ATOM 9252 O GLY A 576 88.791 89.444 77.682 1.00 0.00 O
ATOM 9253 H GLY A 576 91.137 90.070 75.273 1.00 0.00 H
ATOM 9254 HA2 GLY A 576 91.728 90.252 77.441 1.00 0.00 H
ATOM 9255 HA3 GLY A 576 90.785 91.845 77.497 1.00 0.00 H
ATOM 9256 N GLN A 577 89.752 90.458 79.436 1.00 0.00 N
ATOM 9257 CA GLN A 577 88.731 89.972 80.397 1.00 0.00 C
ATOM 9258 C GLN A 577 87.440 90.654 80.007 1.00 0.00 C
ATOM 9259 O GLN A 577 87.366 91.805 79.568 1.00 0.00 O
ATOM 9260 CB GLN A 577 89.141 90.324 81.790 1.00 0.00 C
ATOM 9261 CG GLN A 577 90.410 89.559 82.179 1.00 0.00 C
ATOM 9262 CD GLN A 577 90.472 88.076 81.907 1.00 0.00 C
ATOM 9263 NE2 GLN A 577 91.694 87.524 81.815 1.00 0.00 N
ATOM 9264 OE1 GLN A 577 89.514 87.295 81.852 1.00 0.00 O
ATOM 9265 H GLN A 577 90.501 91.043 79.778 1.00 0.00 H
ATOM 9266 HA GLN A 577 88.617 88.905 80.207 1.00 0.00 H
ATOM 9267 HB2 GLN A 577 89.350 91.391 81.868 1.00 0.00 H
ATOM 9268 HB3 GLN A 577 88.328 90.073 82.471 1.00 0.00 H
ATOM 9269 HG2 GLN A 577 91.203 90.084 81.646 1.00 0.00 H
ATOM 9270 HG3 GLN A 577 90.518 89.813 83.234 1.00 0.00 H
ATOM 9271 HE21 GLN A 577 91.751 86.544 81.576 1.00 0.00 H
ATOM 9272 HE22 GLN A 577 92.532 88.001 82.114 1.00 0.00 H
ATOM 9273 N ARG A 578 86.370 89.910 80.274 1.00 0.00 N
ATOM 9274 CA ARG A 578 85.015 90.292 80.327 1.00 0.00 C
ATOM 9275 C ARG A 578 84.807 91.528 81.243 1.00 0.00 C
ATOM 9276 O ARG A 578 85.379 91.620 82.326 1.00 0.00 O
ATOM 9277 CB ARG A 578 84.096 89.094 80.707 1.00 0.00 C
ATOM 9278 CG ARG A 578 84.208 88.004 79.629 1.00 0.00 C
ATOM 9279 CD ARG A 578 83.224 86.893 79.742 1.00 0.00 C
ATOM 9280 NE ARG A 578 81.844 87.393 79.736 1.00 0.00 N
ATOM 9281 CZ ARG A 578 80.776 86.585 79.808 1.00 0.00 C
ATOM 9282 NH1 ARG A 578 80.702 85.330 80.068 1.00 0.00 N1+
ATOM 9283 NH2 ARG A 578 79.636 87.111 79.755 1.00 0.00 N
ATOM 9284 H ARG A 578 86.559 88.927 80.408 1.00 0.00 H
ATOM 9285 HA ARG A 578 84.693 90.565 79.322 1.00 0.00 H
ATOM 9286 HB2 ARG A 578 84.490 88.615 81.604 1.00 0.00 H
ATOM 9287 HB3 ARG A 578 83.065 89.422 80.841 1.00 0.00 H
ATOM 9288 HG2 ARG A 578 83.933 88.496 78.696 1.00 0.00 H
ATOM 9289 HG3 ARG A 578 85.230 87.626 79.604 1.00 0.00 H
ATOM 9290 HD2 ARG A 578 83.292 86.260 78.857 1.00 0.00 H
ATOM 9291 HD3 ARG A 578 83.382 86.343 80.670 1.00 0.00 H
ATOM 9292 HE ARG A 578 81.684 88.389 79.685 1.00 0.00 H
ATOM 9293 HH11 ARG A 578 81.541 84.866 80.385 1.00 0.00 H
ATOM 9294 HH12 ARG A 578 79.792 84.932 80.253 1.00 0.00 H
ATOM 9295 HH21 ARG A 578 79.500 88.071 79.472 1.00 0.00 H
ATOM 9296 HH22 ARG A 578 78.771 86.716 80.096 1.00 0.00 H
ATOM 9297 N THR A 579 83.801 92.318 80.855 1.00 0.00 N
ATOM 9298 CA THR A 579 83.095 93.321 81.699 1.00 0.00 C
ATOM 9299 C THR A 579 81.658 93.019 82.138 1.00 0.00 C
ATOM 9300 O THR A 579 81.070 93.682 83.007 1.00 0.00 O
ATOM 9301 CB THR A 579 82.938 94.575 80.846 1.00 0.00 C
ATOM 9302 CG2 THR A 579 84.378 95.115 80.654 1.00 0.00 C
ATOM 9303 OG1 THR A 579 82.390 94.212 79.580 1.00 0.00 O
ATOM 9304 H THR A 579 83.321 92.090 79.996 1.00 0.00 H
ATOM 9305 HA THR A 579 83.625 93.624 82.602 1.00 0.00 H
ATOM 9306 HB THR A 579 82.280 95.317 81.297 1.00 0.00 H
ATOM 9307 HG1 THR A 579 82.550 94.892 78.920 1.00 0.00 H
ATOM 9308 HG21 THR A 579 84.283 95.978 79.995 1.00 0.00 H
ATOM 9309 HG22 THR A 579 84.888 95.422 81.568 1.00 0.00 H
ATOM 9310 HG23 THR A 579 84.948 94.418 80.040 1.00 0.00 H
ATOM 9311 N ASP A 580 81.119 91.930 81.580 1.00 0.00 N
ATOM 9312 CA ASP A 580 79.690 91.692 81.644 1.00 0.00 C
ATOM 9313 C ASP A 580 79.324 90.373 82.387 1.00 0.00 C
ATOM 9314 O ASP A 580 78.398 89.640 82.025 1.00 0.00 O
ATOM 9315 CB ASP A 580 79.035 91.697 80.292 1.00 0.00 C
ATOM 9316 CG ASP A 580 79.405 90.716 79.248 1.00 0.00 C
ATOM 9317 OD1 ASP A 580 80.561 90.131 79.296 1.00 0.00 O
ATOM 9318 OD2 ASP A 580 78.597 90.411 78.353 1.00 0.00 O1-
ATOM 9319 H ASP A 580 81.575 91.392 80.857 1.00 0.00 H
ATOM 9320 HA ASP A 580 79.292 92.414 82.356 1.00 0.00 H
ATOM 9321 HB2 ASP A 580 77.949 91.629 80.349 1.00 0.00 H
ATOM 9322 HB3 ASP A 580 79.263 92.682 79.886 1.00 0.00 H
ATOM 9323 N CYS A 581 80.126 89.986 83.352 1.00 0.00 N
ATOM 9324 CA CYS A 581 79.963 88.778 84.231 1.00 0.00 C
ATOM 9325 C CYS A 581 79.121 89.067 85.489 1.00 0.00 C
ATOM 9326 O CYS A 581 79.515 89.999 86.200 1.00 0.00 O
ATOM 9327 CB CYS A 581 81.324 88.078 84.640 1.00 0.00 C
ATOM 9328 SG CYS A 581 82.292 87.544 83.205 1.00 0.00 S
ATOM 9329 H CYS A 581 80.974 90.508 83.524 1.00 0.00 H
ATOM 9330 HA CYS A 581 79.473 88.079 83.554 1.00 0.00 H
ATOM 9331 HB2 CYS A 581 81.985 88.804 85.114 1.00 0.00 H
ATOM 9332 HB3 CYS A 581 81.065 87.269 85.322 1.00 0.00 H
ATOM 9333 HG CYS A 581 81.696 86.382 82.925 1.00 0.00 H
ATOM 9334 N PRO A 582 78.157 88.225 85.862 1.00 0.00 N
ATOM 9335 CA PRO A 582 77.354 88.503 87.064 1.00 0.00 C
ATOM 9336 C PRO A 582 78.185 88.355 88.318 1.00 0.00 C
ATOM 9337 O PRO A 582 79.345 87.898 88.433 1.00 0.00 O
ATOM 9338 CB PRO A 582 76.301 87.375 87.020 1.00 0.00 C
ATOM 9339 CG PRO A 582 77.103 86.264 86.420 1.00 0.00 C
ATOM 9340 CD PRO A 582 77.842 86.913 85.311 1.00 0.00 C
ATOM 9341 HA PRO A 582 77.013 89.538 87.031 1.00 0.00 H
ATOM 9342 HB2 PRO A 582 76.088 87.150 88.065 1.00 0.00 H
ATOM 9343 HB3 PRO A 582 75.464 87.658 86.382 1.00 0.00 H
ATOM 9344 HG2 PRO A 582 77.758 85.938 87.228 1.00 0.00 H
ATOM 9345 HG3 PRO A 582 76.456 85.426 86.158 1.00 0.00 H
ATOM 9346 HD2 PRO A 582 78.743 86.315 85.181 1.00 0.00 H
ATOM 9347 HD3 PRO A 582 77.295 87.144 84.397 1.00 0.00 H
ATOM 9348 N THR A 583 77.625 88.866 89.433 1.00 0.00 N
ATOM 9349 CA THR A 583 78.509 89.127 90.637 1.00 0.00 C
ATOM 9350 C THR A 583 78.799 87.829 91.435 1.00 0.00 C
ATOM 9351 O THR A 583 79.487 87.856 92.483 1.00 0.00 O
ATOM 9352 CB THR A 583 77.817 90.146 91.476 1.00 0.00 C
ATOM 9353 CG2 THR A 583 77.428 91.367 90.721 1.00 0.00 C
ATOM 9354 OG1 THR A 583 76.728 89.649 92.243 1.00 0.00 O
ATOM 9355 H THR A 583 76.636 89.059 89.366 1.00 0.00 H
ATOM 9356 HA THR A 583 79.432 89.589 90.286 1.00 0.00 H
ATOM 9357 HB THR A 583 78.553 90.346 92.255 1.00 0.00 H
ATOM 9358 HG1 THR A 583 76.202 90.418 92.475 1.00 0.00 H
ATOM 9359 HG21 THR A 583 78.123 91.452 89.885 1.00 0.00 H
ATOM 9360 HG22 THR A 583 76.431 91.239 90.300 1.00 0.00 H
ATOM 9361 HG23 THR A 583 77.577 92.254 91.337 1.00 0.00 H
ATOM 9362 N THR A 584 78.264 86.640 91.039 1.00 0.00 N
ATOM 9363 CA THR A 584 78.418 85.273 91.574 1.00 0.00 C
ATOM 9364 C THR A 584 79.446 84.523 90.745 1.00 0.00 C
ATOM 9365 O THR A 584 79.807 83.397 91.077 1.00 0.00 O
ATOM 9366 CB THR A 584 77.016 84.554 91.592 1.00 0.00 C
ATOM 9367 CG2 THR A 584 76.140 85.128 92.703 1.00 0.00 C
ATOM 9368 OG1 THR A 584 76.358 84.860 90.356 1.00 0.00 O
ATOM 9369 H THR A 584 77.589 86.767 90.298 1.00 0.00 H
ATOM 9370 HA THR A 584 78.864 85.370 92.564 1.00 0.00 H
ATOM 9371 HB THR A 584 76.988 83.465 91.568 1.00 0.00 H
ATOM 9372 HG1 THR A 584 76.800 84.325 89.693 1.00 0.00 H
ATOM 9373 HG21 THR A 584 75.873 86.175 92.559 1.00 0.00 H
ATOM 9374 HG22 THR A 584 75.207 84.565 92.678 1.00 0.00 H
ATOM 9375 HG23 THR A 584 76.553 84.909 93.687 1.00 0.00 H
ATOM 9376 N VAL A 585 79.908 85.096 89.591 1.00 0.00 N
ATOM 9377 CA VAL A 585 81.047 84.623 88.792 1.00 0.00 C
ATOM 9378 C VAL A 585 82.325 85.334 89.208 1.00 0.00 C
ATOM 9379 O VAL A 585 82.354 86.523 89.326 1.00 0.00 O
ATOM 9380 CB VAL A 585 80.654 84.781 87.257 1.00 0.00 C
ATOM 9381 CG1 VAL A 585 81.910 84.738 86.416 1.00 0.00 C
ATOM 9382 CG2 VAL A 585 79.780 83.673 86.624 1.00 0.00 C
ATOM 9383 H VAL A 585 79.607 86.051 89.453 1.00 0.00 H
ATOM 9384 HA VAL A 585 81.136 83.547 88.941 1.00 0.00 H
ATOM 9385 HB VAL A 585 80.178 85.732 87.017 1.00 0.00 H
ATOM 9386 HG11 VAL A 585 82.630 85.499 86.715 1.00 0.00 H
ATOM 9387 HG12 VAL A 585 82.420 83.782 86.537 1.00 0.00 H
ATOM 9388 HG13 VAL A 585 81.652 84.754 85.357 1.00 0.00 H
ATOM 9389 HG21 VAL A 585 80.268 82.707 86.756 1.00 0.00 H
ATOM 9390 HG22 VAL A 585 78.794 83.688 87.088 1.00 0.00 H
ATOM 9391 HG23 VAL A 585 79.546 83.872 85.578 1.00 0.00 H
ATOM 9392 N ARG A 586 83.395 84.568 89.221 1.00 0.00 N
ATOM 9393 CA ARG A 586 84.740 85.127 89.444 1.00 0.00 C
ATOM 9394 C ARG A 586 85.627 84.903 88.217 1.00 0.00 C
ATOM 9395 O ARG A 586 85.770 83.806 87.762 1.00 0.00 O
ATOM 9396 CB ARG A 586 85.416 84.657 90.742 1.00 0.00 C
ATOM 9397 CG ARG A 586 86.652 85.550 91.136 1.00 0.00 C
ATOM 9398 CD ARG A 586 87.302 85.212 92.455 1.00 0.00 C
ATOM 9399 NE ARG A 586 88.487 85.976 92.725 1.00 0.00 N
ATOM 9400 CZ ARG A 586 89.370 85.683 93.640 1.00 0.00 C
ATOM 9401 NH1 ARG A 586 89.368 84.484 94.275 1.00 0.00 N1+
ATOM 9402 NH2 ARG A 586 90.331 86.494 94.003 1.00 0.00 N
ATOM 9403 H ARG A 586 83.329 83.560 89.217 1.00 0.00 H
ATOM 9404 HA ARG A 586 84.759 86.207 89.592 1.00 0.00 H
ATOM 9405 HB2 ARG A 586 84.707 84.651 91.569 1.00 0.00 H
ATOM 9406 HB3 ARG A 586 85.855 83.675 90.565 1.00 0.00 H
ATOM 9407 HG2 ARG A 586 87.379 85.496 90.325 1.00 0.00 H
ATOM 9408 HG3 ARG A 586 86.337 86.593 91.100 1.00 0.00 H
ATOM 9409 HD2 ARG A 586 86.575 85.316 93.260 1.00 0.00 H
ATOM 9410 HD3 ARG A 586 87.605 84.174 92.318 1.00 0.00 H
ATOM 9411 HE ARG A 586 88.644 86.787 92.144 1.00 0.00 H
ATOM 9412 HH11 ARG A 586 88.531 83.925 94.356 1.00 0.00 H
ATOM 9413 HH12 ARG A 586 90.017 84.408 95.045 1.00 0.00 H
ATOM 9414 HH21 ARG A 586 90.437 87.280 93.377 1.00 0.00 H
ATOM 9415 HH22 ARG A 586 91.008 86.246 94.711 1.00 0.00 H
ATOM 9416 N VAL A 587 86.287 85.967 87.755 1.00 0.00 N
ATOM 9417 CA VAL A 587 87.347 85.986 86.809 1.00 0.00 C
ATOM 9418 C VAL A 587 88.690 85.928 87.552 1.00 0.00 C
ATOM 9419 O VAL A 587 88.891 86.712 88.455 1.00 0.00 O
ATOM 9420 CB VAL A 587 87.130 87.195 85.835 1.00 0.00 C
ATOM 9421 CG1 VAL A 587 88.166 87.514 84.773 1.00 0.00 C
ATOM 9422 CG2 VAL A 587 85.826 86.967 85.061 1.00 0.00 C
ATOM 9423 H VAL A 587 86.191 86.851 88.235 1.00 0.00 H
ATOM 9424 HA VAL A 587 87.177 85.122 86.166 1.00 0.00 H
ATOM 9425 HB VAL A 587 87.012 88.122 86.396 1.00 0.00 H
ATOM 9426 HG11 VAL A 587 89.074 87.818 85.295 1.00 0.00 H
ATOM 9427 HG12 VAL A 587 88.361 86.633 84.161 1.00 0.00 H
ATOM 9428 HG13 VAL A 587 87.840 88.344 84.147 1.00 0.00 H
ATOM 9429 HG21 VAL A 587 85.742 87.693 84.253 1.00 0.00 H
ATOM 9430 HG22 VAL A 587 85.851 85.978 84.602 1.00 0.00 H
ATOM 9431 HG23 VAL A 587 85.038 87.067 85.807 1.00 0.00 H
ATOM 9432 N LEU A 588 89.569 85.112 86.998 1.00 0.00 N
ATOM 9433 CA LEU A 588 90.920 85.042 87.419 1.00 0.00 C
ATOM 9434 C LEU A 588 91.850 85.346 86.240 1.00 0.00 C
ATOM 9435 O LEU A 588 91.498 85.060 85.112 1.00 0.00 O
ATOM 9436 CB LEU A 588 91.246 83.630 88.007 1.00 0.00 C
ATOM 9437 CG LEU A 588 90.435 83.118 89.220 1.00 0.00 C
ATOM 9438 CD1 LEU A 588 90.834 81.716 89.573 1.00 0.00 C
ATOM 9439 CD2 LEU A 588 90.598 84.010 90.467 1.00 0.00 C
ATOM 9440 H LEU A 588 89.208 84.572 86.225 1.00 0.00 H
ATOM 9441 HA LEU A 588 91.167 85.733 88.225 1.00 0.00 H
ATOM 9442 HB2 LEU A 588 91.189 82.952 87.156 1.00 0.00 H
ATOM 9443 HB3 LEU A 588 92.258 83.658 88.410 1.00 0.00 H
ATOM 9444 HG LEU A 588 89.368 83.065 89.003 1.00 0.00 H
ATOM 9445 HD11 LEU A 588 91.905 81.747 89.772 1.00 0.00 H
ATOM 9446 HD12 LEU A 588 90.297 81.415 90.472 1.00 0.00 H
ATOM 9447 HD13 LEU A 588 90.688 81.059 88.715 1.00 0.00 H
ATOM 9448 HD21 LEU A 588 89.852 83.729 91.210 1.00 0.00 H
ATOM 9449 HD22 LEU A 588 91.608 83.898 90.860 1.00 0.00 H
ATOM 9450 HD23 LEU A 588 90.300 85.039 90.266 1.00 0.00 H
ATOM 9451 N LYS A 589 92.893 86.106 86.565 1.00 0.00 N
ATOM 9452 CA LYS A 589 93.673 86.782 85.528 1.00 0.00 C
ATOM 9453 C LYS A 589 95.105 87.151 85.959 1.00 0.00 C
ATOM 9454 O LYS A 589 95.643 86.850 87.067 1.00 0.00 O
ATOM 9455 CB LYS A 589 92.869 88.003 85.130 1.00 0.00 C
ATOM 9456 CG LYS A 589 92.925 89.180 86.171 1.00 0.00 C
ATOM 9457 CD LYS A 589 91.928 90.257 85.894 1.00 0.00 C
ATOM 9458 CE LYS A 589 92.176 91.448 86.966 1.00 0.00 C
ATOM 9459 NZ LYS A 589 92.033 91.065 88.378 1.00 0.00 N1+
ATOM 9460 H LYS A 589 92.993 86.295 87.552 1.00 0.00 H
ATOM 9461 HA LYS A 589 93.733 86.078 84.698 1.00 0.00 H
ATOM 9462 HB2 LYS A 589 93.003 88.360 84.109 1.00 0.00 H
ATOM 9463 HB3 LYS A 589 91.808 87.753 85.113 1.00 0.00 H
ATOM 9464 HG2 LYS A 589 92.698 88.734 87.140 1.00 0.00 H
ATOM 9465 HG3 LYS A 589 93.856 89.746 86.147 1.00 0.00 H
ATOM 9466 HD2 LYS A 589 92.230 90.645 84.921 1.00 0.00 H
ATOM 9467 HD3 LYS A 589 90.919 89.865 86.027 1.00 0.00 H
ATOM 9468 HE2 LYS A 589 93.162 91.904 86.867 1.00 0.00 H
ATOM 9469 HE3 LYS A 589 91.587 92.312 86.659 1.00 0.00 H
ATOM 9470 HZ1 LYS A 589 91.101 90.699 88.513 1.00 0.00 H
ATOM 9471 HZ2 LYS A 589 92.639 90.311 88.671 1.00 0.00 H
ATOM 9472 HZ3 LYS A 589 92.155 91.821 89.037 1.00 0.00 H
ATOM 9473 N GLU A 590 95.889 87.637 84.976 1.00 0.00 N
ATOM 9474 CA GLU A 590 97.308 88.085 85.089 1.00 0.00 C
ATOM 9475 C GLU A 590 97.646 89.132 83.920 1.00 0.00 C
ATOM 9476 O GLU A 590 98.503 88.903 83.068 1.00 0.00 O
ATOM 9477 CB GLU A 590 98.174 86.788 85.030 1.00 0.00 C
ATOM 9478 CG GLU A 590 99.682 87.032 85.081 1.00 0.00 C
ATOM 9479 CD GLU A 590 100.226 86.675 86.441 1.00 0.00 C
ATOM 9480 OE1 GLU A 590 100.040 87.465 87.426 1.00 0.00 O
ATOM 9481 OE2 GLU A 590 100.785 85.595 86.597 1.00 0.00 O1-
ATOM 9482 H GLU A 590 95.415 87.697 84.086 1.00 0.00 H
ATOM 9483 HA GLU A 590 97.425 88.570 86.058 1.00 0.00 H
ATOM 9484 HB2 GLU A 590 97.889 86.052 85.783 1.00 0.00 H
ATOM 9485 HB3 GLU A 590 97.990 86.380 84.036 1.00 0.00 H
ATOM 9486 HG2 GLU A 590 100.095 86.482 84.236 1.00 0.00 H
ATOM 9487 HG3 GLU A 590 99.908 88.096 85.004 1.00 0.00 H
ATOM 9488 N PRO A 591 96.840 90.233 83.593 1.00 0.00 N
ATOM 9489 CA PRO A 591 96.970 90.885 82.269 1.00 0.00 C
ATOM 9490 C PRO A 591 98.212 91.795 82.237 1.00 0.00 C
ATOM 9491 O PRO A 591 98.538 92.515 83.164 1.00 0.00 O
ATOM 9492 CB PRO A 591 95.748 91.774 82.160 1.00 0.00 C
ATOM 9493 CG PRO A 591 95.273 91.979 83.604 1.00 0.00 C
ATOM 9494 CD PRO A 591 95.596 90.605 84.149 1.00 0.00 C
ATOM 9495 HA PRO A 591 96.870 90.122 81.498 1.00 0.00 H
ATOM 9496 HB2 PRO A 591 96.013 92.749 81.751 1.00 0.00 H
ATOM 9497 HB3 PRO A 591 95.036 91.315 81.475 1.00 0.00 H
ATOM 9498 HG2 PRO A 591 95.913 92.673 84.148 1.00 0.00 H
ATOM 9499 HG3 PRO A 591 94.212 92.216 83.688 1.00 0.00 H
ATOM 9500 HD2 PRO A 591 95.721 90.696 85.228 1.00 0.00 H
ATOM 9501 HD3 PRO A 591 94.789 89.888 84.000 1.00 0.00 H
ATOM 9502 N ILE A 592 98.880 91.920 81.054 1.00 0.00 N
ATOM 9503 CA ILE A 592 100.098 92.849 80.804 1.00 0.00 C
ATOM 9504 C ILE A 592 99.886 94.252 81.287 1.00 0.00 C
ATOM 9505 O ILE A 592 98.994 94.914 80.791 1.00 0.00 O
ATOM 9506 CB ILE A 592 100.623 92.899 79.333 1.00 0.00 C
ATOM 9507 CG1 ILE A 592 100.840 91.525 78.586 1.00 0.00 C
ATOM 9508 CG2 ILE A 592 101.864 93.687 79.180 1.00 0.00 C
ATOM 9509 CD1 ILE A 592 101.819 90.688 79.313 1.00 0.00 C
ATOM 9510 H ILE A 592 98.341 91.699 80.228 1.00 0.00 H
ATOM 9511 HA ILE A 592 100.861 92.431 81.461 1.00 0.00 H
ATOM 9512 HB ILE A 592 99.973 93.467 78.667 1.00 0.00 H
ATOM 9513 HG12 ILE A 592 99.933 90.924 78.653 1.00 0.00 H
ATOM 9514 HG13 ILE A 592 101.078 91.701 77.537 1.00 0.00 H
ATOM 9515 HG21 ILE A 592 102.301 93.701 78.181 1.00 0.00 H
ATOM 9516 HG22 ILE A 592 101.648 94.751 79.273 1.00 0.00 H
ATOM 9517 HG23 ILE A 592 102.590 93.444 79.956 1.00 0.00 H
ATOM 9518 HD11 ILE A 592 102.797 91.137 79.141 1.00 0.00 H
ATOM 9519 HD12 ILE A 592 101.836 90.602 80.399 1.00 0.00 H
ATOM 9520 HD13 ILE A 592 101.917 89.700 78.862 1.00 0.00 H
ATOM 9521 N GLY A 593 100.664 94.733 82.293 1.00 0.00 N
ATOM 9522 CA GLY A 593 100.632 96.005 83.007 1.00 0.00 C
ATOM 9523 C GLY A 593 99.273 96.405 83.657 1.00 0.00 C
ATOM 9524 O GLY A 593 99.321 97.467 84.232 1.00 0.00 O
ATOM 9525 H GLY A 593 101.345 94.064 82.621 1.00 0.00 H
ATOM 9526 HA2 GLY A 593 101.335 95.893 83.833 1.00 0.00 H
ATOM 9527 HA3 GLY A 593 100.942 96.823 82.357 1.00 0.00 H
ATOM 9528 N GLY A 594 98.231 95.647 83.498 1.00 0.00 N
ATOM 9529 CA GLY A 594 96.901 96.091 83.886 1.00 0.00 C
ATOM 9530 C GLY A 594 96.105 96.641 82.700 1.00 0.00 C
ATOM 9531 O GLY A 594 94.949 96.831 82.919 1.00 0.00 O
ATOM 9532 H GLY A 594 98.221 94.827 82.908 1.00 0.00 H
ATOM 9533 HA2 GLY A 594 96.443 95.227 84.367 1.00 0.00 H
ATOM 9534 HA3 GLY A 594 96.892 96.706 84.785 1.00 0.00 H
ATOM 9535 N SER A 595 96.605 96.636 81.449 1.00 0.00 N
ATOM 9536 CA SER A 595 95.814 96.851 80.208 1.00 0.00 C
ATOM 9537 C SER A 595 95.697 95.648 79.255 1.00 0.00 C
ATOM 9538 O SER A 595 94.573 95.349 78.874 1.00 0.00 O
ATOM 9539 CB SER A 595 96.141 98.169 79.514 1.00 0.00 C
ATOM 9540 OG SER A 595 95.127 98.520 78.575 1.00 0.00 O
ATOM 9541 H SER A 595 97.536 96.272 81.304 1.00 0.00 H
ATOM 9542 HA SER A 595 94.798 96.965 80.586 1.00 0.00 H
ATOM 9543 HB2 SER A 595 96.279 98.909 80.302 1.00 0.00 H
ATOM 9544 HB3 SER A 595 97.129 98.115 79.059 1.00 0.00 H
ATOM 9545 HG SER A 595 95.025 99.470 78.480 1.00 0.00 H
ATOM 9546 N GLY A 596 96.823 94.978 78.965 1.00 0.00 N
ATOM 9547 CA GLY A 596 96.973 93.994 77.939 1.00 0.00 C
ATOM 9548 C GLY A 596 96.211 92.772 78.458 1.00 0.00 C
ATOM 9549 O GLY A 596 96.666 92.085 79.356 1.00 0.00 O
ATOM 9550 H GLY A 596 97.620 95.190 79.547 1.00 0.00 H
ATOM 9551 HA2 GLY A 596 96.416 94.430 77.110 1.00 0.00 H
ATOM 9552 HA3 GLY A 596 97.995 93.753 77.647 1.00 0.00 H
ATOM 9553 N GLY A 597 95.022 92.662 77.943 1.00 0.00 N
ATOM 9554 CA GLY A 597 94.168 91.558 78.317 1.00 0.00 C
ATOM 9555 C GLY A 597 93.282 91.855 79.560 1.00 0.00 C
ATOM 9556 O GLY A 597 92.629 90.942 79.997 1.00 0.00 O
ATOM 9557 H GLY A 597 94.761 93.393 77.297 1.00 0.00 H
ATOM 9558 HA2 GLY A 597 93.586 91.168 77.482 1.00 0.00 H
ATOM 9559 HA3 GLY A 597 94.787 90.707 78.605 1.00 0.00 H
ATOM 9560 N GLY A 598 93.312 93.094 80.138 1.00 0.00 N
ATOM 9561 CA GLY A 598 92.417 93.453 81.240 1.00 0.00 C
ATOM 9562 C GLY A 598 90.921 93.638 80.876 1.00 0.00 C
ATOM 9563 O GLY A 598 90.480 93.417 79.780 1.00 0.00 O
ATOM 9564 H GLY A 598 93.823 93.851 79.706 1.00 0.00 H
ATOM 9565 HA2 GLY A 598 92.374 92.631 81.955 1.00 0.00 H
ATOM 9566 HA3 GLY A 598 92.810 94.342 81.733 1.00 0.00 H
ATOM 9567 N SER A 599 90.120 94.097 81.775 1.00 0.00 N
ATOM 9568 CA SER A 599 88.673 94.474 81.506 1.00 0.00 C
ATOM 9569 C SER A 599 88.581 95.762 80.651 1.00 0.00 C
ATOM 9570 O SER A 599 89.103 96.832 80.988 1.00 0.00 O
ATOM 9571 CB SER A 599 87.841 94.533 82.820 1.00 0.00 C
ATOM 9572 OG SER A 599 87.789 93.266 83.386 1.00 0.00 O
ATOM 9573 H SER A 599 90.569 94.453 82.607 1.00 0.00 H
ATOM 9574 HA SER A 599 88.120 93.665 81.029 1.00 0.00 H
ATOM 9575 HB2 SER A 599 88.428 95.160 83.491 1.00 0.00 H
ATOM 9576 HB3 SER A 599 86.838 94.959 82.829 1.00 0.00 H
ATOM 9577 HG SER A 599 86.908 92.887 83.355 1.00 0.00 H
ATOM 9578 N GLY A 600 87.797 95.672 79.574 1.00 0.00 N
ATOM 9579 CA GLY A 600 87.687 96.684 78.509 1.00 0.00 C
ATOM 9580 C GLY A 600 86.803 97.954 78.751 1.00 0.00 C
ATOM 9581 O GLY A 600 86.184 98.173 79.784 1.00 0.00 O
ATOM 9582 H GLY A 600 87.469 94.775 79.245 1.00 0.00 H
ATOM 9583 HA2 GLY A 600 88.696 96.899 78.158 1.00 0.00 H
ATOM 9584 HA3 GLY A 600 87.229 96.116 77.699 1.00 0.00 H
ATOM 9585 N GLY A 601 86.775 98.842 77.727 1.00 0.00 N
ATOM 9586 CA GLY A 601 85.989 100.067 77.621 1.00 0.00 C
ATOM 9587 C GLY A 601 84.495 99.799 77.462 1.00 0.00 C
ATOM 9588 O GLY A 601 83.755 100.669 77.891 1.00 0.00 O
ATOM 9589 H GLY A 601 87.389 98.581 76.969 1.00 0.00 H
ATOM 9590 HA2 GLY A 601 86.136 100.656 78.526 1.00 0.00 H
ATOM 9591 HA3 GLY A 601 86.224 100.734 76.792 1.00 0.00 H
ATOM 9592 N SER A 602 84.058 98.609 77.109 1.00 0.00 N
ATOM 9593 CA SER A 602 82.638 98.207 77.303 1.00 0.00 C
ATOM 9594 C SER A 602 82.163 98.197 78.697 1.00 0.00 C
ATOM 9595 O SER A 602 80.945 98.057 78.904 1.00 0.00 O
ATOM 9596 CB SER A 602 82.448 96.817 76.716 1.00 0.00 C
ATOM 9597 OG SER A 602 83.109 95.934 77.516 1.00 0.00 O
ATOM 9598 H SER A 602 84.753 97.994 76.710 1.00 0.00 H
ATOM 9599 HA SER A 602 82.006 98.770 76.616 1.00 0.00 H
ATOM 9600 HB2 SER A 602 81.383 96.592 76.667 1.00 0.00 H
ATOM 9601 HB3 SER A 602 82.836 96.730 75.701 1.00 0.00 H
ATOM 9602 HG SER A 602 83.629 95.385 76.926 1.00 0.00 H
ATOM 9603 N SER A 603 83.074 98.265 79.707 1.00 0.00 N
ATOM 9604 CA SER A 603 82.759 98.584 81.073 1.00 0.00 C
ATOM 9605 C SER A 603 81.988 99.898 81.231 1.00 0.00 C
ATOM 9606 O SER A 603 81.209 100.027 82.196 1.00 0.00 O
ATOM 9607 CB SER A 603 84.065 98.708 81.936 1.00 0.00 C
ATOM 9608 OG SER A 603 84.964 99.731 81.583 1.00 0.00 O
ATOM 9609 H SER A 603 84.035 98.170 79.410 1.00 0.00 H
ATOM 9610 HA SER A 603 82.152 97.784 81.498 1.00 0.00 H
ATOM 9611 HB2 SER A 603 83.730 98.811 82.968 1.00 0.00 H
ATOM 9612 HB3 SER A 603 84.599 97.767 81.800 1.00 0.00 H
ATOM 9613 HG SER A 603 85.667 99.303 81.088 1.00 0.00 H
ATOM 9614 N LYS A 604 82.213 100.854 80.399 1.00 0.00 N
ATOM 9615 CA LYS A 604 81.544 102.203 80.487 1.00 0.00 C
ATOM 9616 C LYS A 604 80.162 102.208 79.854 1.00 0.00 C
ATOM 9617 O LYS A 604 79.617 103.330 79.722 1.00 0.00 O
ATOM 9618 CB LYS A 604 82.404 103.282 79.871 1.00 0.00 C
ATOM 9619 CG LYS A 604 83.650 103.544 80.799 1.00 0.00 C
ATOM 9620 CD LYS A 604 84.624 104.619 80.260 1.00 0.00 C
ATOM 9621 CE LYS A 604 85.218 104.262 78.925 1.00 0.00 C
ATOM 9622 NZ LYS A 604 86.003 105.388 78.453 1.00 0.00 N1+
ATOM 9623 H LYS A 604 82.827 100.660 79.621 1.00 0.00 H
ATOM 9624 HA LYS A 604 81.419 102.473 81.536 1.00 0.00 H
ATOM 9625 HB2 LYS A 604 82.752 102.808 78.953 1.00 0.00 H
ATOM 9626 HB3 LYS A 604 81.877 104.157 79.490 1.00 0.00 H
ATOM 9627 HG2 LYS A 604 83.275 103.876 81.767 1.00 0.00 H
ATOM 9628 HG3 LYS A 604 84.306 102.690 80.967 1.00 0.00 H
ATOM 9629 HD2 LYS A 604 84.055 105.547 80.204 1.00 0.00 H
ATOM 9630 HD3 LYS A 604 85.370 104.750 81.044 1.00 0.00 H
ATOM 9631 HE2 LYS A 604 85.904 103.419 79.012 1.00 0.00 H
ATOM 9632 HE3 LYS A 604 84.397 104.036 78.245 1.00 0.00 H
ATOM 9633 HZ1 LYS A 604 86.482 105.107 77.609 1.00 0.00 H
ATOM 9634 HZ2 LYS A 604 85.433 106.187 78.214 1.00 0.00 H
ATOM 9635 HZ3 LYS A 604 86.678 105.678 79.147 1.00 0.00 H
ATOM 9636 N SER A 605 79.575 101.049 79.554 1.00 0.00 N
ATOM 9637 CA SER A 605 78.173 100.886 79.207 1.00 0.00 C
ATOM 9638 C SER A 605 77.356 100.752 80.513 1.00 0.00 C
ATOM 9639 O SER A 605 77.900 100.313 81.518 1.00 0.00 O
ATOM 9640 CB SER A 605 77.910 99.585 78.407 1.00 0.00 C
ATOM 9641 OG SER A 605 78.227 98.427 79.216 1.00 0.00 O
ATOM 9642 H SER A 605 80.100 100.197 79.695 1.00 0.00 H
ATOM 9643 HA SER A 605 77.796 101.749 78.657 1.00 0.00 H
ATOM 9644 HB2 SER A 605 76.875 99.615 78.067 1.00 0.00 H
ATOM 9645 HB3 SER A 605 78.522 99.548 77.506 1.00 0.00 H
ATOM 9646 HG SER A 605 79.164 98.221 79.185 1.00 0.00 H
ATOM 9647 N LEU A 606 76.064 101.081 80.605 1.00 0.00 N
ATOM 9648 CA LEU A 606 75.151 100.874 81.781 1.00 0.00 C
ATOM 9649 C LEU A 606 74.681 99.441 81.738 1.00 0.00 C
ATOM 9650 O LEU A 606 74.188 98.988 80.704 1.00 0.00 O
ATOM 9651 CB LEU A 606 73.961 101.817 81.739 1.00 0.00 C
ATOM 9652 CG LEU A 606 74.307 103.316 81.823 1.00 0.00 C
ATOM 9653 CD1 LEU A 606 72.964 104.090 81.726 1.00 0.00 C
ATOM 9654 CD2 LEU A 606 75.102 103.817 83.048 1.00 0.00 C
ATOM 9655 H LEU A 606 75.560 101.414 79.796 1.00 0.00 H
ATOM 9656 HA LEU A 606 75.692 100.963 82.723 1.00 0.00 H
ATOM 9657 HB2 LEU A 606 73.531 101.675 80.748 1.00 0.00 H
ATOM 9658 HB3 LEU A 606 73.238 101.560 82.513 1.00 0.00 H
ATOM 9659 HG LEU A 606 74.910 103.398 80.919 1.00 0.00 H
ATOM 9660 HD11 LEU A 606 72.362 103.945 82.623 1.00 0.00 H
ATOM 9661 HD12 LEU A 606 73.256 105.112 81.483 1.00 0.00 H
ATOM 9662 HD13 LEU A 606 72.342 103.562 81.004 1.00 0.00 H
ATOM 9663 HD21 LEU A 606 75.646 104.755 82.936 1.00 0.00 H
ATOM 9664 HD22 LEU A 606 74.442 103.929 83.908 1.00 0.00 H
ATOM 9665 HD23 LEU A 606 75.829 103.020 83.203 1.00 0.00 H
ATOM 9666 N PHE A 607 74.784 98.733 82.878 1.00 0.00 N
ATOM 9667 CA PHE A 607 74.745 97.271 83.089 1.00 0.00 C
ATOM 9668 C PHE A 607 74.075 96.860 84.433 1.00 0.00 C
ATOM 9669 O PHE A 607 74.682 97.228 85.461 1.00 0.00 O
ATOM 9670 CB PHE A 607 76.092 96.621 82.848 1.00 0.00 C
ATOM 9671 CG PHE A 607 76.140 95.104 82.673 1.00 0.00 C
ATOM 9672 CD1 PHE A 607 76.376 94.157 83.704 1.00 0.00 C
ATOM 9673 CD2 PHE A 607 75.859 94.607 81.392 1.00 0.00 C
ATOM 9674 CE1 PHE A 607 76.507 92.801 83.377 1.00 0.00 C
ATOM 9675 CE2 PHE A 607 75.934 93.254 81.105 1.00 0.00 C
ATOM 9676 CZ PHE A 607 76.290 92.338 82.084 1.00 0.00 C
ATOM 9677 H PHE A 607 75.010 99.292 83.689 1.00 0.00 H
ATOM 9678 HA PHE A 607 74.098 96.843 82.323 1.00 0.00 H
ATOM 9679 HB2 PHE A 607 76.444 96.995 81.887 1.00 0.00 H
ATOM 9680 HB3 PHE A 607 76.695 97.006 83.671 1.00 0.00 H
ATOM 9681 HD1 PHE A 607 76.601 94.430 84.725 1.00 0.00 H
ATOM 9682 HD2 PHE A 607 75.593 95.312 80.618 1.00 0.00 H
ATOM 9683 HE1 PHE A 607 76.782 92.028 84.078 1.00 0.00 H
ATOM 9684 HE2 PHE A 607 75.638 92.860 80.144 1.00 0.00 H
ATOM 9685 HZ PHE A 607 76.266 91.275 81.891 1.00 0.00 H
ATOM 9686 N ARG A 608 72.954 96.081 84.470 1.00 0.00 N
ATOM 9687 CA ARG A 608 72.213 95.780 85.734 1.00 0.00 C
ATOM 9688 C ARG A 608 73.013 94.826 86.595 1.00 0.00 C
ATOM 9689 O ARG A 608 73.803 93.957 86.185 1.00 0.00 O
ATOM 9690 CB ARG A 608 70.777 95.349 85.394 1.00 0.00 C
ATOM 9691 CG ARG A 608 70.688 93.983 84.713 1.00 0.00 C
ATOM 9692 CD ARG A 608 69.330 93.695 83.979 1.00 0.00 C
ATOM 9693 NE ARG A 608 69.442 92.674 82.906 1.00 0.00 N
ATOM 9694 CZ ARG A 608 68.610 91.726 82.492 1.00 0.00 C
ATOM 9695 NH1 ARG A 608 67.565 91.466 83.142 1.00 0.00 N1+
ATOM 9696 NH2 ARG A 608 68.820 91.114 81.378 1.00 0.00 N
ATOM 9697 H ARG A 608 72.503 95.940 83.577 1.00 0.00 H
ATOM 9698 HA ARG A 608 72.098 96.710 86.292 1.00 0.00 H
ATOM 9699 HB2 ARG A 608 70.148 95.468 86.276 1.00 0.00 H
ATOM 9700 HB3 ARG A 608 70.333 96.004 84.645 1.00 0.00 H
ATOM 9701 HG2 ARG A 608 71.419 94.064 83.909 1.00 0.00 H
ATOM 9702 HG3 ARG A 608 70.861 93.231 85.482 1.00 0.00 H
ATOM 9703 HD2 ARG A 608 68.659 93.385 84.780 1.00 0.00 H
ATOM 9704 HD3 ARG A 608 69.027 94.637 83.523 1.00 0.00 H
ATOM 9705 HE ARG A 608 70.211 92.900 82.290 1.00 0.00 H
ATOM 9706 HH11 ARG A 608 67.307 91.973 83.977 1.00 0.00 H
ATOM 9707 HH12 ARG A 608 66.997 90.729 82.750 1.00 0.00 H
ATOM 9708 HH21 ARG A 608 69.674 91.243 80.854 1.00 0.00 H
ATOM 9709 HH22 ARG A 608 68.064 90.682 80.866 1.00 0.00 H
ATOM 9710 N GLY A 609 72.725 94.818 87.889 1.00 0.00 N
ATOM 9711 CA GLY A 609 73.345 93.988 88.934 1.00 0.00 C
ATOM 9712 C GLY A 609 72.803 92.502 88.869 1.00 0.00 C
ATOM 9713 O GLY A 609 71.920 92.026 89.623 1.00 0.00 O
ATOM 9714 H GLY A 609 72.187 95.638 88.127 1.00 0.00 H
ATOM 9715 HA2 GLY A 609 74.429 93.935 88.832 1.00 0.00 H
ATOM 9716 HA3 GLY A 609 73.001 94.365 89.897 1.00 0.00 H
ATOM 9717 N LEU A 610 73.308 91.736 87.916 1.00 0.00 N
ATOM 9718 CA LEU A 610 73.084 90.279 87.695 1.00 0.00 C
ATOM 9719 C LEU A 610 73.707 89.389 88.800 1.00 0.00 C
ATOM 9720 O LEU A 610 74.850 89.585 89.240 1.00 0.00 O
ATOM 9721 CB LEU A 610 73.672 89.838 86.314 1.00 0.00 C
ATOM 9722 CG LEU A 610 73.307 90.595 85.037 1.00 0.00 C
ATOM 9723 CD1 LEU A 610 73.943 89.893 83.869 1.00 0.00 C
ATOM 9724 CD2 LEU A 610 71.813 90.642 84.868 1.00 0.00 C
ATOM 9725 H LEU A 610 73.889 92.095 87.172 1.00 0.00 H
ATOM 9726 HA LEU A 610 72.030 90.009 87.740 1.00 0.00 H
ATOM 9727 HB2 LEU A 610 74.758 89.764 86.350 1.00 0.00 H
ATOM 9728 HB3 LEU A 610 73.298 88.814 86.326 1.00 0.00 H
ATOM 9729 HG LEU A 610 73.648 91.619 85.194 1.00 0.00 H
ATOM 9730 HD11 LEU A 610 73.601 88.878 83.670 1.00 0.00 H
ATOM 9731 HD12 LEU A 610 73.805 90.471 82.956 1.00 0.00 H
ATOM 9732 HD13 LEU A 610 75.005 89.751 84.068 1.00 0.00 H
ATOM 9733 HD21 LEU A 610 71.444 89.698 84.467 1.00 0.00 H
ATOM 9734 HD22 LEU A 610 71.294 90.811 85.812 1.00 0.00 H
ATOM 9735 HD23 LEU A 610 71.621 91.371 84.081 1.00 0.00 H
ATOM 9736 N ARG A 611 72.933 88.332 89.162 1.00 0.00 N
ATOM 9737 CA ARG A 611 73.374 87.212 89.945 1.00 0.00 C
ATOM 9738 C ARG A 611 72.269 86.082 90.012 1.00 0.00 C
ATOM 9739 O ARG A 611 71.261 86.191 89.263 1.00 0.00 O
ATOM 9740 CB ARG A 611 73.703 87.643 91.394 1.00 0.00 C
ATOM 9741 CG ARG A 611 72.641 88.387 92.257 1.00 0.00 C
ATOM 9742 CD ARG A 611 73.031 88.120 93.761 1.00 0.00 C
ATOM 9743 NE ARG A 611 72.501 86.810 94.315 1.00 0.00 N
ATOM 9744 CZ ARG A 611 73.251 85.953 95.020 1.00 0.00 C
ATOM 9745 NH1 ARG A 611 74.444 86.201 95.429 1.00 0.00 N1+
ATOM 9746 NH2 ARG A 611 72.739 84.830 95.428 1.00 0.00 N
ATOM 9747 H ARG A 611 71.980 88.285 88.832 1.00 0.00 H
ATOM 9748 HA ARG A 611 74.269 86.700 89.590 1.00 0.00 H
ATOM 9749 HB2 ARG A 611 73.897 86.700 91.906 1.00 0.00 H
ATOM 9750 HB3 ARG A 611 74.652 88.179 91.372 1.00 0.00 H
ATOM 9751 HG2 ARG A 611 72.690 89.420 91.913 1.00 0.00 H
ATOM 9752 HG3 ARG A 611 71.674 87.967 91.980 1.00 0.00 H
ATOM 9753 HD2 ARG A 611 74.109 88.279 93.753 1.00 0.00 H
ATOM 9754 HD3 ARG A 611 72.781 88.883 94.497 1.00 0.00 H
ATOM 9755 HE ARG A 611 71.536 86.538 94.195 1.00 0.00 H
ATOM 9756 HH11 ARG A 611 74.907 86.976 94.978 1.00 0.00 H
ATOM 9757 HH12 ARG A 611 74.956 85.586 96.046 1.00 0.00 H
ATOM 9758 HH21 ARG A 611 71.754 84.837 95.208 1.00 0.00 H
ATOM 9759 HH22 ARG A 611 73.176 84.062 95.918 1.00 0.00 H
ATOM 9760 N ASP A 612 72.471 84.985 90.768 1.00 0.00 N
ATOM 9761 CA ASP A 612 71.461 83.972 91.171 1.00 0.00 C
ATOM 9762 C ASP A 612 70.391 84.544 92.100 1.00 0.00 C
ATOM 9763 O ASP A 612 70.650 84.891 93.304 1.00 0.00 O
ATOM 9764 CB ASP A 612 72.245 82.801 91.787 1.00 0.00 C
ATOM 9765 CG ASP A 612 71.406 81.578 91.967 1.00 0.00 C
ATOM 9766 OD1 ASP A 612 71.812 80.791 92.847 1.00 0.00 O
ATOM 9767 OD2 ASP A 612 70.452 81.340 91.220 1.00 0.00 O1-
ATOM 9768 H ASP A 612 73.365 84.839 91.215 1.00 0.00 H
ATOM 9769 HA ASP A 612 71.000 83.529 90.288 1.00 0.00 H
ATOM 9770 HB2 ASP A 612 73.154 82.591 91.223 1.00 0.00 H
ATOM 9771 HB3 ASP A 612 72.655 83.109 92.749 1.00 0.00 H
ATOM 9772 N TYR A 613 69.138 84.646 91.674 1.00 0.00 N
ATOM 9773 CA TYR A 613 67.959 85.041 92.501 1.00 0.00 C
ATOM 9774 C TYR A 613 67.123 83.848 92.912 1.00 0.00 C
ATOM 9775 O TYR A 613 66.091 84.068 93.517 1.00 0.00 O
ATOM 9776 CB TYR A 613 67.288 86.204 91.751 1.00 0.00 C
ATOM 9777 CG TYR A 613 68.171 87.453 91.587 1.00 0.00 C
ATOM 9778 CD1 TYR A 613 68.607 88.142 92.824 1.00 0.00 C
ATOM 9779 CD2 TYR A 613 68.635 88.029 90.460 1.00 0.00 C
ATOM 9780 CE1 TYR A 613 69.443 89.286 92.840 1.00 0.00 C
ATOM 9781 CE2 TYR A 613 69.464 89.172 90.368 1.00 0.00 C
ATOM 9782 CZ TYR A 613 69.834 89.798 91.593 1.00 0.00 C
ATOM 9783 OH TYR A 613 70.594 90.890 91.654 1.00 0.00 O
ATOM 9784 H TYR A 613 68.940 84.329 90.736 1.00 0.00 H
ATOM 9785 HA TYR A 613 68.261 85.476 93.454 1.00 0.00 H
ATOM 9786 HB2 TYR A 613 66.955 85.843 90.778 1.00 0.00 H
ATOM 9787 HB3 TYR A 613 66.408 86.461 92.339 1.00 0.00 H
ATOM 9788 HD1 TYR A 613 68.174 87.884 93.779 1.00 0.00 H
ATOM 9789 HD2 TYR A 613 68.322 87.496 89.574 1.00 0.00 H
ATOM 9790 HE1 TYR A 613 69.677 89.767 93.778 1.00 0.00 H
ATOM 9791 HE2 TYR A 613 69.833 89.444 89.390 1.00 0.00 H
ATOM 9792 HH TYR A 613 70.704 91.211 90.755 1.00 0.00 H
ATOM 9793 N ASN A 614 67.554 82.605 92.759 1.00 0.00 N
ATOM 9794 CA ASN A 614 66.670 81.468 93.037 1.00 0.00 C
ATOM 9795 C ASN A 614 66.424 81.135 94.572 1.00 0.00 C
ATOM 9796 O ASN A 614 65.409 80.551 94.912 1.00 0.00 O
ATOM 9797 CB ASN A 614 67.203 80.233 92.273 1.00 0.00 C
ATOM 9798 CG ASN A 614 67.102 80.475 90.771 1.00 0.00 C
ATOM 9799 ND2 ASN A 614 67.978 80.937 90.048 1.00 0.00 N
ATOM 9800 OD1 ASN A 614 66.071 80.090 90.221 1.00 0.00 O
ATOM 9801 H ASN A 614 68.469 82.406 92.380 1.00 0.00 H
ATOM 9802 HA ASN A 614 65.695 81.610 92.571 1.00 0.00 H
ATOM 9803 HB2 ASN A 614 68.205 80.006 92.636 1.00 0.00 H
ATOM 9804 HB3 ASN A 614 66.532 79.445 92.617 1.00 0.00 H
ATOM 9805 HD21 ASN A 614 67.730 80.975 89.070 1.00 0.00 H
ATOM 9806 HD22 ASN A 614 68.901 81.036 90.445 1.00 0.00 H
ATOM 9807 N PRO A 615 67.298 81.555 95.492 1.00 0.00 N
ATOM 9808 CA PRO A 615 67.014 81.546 96.892 1.00 0.00 C
ATOM 9809 C PRO A 615 65.702 82.244 97.264 1.00 0.00 C
ATOM 9810 O PRO A 615 65.027 81.790 98.158 1.00 0.00 O
ATOM 9811 CB PRO A 615 68.206 82.202 97.582 1.00 0.00 C
ATOM 9812 CG PRO A 615 69.339 81.862 96.611 1.00 0.00 C
ATOM 9813 CD PRO A 615 68.727 81.847 95.283 1.00 0.00 C
ATOM 9814 HA PRO A 615 66.941 80.547 97.322 1.00 0.00 H
ATOM 9815 HB2 PRO A 615 68.107 83.287 97.622 1.00 0.00 H
ATOM 9816 HB3 PRO A 615 68.320 81.825 98.598 1.00 0.00 H
ATOM 9817 HG2 PRO A 615 70.239 82.477 96.594 1.00 0.00 H
ATOM 9818 HG3 PRO A 615 69.588 80.835 96.878 1.00 0.00 H
ATOM 9819 HD2 PRO A 615 68.878 82.858 94.907 1.00 0.00 H
ATOM 9820 HD3 PRO A 615 69.235 81.116 94.654 1.00 0.00 H
ATOM 9821 N ILE A 616 65.446 83.462 96.672 1.00 0.00 N
ATOM 9822 CA ILE A 616 64.248 84.226 96.815 1.00 0.00 C
ATOM 9823 C ILE A 616 63.073 83.505 96.102 1.00 0.00 C
ATOM 9824 O ILE A 616 61.972 83.497 96.616 1.00 0.00 O
ATOM 9825 CB ILE A 616 64.496 85.634 96.185 1.00 0.00 C
ATOM 9826 CG1 ILE A 616 65.700 86.295 96.839 1.00 0.00 C
ATOM 9827 CG2 ILE A 616 63.251 86.501 96.496 1.00 0.00 C
ATOM 9828 CD1 ILE A 616 66.988 86.071 96.079 1.00 0.00 C
ATOM 9829 H ILE A 616 66.113 83.836 96.012 1.00 0.00 H
ATOM 9830 HA ILE A 616 64.134 84.276 97.898 1.00 0.00 H
ATOM 9831 HB ILE A 616 64.643 85.580 95.106 1.00 0.00 H
ATOM 9832 HG12 ILE A 616 65.530 87.365 96.965 1.00 0.00 H
ATOM 9833 HG13 ILE A 616 65.758 85.909 97.856 1.00 0.00 H
ATOM 9834 HG21 ILE A 616 63.295 87.331 95.791 1.00 0.00 H
ATOM 9835 HG22 ILE A 616 62.336 85.938 96.308 1.00 0.00 H
ATOM 9836 HG23 ILE A 616 63.218 86.793 97.546 1.00 0.00 H
ATOM 9837 HD11 ILE A 616 67.249 85.014 96.136 1.00 0.00 H
ATOM 9838 HD12 ILE A 616 66.996 86.383 95.035 1.00 0.00 H
ATOM 9839 HD13 ILE A 616 67.765 86.693 96.523 1.00 0.00 H
ATOM 9840 N ALA A 617 63.293 82.893 94.937 1.00 0.00 N
ATOM 9841 CA ALA A 617 62.106 82.386 94.167 1.00 0.00 C
ATOM 9842 C ALA A 617 61.625 81.072 94.795 1.00 0.00 C
ATOM 9843 O ALA A 617 60.359 80.924 94.884 1.00 0.00 O
ATOM 9844 CB ALA A 617 62.395 82.243 92.644 1.00 0.00 C
ATOM 9845 H ALA A 617 64.169 82.985 94.443 1.00 0.00 H
ATOM 9846 HA ALA A 617 61.313 83.134 94.168 1.00 0.00 H
ATOM 9847 HB1 ALA A 617 63.203 81.577 92.341 1.00 0.00 H
ATOM 9848 HB2 ALA A 617 61.562 81.664 92.246 1.00 0.00 H
ATOM 9849 HB3 ALA A 617 62.406 83.221 92.162 1.00 0.00 H
ATOM 9850 N SER A 618 62.534 80.302 95.404 1.00 0.00 N
ATOM 9851 CA SER A 618 62.107 79.190 96.321 1.00 0.00 C
ATOM 9852 C SER A 618 61.334 79.724 97.553 1.00 0.00 C
ATOM 9853 O SER A 618 60.516 78.974 98.097 1.00 0.00 O
ATOM 9854 CB SER A 618 63.468 78.597 96.831 1.00 0.00 C
ATOM 9855 OG SER A 618 64.115 78.171 95.752 1.00 0.00 O
ATOM 9856 H SER A 618 63.513 80.547 95.357 1.00 0.00 H
ATOM 9857 HA SER A 618 61.485 78.430 95.848 1.00 0.00 H
ATOM 9858 HB2 SER A 618 63.937 79.414 97.379 1.00 0.00 H
ATOM 9859 HB3 SER A 618 63.184 77.744 97.447 1.00 0.00 H
ATOM 9860 HG SER A 618 64.652 78.886 95.405 1.00 0.00 H
ATOM 9861 N SER A 619 61.511 80.956 98.014 1.00 0.00 N
ATOM 9862 CA SER A 619 61.159 81.339 99.427 1.00 0.00 C
ATOM 9863 C SER A 619 60.225 82.535 99.458 1.00 0.00 C
ATOM 9864 O SER A 619 60.372 83.449 100.270 1.00 0.00 O
ATOM 9865 CB SER A 619 62.430 81.677 100.223 1.00 0.00 C
ATOM 9866 OG SER A 619 63.498 80.735 99.991 1.00 0.00 O
ATOM 9867 H SER A 619 61.754 81.756 97.447 1.00 0.00 H
ATOM 9868 HA SER A 619 60.639 80.541 99.955 1.00 0.00 H
ATOM 9869 HB2 SER A 619 62.797 82.699 100.132 1.00 0.00 H
ATOM 9870 HB3 SER A 619 62.139 81.669 101.273 1.00 0.00 H
ATOM 9871 HG SER A 619 64.156 81.176 99.449 1.00 0.00 H
ATOM 9872 N ILE A 620 59.180 82.626 98.673 1.00 0.00 N
ATOM 9873 CA ILE A 620 58.152 83.726 98.658 1.00 0.00 C
ATOM 9874 C ILE A 620 56.717 83.189 98.583 1.00 0.00 C
ATOM 9875 O ILE A 620 56.509 82.056 98.071 1.00 0.00 O
ATOM 9876 CB ILE A 620 58.574 84.667 97.508 1.00 0.00 C
ATOM 9877 CG1 ILE A 620 58.051 86.085 97.729 1.00 0.00 C
ATOM 9878 CG2 ILE A 620 58.125 84.101 96.156 1.00 0.00 C
ATOM 9879 CD1 ILE A 620 58.759 87.121 96.822 1.00 0.00 C
ATOM 9880 H ILE A 620 58.881 81.811 98.157 1.00 0.00 H
ATOM 9881 HA ILE A 620 58.170 84.268 99.603 1.00 0.00 H
ATOM 9882 HB ILE A 620 59.664 84.647 97.507 1.00 0.00 H
ATOM 9883 HG12 ILE A 620 57.026 86.113 97.358 1.00 0.00 H
ATOM 9884 HG13 ILE A 620 58.261 86.444 98.737 1.00 0.00 H
ATOM 9885 HG21 ILE A 620 58.446 84.719 95.317 1.00 0.00 H
ATOM 9886 HG22 ILE A 620 58.475 83.090 95.948 1.00 0.00 H
ATOM 9887 HG23 ILE A 620 57.037 84.045 96.152 1.00 0.00 H
ATOM 9888 HD11 ILE A 620 59.821 87.002 97.036 1.00 0.00 H
ATOM 9889 HD12 ILE A 620 58.471 86.909 95.792 1.00 0.00 H
ATOM 9890 HD13 ILE A 620 58.491 88.147 97.074 1.00 0.00 H
ATOM 9891 N CYS A 621 55.773 84.000 99.069 1.00 0.00 N
ATOM 9892 CA CYS A 621 54.379 83.723 98.990 1.00 0.00 C
ATOM 9893 C CYS A 621 53.548 85.015 98.982 1.00 0.00 C
ATOM 9894 O CYS A 621 54.075 86.067 99.182 1.00 0.00 O
ATOM 9895 CB CYS A 621 54.041 82.898 100.229 1.00 0.00 C
ATOM 9896 SG CYS A 621 54.328 83.748 101.747 1.00 0.00 S
ATOM 9897 H CYS A 621 56.050 84.826 99.579 1.00 0.00 H
ATOM 9898 HA CYS A 621 54.147 83.144 98.096 1.00 0.00 H
ATOM 9899 HB2 CYS A 621 52.977 82.664 100.270 1.00 0.00 H
ATOM 9900 HB3 CYS A 621 54.637 81.985 100.233 1.00 0.00 H
ATOM 9901 HG CYS A 621 55.617 84.079 101.622 1.00 0.00 H
ATOM 9902 N GLN A 622 52.230 84.869 98.676 1.00 0.00 N
ATOM 9903 CA GLN A 622 51.275 85.926 98.791 1.00 0.00 C
ATOM 9904 C GLN A 622 50.176 85.586 99.832 1.00 0.00 C
ATOM 9905 O GLN A 622 49.710 84.447 99.840 1.00 0.00 O
ATOM 9906 CB GLN A 622 50.733 86.277 97.361 1.00 0.00 C
ATOM 9907 CG GLN A 622 49.747 87.509 97.342 1.00 0.00 C
ATOM 9908 CD GLN A 622 49.053 87.764 96.060 1.00 0.00 C
ATOM 9909 NE2 GLN A 622 48.967 88.997 95.668 1.00 0.00 N
ATOM 9910 OE1 GLN A 622 48.687 86.836 95.362 1.00 0.00 O
ATOM 9911 H GLN A 622 51.818 83.957 98.535 1.00 0.00 H
ATOM 9912 HA GLN A 622 51.751 86.796 99.244 1.00 0.00 H
ATOM 9913 HB2 GLN A 622 51.563 86.585 96.726 1.00 0.00 H
ATOM 9914 HB3 GLN A 622 50.267 85.414 96.884 1.00 0.00 H
ATOM 9915 HG2 GLN A 622 48.926 87.359 98.044 1.00 0.00 H
ATOM 9916 HG3 GLN A 622 50.345 88.383 97.602 1.00 0.00 H
ATOM 9917 HE21 GLN A 622 48.631 89.109 94.722 1.00 0.00 H
ATOM 9918 HE22 GLN A 622 49.280 89.696 96.326 1.00 0.00 H
ATOM 9919 N LEU A 623 49.856 86.568 100.681 1.00 0.00 N
ATOM 9920 CA LEU A 623 49.111 86.403 101.938 1.00 0.00 C
ATOM 9921 C LEU A 623 47.701 86.984 101.754 1.00 0.00 C
ATOM 9922 O LEU A 623 47.423 87.914 101.068 1.00 0.00 O
ATOM 9923 CB LEU A 623 49.895 87.054 103.057 1.00 0.00 C
ATOM 9924 CG LEU A 623 51.338 86.614 103.345 1.00 0.00 C
ATOM 9925 CD1 LEU A 623 52.193 87.611 104.130 1.00 0.00 C
ATOM 9926 CD2 LEU A 623 51.397 85.168 103.955 1.00 0.00 C
ATOM 9927 H LEU A 623 50.291 87.475 100.589 1.00 0.00 H
ATOM 9928 HA LEU A 623 49.077 85.318 102.035 1.00 0.00 H
ATOM 9929 HB2 LEU A 623 49.832 88.141 103.009 1.00 0.00 H
ATOM 9930 HB3 LEU A 623 49.348 86.842 103.975 1.00 0.00 H
ATOM 9931 HG LEU A 623 51.828 86.595 102.372 1.00 0.00 H
ATOM 9932 HD11 LEU A 623 51.790 87.909 105.098 1.00 0.00 H
ATOM 9933 HD12 LEU A 623 53.115 87.048 104.276 1.00 0.00 H
ATOM 9934 HD13 LEU A 623 52.311 88.520 103.541 1.00 0.00 H
ATOM 9935 HD21 LEU A 623 52.482 85.078 104.013 1.00 0.00 H
ATOM 9936 HD22 LEU A 623 51.022 85.010 104.967 1.00 0.00 H
ATOM 9937 HD23 LEU A 623 50.916 84.516 103.226 1.00 0.00 H
ATOM 9938 N ASN A 624 46.701 86.529 102.515 1.00 0.00 N
ATOM 9939 CA ASN A 624 45.495 87.280 102.696 1.00 0.00 C
ATOM 9940 C ASN A 624 44.858 87.082 104.109 1.00 0.00 C
ATOM 9941 O ASN A 624 44.377 86.006 104.492 1.00 0.00 O
ATOM 9942 CB ASN A 624 44.435 87.058 101.532 1.00 0.00 C
ATOM 9943 CG ASN A 624 43.289 88.038 101.336 1.00 0.00 C
ATOM 9944 ND2 ASN A 624 43.136 88.639 100.185 1.00 0.00 N
ATOM 9945 OD1 ASN A 624 42.576 88.279 102.260 1.00 0.00 O
ATOM 9946 H ASN A 624 46.656 85.563 102.808 1.00 0.00 H
ATOM 9947 HA ASN A 624 45.796 88.327 102.663 1.00 0.00 H
ATOM 9948 HB2 ASN A 624 45.077 87.010 100.653 1.00 0.00 H
ATOM 9949 HB3 ASN A 624 44.053 86.038 101.585 1.00 0.00 H
ATOM 9950 HD21 ASN A 624 42.537 89.450 100.131 1.00 0.00 H
ATOM 9951 HD22 ASN A 624 43.681 88.338 99.390 1.00 0.00 H
ATOM 9952 N ASN A 625 44.678 88.193 104.869 1.00 0.00 N
ATOM 9953 CA ASN A 625 43.943 88.264 106.174 1.00 0.00 C
ATOM 9954 C ASN A 625 42.476 88.612 105.996 1.00 0.00 C
ATOM 9955 O ASN A 625 42.209 89.797 105.768 1.00 0.00 O
ATOM 9956 CB ASN A 625 44.796 89.157 107.148 1.00 0.00 C
ATOM 9957 CG ASN A 625 44.201 89.191 108.544 1.00 0.00 C
ATOM 9958 ND2 ASN A 625 44.497 90.276 109.261 1.00 0.00 N
ATOM 9959 OD1 ASN A 625 43.416 88.397 108.952 1.00 0.00 O
ATOM 9960 H ASN A 625 44.958 89.089 104.496 1.00 0.00 H
ATOM 9961 HA ASN A 625 44.000 87.278 106.635 1.00 0.00 H
ATOM 9962 HB2 ASN A 625 45.787 88.727 107.295 1.00 0.00 H
ATOM 9963 HB3 ASN A 625 44.737 90.184 106.789 1.00 0.00 H
ATOM 9964 HD21 ASN A 625 44.133 90.410 110.194 1.00 0.00 H
ATOM 9965 HD22 ASN A 625 45.083 90.993 108.858 1.00 0.00 H
ATOM 9966 N SER A 626 41.598 87.638 106.207 1.00 0.00 N
ATOM 9967 CA SER A 626 40.083 87.814 106.328 1.00 0.00 C
ATOM 9968 C SER A 626 39.490 88.294 107.730 1.00 0.00 C
ATOM 9969 O SER A 626 38.301 88.216 108.026 1.00 0.00 O
ATOM 9970 CB SER A 626 39.374 86.572 105.893 1.00 0.00 C
ATOM 9971 OG SER A 626 39.461 85.566 106.852 1.00 0.00 O
ATOM 9972 H SER A 626 41.922 86.734 106.518 1.00 0.00 H
ATOM 9973 HA SER A 626 39.856 88.703 105.739 1.00 0.00 H
ATOM 9974 HB2 SER A 626 38.339 86.871 105.732 1.00 0.00 H
ATOM 9975 HB3 SER A 626 39.899 86.236 104.999 1.00 0.00 H
ATOM 9976 HG SER A 626 38.816 84.882 106.654 1.00 0.00 H
ATOM 9977 N SER A 627 40.344 88.753 108.599 1.00 0.00 N
ATOM 9978 CA SER A 627 39.903 89.608 109.780 1.00 0.00 C
ATOM 9979 C SER A 627 39.393 90.954 109.206 1.00 0.00 C
ATOM 9980 O SER A 627 40.202 91.789 108.716 1.00 0.00 O
ATOM 9981 CB SER A 627 41.047 89.863 110.768 1.00 0.00 C
ATOM 9982 OG SER A 627 41.743 88.701 111.016 1.00 0.00 O
ATOM 9983 H SER A 627 41.331 88.654 108.407 1.00 0.00 H
ATOM 9984 HA SER A 627 39.143 89.023 110.298 1.00 0.00 H
ATOM 9985 HB2 SER A 627 41.765 90.554 110.325 1.00 0.00 H
ATOM 9986 HB3 SER A 627 40.600 90.227 111.693 1.00 0.00 H
ATOM 9987 HG SER A 627 42.375 88.459 110.334 1.00 0.00 H
ATOM 9988 N GLY A 628 38.098 91.152 109.316 1.00 0.00 N
ATOM 9989 CA GLY A 628 37.355 92.053 108.346 1.00 0.00 C
ATOM 9990 C GLY A 628 37.319 91.574 106.877 1.00 0.00 C
ATOM 9991 O GLY A 628 38.346 91.227 106.291 1.00 0.00 O
ATOM 9992 H GLY A 628 37.656 90.373 109.784 1.00 0.00 H
ATOM 9993 HA2 GLY A 628 36.327 92.066 108.707 1.00 0.00 H
ATOM 9994 HA3 GLY A 628 37.716 93.079 108.424 1.00 0.00 H
ATOM 9995 N ALA A 629 36.150 91.652 106.219 1.00 0.00 N
ATOM 9996 CA ALA A 629 35.772 91.209 104.894 1.00 0.00 C
ATOM 9997 C ALA A 629 36.311 92.136 103.812 1.00 0.00 C
ATOM 9998 O ALA A 629 36.035 91.961 102.622 1.00 0.00 O
ATOM 9999 CB ALA A 629 34.226 90.954 104.818 1.00 0.00 C
ATOM 10000 H ALA A 629 35.331 92.033 106.672 1.00 0.00 H
ATOM 10001 HA ALA A 629 36.268 90.260 104.693 1.00 0.00 H
ATOM 10002 HB1 ALA A 629 34.016 90.438 103.881 1.00 0.00 H
ATOM 10003 HB2 ALA A 629 33.858 90.346 105.644 1.00 0.00 H
ATOM 10004 HB3 ALA A 629 33.757 91.938 104.831 1.00 0.00 H
ATOM 10005 N ARG A 630 37.259 92.957 104.101 1.00 0.00 N
ATOM 10006 CA ARG A 630 38.023 93.712 103.017 1.00 0.00 C
ATOM 10007 C ARG A 630 39.195 92.845 102.520 1.00 0.00 C
ATOM 10008 O ARG A 630 39.843 93.243 101.510 1.00 0.00 O
ATOM 10009 CB ARG A 630 38.550 95.055 103.534 1.00 0.00 C
ATOM 10010 CG ARG A 630 39.304 94.985 104.863 1.00 0.00 C
ATOM 10011 CD ARG A 630 39.698 96.419 105.310 1.00 0.00 C
ATOM 10012 NE ARG A 630 41.018 96.910 104.621 1.00 0.00 N
ATOM 10013 CZ ARG A 630 42.265 97.090 105.083 1.00 0.00 C
ATOM 10014 NH1 ARG A 630 42.613 97.246 106.354 1.00 0.00 N1+
ATOM 10015 NH2 ARG A 630 43.223 97.122 104.219 1.00 0.00 N
ATOM 10016 H ARG A 630 37.389 93.150 105.084 1.00 0.00 H
ATOM 10017 HA ARG A 630 37.365 93.968 102.187 1.00 0.00 H
ATOM 10018 HB2 ARG A 630 39.230 95.363 102.739 1.00 0.00 H
ATOM 10019 HB3 ARG A 630 37.646 95.659 103.600 1.00 0.00 H
ATOM 10020 HG2 ARG A 630 38.573 94.642 105.595 1.00 0.00 H
ATOM 10021 HG3 ARG A 630 40.155 94.306 104.921 1.00 0.00 H
ATOM 10022 HD2 ARG A 630 38.901 97.115 105.047 1.00 0.00 H
ATOM 10023 HD3 ARG A 630 39.712 96.427 106.400 1.00 0.00 H
ATOM 10024 HE ARG A 630 41.023 97.003 103.616 1.00 0.00 H
ATOM 10025 HH11 ARG A 630 41.899 97.201 107.067 1.00 0.00 H
ATOM 10026 HH12 ARG A 630 43.545 97.516 106.635 1.00 0.00 H
ATOM 10027 HH21 ARG A 630 43.036 96.943 103.242 1.00 0.00 H
ATOM 10028 HH22 ARG A 630 44.125 96.942 104.637 1.00 0.00 H
ATOM 10029 N GLN A 631 39.495 91.689 103.150 1.00 0.00 N
ATOM 10030 CA GLN A 631 40.325 90.642 102.510 1.00 0.00 C
ATOM 10031 C GLN A 631 41.666 91.114 102.043 1.00 0.00 C
ATOM 10032 O GLN A 631 41.895 91.233 100.848 1.00 0.00 O
ATOM 10033 CB GLN A 631 39.593 89.839 101.472 1.00 0.00 C
ATOM 10034 CG GLN A 631 38.393 89.217 102.204 1.00 0.00 C
ATOM 10035 CD GLN A 631 37.907 88.026 101.420 1.00 0.00 C
ATOM 10036 NE2 GLN A 631 36.925 87.328 101.904 1.00 0.00 N
ATOM 10037 OE1 GLN A 631 38.310 87.763 100.223 1.00 0.00 O
ATOM 10038 H GLN A 631 38.922 91.396 103.928 1.00 0.00 H
ATOM 10039 HA GLN A 631 40.581 89.942 103.306 1.00 0.00 H
ATOM 10040 HB2 GLN A 631 39.213 90.533 100.722 1.00 0.00 H
ATOM 10041 HB3 GLN A 631 40.231 89.021 101.137 1.00 0.00 H
ATOM 10042 HG2 GLN A 631 38.584 88.854 103.214 1.00 0.00 H
ATOM 10043 HG3 GLN A 631 37.643 90.008 102.191 1.00 0.00 H
ATOM 10044 HE21 GLN A 631 36.420 86.688 101.309 1.00 0.00 H
ATOM 10045 HE22 GLN A 631 36.663 87.404 102.877 1.00 0.00 H
ATOM 10046 N SER A 632 42.472 91.591 103.030 1.00 0.00 N
ATOM 10047 CA SER A 632 43.545 92.502 102.790 1.00 0.00 C
ATOM 10048 C SER A 632 44.739 91.688 102.303 1.00 0.00 C
ATOM 10049 O SER A 632 45.307 90.918 103.060 1.00 0.00 O
ATOM 10050 CB SER A 632 43.887 93.255 104.129 1.00 0.00 C
ATOM 10051 OG SER A 632 42.857 94.023 104.679 1.00 0.00 O
ATOM 10052 H SER A 632 42.311 91.416 104.012 1.00 0.00 H
ATOM 10053 HA SER A 632 43.269 93.179 101.981 1.00 0.00 H
ATOM 10054 HB2 SER A 632 44.054 92.474 104.872 1.00 0.00 H
ATOM 10055 HB3 SER A 632 44.785 93.852 103.968 1.00 0.00 H
ATOM 10056 HG SER A 632 42.134 93.465 104.974 1.00 0.00 H
ATOM 10057 N GLU A 633 45.281 92.033 101.106 1.00 0.00 N
ATOM 10058 CA GLU A 633 46.241 91.155 100.363 1.00 0.00 C
ATOM 10059 C GLU A 633 47.632 91.819 100.253 1.00 0.00 C
ATOM 10060 O GLU A 633 47.717 92.943 99.819 1.00 0.00 O
ATOM 10061 CB GLU A 633 45.569 90.757 99.058 1.00 0.00 C
ATOM 10062 CG GLU A 633 46.266 89.777 98.153 1.00 0.00 C
ATOM 10063 CD GLU A 633 45.370 89.041 97.245 1.00 0.00 C
ATOM 10064 OE1 GLU A 633 44.505 88.345 97.835 1.00 0.00 O
ATOM 10065 OE2 GLU A 633 45.444 89.147 95.975 1.00 0.00 O1-
ATOM 10066 H GLU A 633 44.930 92.846 100.620 1.00 0.00 H
ATOM 10067 HA GLU A 633 46.390 90.173 100.812 1.00 0.00 H
ATOM 10068 HB2 GLU A 633 44.555 90.428 99.285 1.00 0.00 H
ATOM 10069 HB3 GLU A 633 45.453 91.690 98.507 1.00 0.00 H
ATOM 10070 HG2 GLU A 633 47.041 90.270 97.565 1.00 0.00 H
ATOM 10071 HG3 GLU A 633 46.665 89.037 98.846 1.00 0.00 H
ATOM 10072 N MET A 634 48.668 91.096 100.615 1.00 0.00 N
ATOM 10073 CA MET A 634 50.057 91.488 100.686 1.00 0.00 C
ATOM 10074 C MET A 634 51.039 90.367 100.316 1.00 0.00 C
ATOM 10075 O MET A 634 50.763 89.157 100.519 1.00 0.00 O
ATOM 10076 CB MET A 634 50.536 92.030 102.168 1.00 0.00 C
ATOM 10077 CG MET A 634 50.010 93.439 102.431 1.00 0.00 C
ATOM 10078 SD MET A 634 50.080 94.026 104.049 1.00 0.00 S
ATOM 10079 CE MET A 634 51.808 93.774 104.563 1.00 0.00 C
ATOM 10080 H MET A 634 48.491 90.123 100.821 1.00 0.00 H
ATOM 10081 HA MET A 634 50.347 92.291 100.008 1.00 0.00 H
ATOM 10082 HB2 MET A 634 50.126 91.264 102.826 1.00 0.00 H
ATOM 10083 HB3 MET A 634 51.607 92.022 102.366 1.00 0.00 H
ATOM 10084 HG2 MET A 634 50.484 94.141 101.745 1.00 0.00 H
ATOM 10085 HG3 MET A 634 48.960 93.468 102.141 1.00 0.00 H
ATOM 10086 HE1 MET A 634 51.874 92.857 105.148 1.00 0.00 H
ATOM 10087 HE2 MET A 634 52.487 93.758 103.710 1.00 0.00 H
ATOM 10088 HE3 MET A 634 51.849 94.664 105.191 1.00 0.00 H
ATOM 10089 N PHE A 635 52.327 90.626 99.885 1.00 0.00 N
ATOM 10090 CA PHE A 635 53.358 89.568 99.585 1.00 0.00 C
ATOM 10091 C PHE A 635 54.153 89.256 100.873 1.00 0.00 C
ATOM 10092 O PHE A 635 54.185 90.055 101.811 1.00 0.00 O
ATOM 10093 CB PHE A 635 54.344 90.115 98.554 1.00 0.00 C
ATOM 10094 CG PHE A 635 53.856 90.010 97.083 1.00 0.00 C
ATOM 10095 CD1 PHE A 635 53.478 88.782 96.531 1.00 0.00 C
ATOM 10096 CD2 PHE A 635 53.601 91.170 96.309 1.00 0.00 C
ATOM 10097 CE1 PHE A 635 52.858 88.730 95.286 1.00 0.00 C
ATOM 10098 CE2 PHE A 635 53.032 91.093 95.023 1.00 0.00 C
ATOM 10099 CZ PHE A 635 52.681 89.857 94.485 1.00 0.00 C
ATOM 10100 H PHE A 635 52.562 91.602 99.774 1.00 0.00 H
ATOM 10101 HA PHE A 635 52.906 88.603 99.354 1.00 0.00 H
ATOM 10102 HB2 PHE A 635 54.614 91.150 98.764 1.00 0.00 H
ATOM 10103 HB3 PHE A 635 55.341 89.676 98.597 1.00 0.00 H
ATOM 10104 HD1 PHE A 635 53.598 87.864 97.087 1.00 0.00 H
ATOM 10105 HD2 PHE A 635 53.848 92.135 96.726 1.00 0.00 H
ATOM 10106 HE1 PHE A 635 52.665 87.741 94.897 1.00 0.00 H
ATOM 10107 HE2 PHE A 635 52.953 91.992 94.430 1.00 0.00 H
ATOM 10108 HZ PHE A 635 52.234 89.761 93.506 1.00 0.00 H
ATOM 10109 N GLY A 636 54.795 88.095 101.005 1.00 0.00 N
ATOM 10110 CA GLY A 636 55.791 87.815 102.069 1.00 0.00 C
ATOM 10111 C GLY A 636 56.912 86.856 101.741 1.00 0.00 C
ATOM 10112 O GLY A 636 56.712 85.968 100.888 1.00 0.00 O
ATOM 10113 H GLY A 636 54.614 87.333 100.367 1.00 0.00 H
ATOM 10114 HA2 GLY A 636 56.225 88.786 102.307 1.00 0.00 H
ATOM 10115 HA3 GLY A 636 55.295 87.439 102.964 1.00 0.00 H
ATOM 10116 N LEU A 637 57.957 86.883 102.528 1.00 0.00 N
ATOM 10117 CA LEU A 637 59.080 85.941 102.467 1.00 0.00 C
ATOM 10118 C LEU A 637 58.869 84.824 103.468 1.00 0.00 C
ATOM 10119 O LEU A 637 58.475 85.027 104.621 1.00 0.00 O
ATOM 10120 CB LEU A 637 60.453 86.596 102.661 1.00 0.00 C
ATOM 10121 CG LEU A 637 60.982 87.653 101.677 1.00 0.00 C
ATOM 10122 CD1 LEU A 637 60.884 87.167 100.226 1.00 0.00 C
ATOM 10123 CD2 LEU A 637 60.281 89.016 101.827 1.00 0.00 C
ATOM 10124 H LEU A 637 57.774 87.338 103.411 1.00 0.00 H
ATOM 10125 HA LEU A 637 59.090 85.452 101.493 1.00 0.00 H
ATOM 10126 HB2 LEU A 637 60.466 87.037 103.657 1.00 0.00 H
ATOM 10127 HB3 LEU A 637 61.164 85.772 102.606 1.00 0.00 H
ATOM 10128 HG LEU A 637 62.041 87.768 101.910 1.00 0.00 H
ATOM 10129 HD11 LEU A 637 61.162 86.114 100.189 1.00 0.00 H
ATOM 10130 HD12 LEU A 637 59.859 87.247 99.862 1.00 0.00 H
ATOM 10131 HD13 LEU A 637 61.648 87.621 99.595 1.00 0.00 H
ATOM 10132 HD21 LEU A 637 60.581 89.663 101.003 1.00 0.00 H
ATOM 10133 HD22 LEU A 637 59.217 88.866 101.645 1.00 0.00 H
ATOM 10134 HD23 LEU A 637 60.497 89.499 102.780 1.00 0.00 H
ATOM 10135 N GLY A 638 59.267 83.590 103.140 1.00 0.00 N
ATOM 10136 CA GLY A 638 59.252 82.473 104.089 1.00 0.00 C
ATOM 10137 C GLY A 638 60.654 81.897 104.444 1.00 0.00 C
ATOM 10138 O GLY A 638 61.534 81.864 103.559 1.00 0.00 O
ATOM 10139 H GLY A 638 59.907 83.515 102.362 1.00 0.00 H
ATOM 10140 HA2 GLY A 638 58.856 82.789 105.054 1.00 0.00 H
ATOM 10141 HA3 GLY A 638 58.676 81.663 103.643 1.00 0.00 H
ATOM 10142 N PHE A 639 60.827 81.393 105.711 1.00 0.00 N
ATOM 10143 CA PHE A 639 61.992 80.680 106.147 1.00 0.00 C
ATOM 10144 C PHE A 639 61.591 79.640 107.188 1.00 0.00 C
ATOM 10145 O PHE A 639 61.102 80.004 108.258 1.00 0.00 O
ATOM 10146 CB PHE A 639 62.900 81.792 106.738 1.00 0.00 C
ATOM 10147 CG PHE A 639 64.249 81.282 107.140 1.00 0.00 C
ATOM 10148 CD1 PHE A 639 64.333 80.733 108.425 1.00 0.00 C
ATOM 10149 CD2 PHE A 639 65.332 81.194 106.232 1.00 0.00 C
ATOM 10150 CE1 PHE A 639 65.548 80.106 108.844 1.00 0.00 C
ATOM 10151 CE2 PHE A 639 66.533 80.718 106.714 1.00 0.00 C
ATOM 10152 CZ PHE A 639 66.701 80.136 107.996 1.00 0.00 C
ATOM 10153 H PHE A 639 60.042 81.530 106.332 1.00 0.00 H
ATOM 10154 HA PHE A 639 62.565 80.233 105.334 1.00 0.00 H
ATOM 10155 HB2 PHE A 639 63.117 82.607 106.048 1.00 0.00 H
ATOM 10156 HB3 PHE A 639 62.431 82.183 107.641 1.00 0.00 H
ATOM 10157 HD1 PHE A 639 63.535 80.741 109.153 1.00 0.00 H
ATOM 10158 HD2 PHE A 639 65.255 81.538 105.212 1.00 0.00 H
ATOM 10159 HE1 PHE A 639 65.665 79.710 109.842 1.00 0.00 H
ATOM 10160 HE2 PHE A 639 67.425 80.967 106.159 1.00 0.00 H
ATOM 10161 HZ PHE A 639 67.677 79.927 108.408 1.00 0.00 H
ATOM 10162 N GLY A 640 61.696 78.330 106.845 1.00 0.00 N
ATOM 10163 CA GLY A 640 61.169 77.283 107.727 1.00 0.00 C
ATOM 10164 C GLY A 640 59.651 77.498 107.891 1.00 0.00 C
ATOM 10165 O GLY A 640 58.973 77.871 106.957 1.00 0.00 O
ATOM 10166 H GLY A 640 61.937 78.225 105.870 1.00 0.00 H
ATOM 10167 HA2 GLY A 640 61.396 76.294 107.329 1.00 0.00 H
ATOM 10168 HA3 GLY A 640 61.653 77.393 108.698 1.00 0.00 H
ATOM 10169 N GLY A 641 59.234 77.405 109.121 1.00 0.00 N
ATOM 10170 CA GLY A 641 57.931 77.670 109.655 1.00 0.00 C
ATOM 10171 C GLY A 641 57.437 79.123 109.766 1.00 0.00 C
ATOM 10172 O GLY A 641 56.319 79.329 110.245 1.00 0.00 O
ATOM 10173 H GLY A 641 59.953 77.366 109.829 1.00 0.00 H
ATOM 10174 HA2 GLY A 641 57.206 77.138 109.040 1.00 0.00 H
ATOM 10175 HA3 GLY A 641 57.839 77.314 110.681 1.00 0.00 H
ATOM 10176 N LEU A 642 58.327 80.064 109.440 1.00 0.00 N
ATOM 10177 CA LEU A 642 58.144 81.508 109.818 1.00 0.00 C
ATOM 10178 C LEU A 642 57.915 82.304 108.552 1.00 0.00 C
ATOM 10179 O LEU A 642 58.590 82.006 107.579 1.00 0.00 O
ATOM 10180 CB LEU A 642 59.304 82.117 110.633 1.00 0.00 C
ATOM 10181 CG LEU A 642 59.192 81.972 112.095 1.00 0.00 C
ATOM 10182 CD1 LEU A 642 59.330 80.570 112.578 1.00 0.00 C
ATOM 10183 CD2 LEU A 642 60.357 82.730 112.686 1.00 0.00 C
ATOM 10184 H LEU A 642 59.182 79.806 108.969 1.00 0.00 H
ATOM 10185 HA LEU A 642 57.243 81.572 110.429 1.00 0.00 H
ATOM 10186 HB2 LEU A 642 60.206 81.606 110.297 1.00 0.00 H
ATOM 10187 HB3 LEU A 642 59.460 83.142 110.299 1.00 0.00 H
ATOM 10188 HG LEU A 642 58.213 82.299 112.444 1.00 0.00 H
ATOM 10189 HD11 LEU A 642 58.496 79.927 112.298 1.00 0.00 H
ATOM 10190 HD12 LEU A 642 60.153 80.104 112.035 1.00 0.00 H
ATOM 10191 HD13 LEU A 642 59.453 80.588 113.661 1.00 0.00 H
ATOM 10192 HD21 LEU A 642 61.314 82.339 112.341 1.00 0.00 H
ATOM 10193 HD22 LEU A 642 60.222 83.803 112.551 1.00 0.00 H
ATOM 10194 HD23 LEU A 642 60.395 82.582 113.765 1.00 0.00 H
ATOM 10195 N ILE A 643 57.065 83.307 108.587 1.00 0.00 N
ATOM 10196 CA ILE A 643 56.794 84.242 107.481 1.00 0.00 C
ATOM 10197 C ILE A 643 56.971 85.667 107.982 1.00 0.00 C
ATOM 10198 O ILE A 643 56.662 85.941 109.135 1.00 0.00 O
ATOM 10199 CB ILE A 643 55.483 83.867 106.728 1.00 0.00 C
ATOM 10200 CG1 ILE A 643 54.328 84.124 107.745 1.00 0.00 C
ATOM 10201 CG2 ILE A 643 55.410 82.380 106.286 1.00 0.00 C
ATOM 10202 CD1 ILE A 643 52.908 84.429 107.211 1.00 0.00 C
ATOM 10203 H ILE A 643 56.674 83.527 109.492 1.00 0.00 H
ATOM 10204 HA ILE A 643 57.582 84.019 106.762 1.00 0.00 H
ATOM 10205 HB ILE A 643 55.410 84.436 105.801 1.00 0.00 H
ATOM 10206 HG12 ILE A 643 54.245 83.183 108.289 1.00 0.00 H
ATOM 10207 HG13 ILE A 643 54.595 84.899 108.463 1.00 0.00 H
ATOM 10208 HG21 ILE A 643 54.502 82.074 105.767 1.00 0.00 H
ATOM 10209 HG22 ILE A 643 56.313 82.044 105.776 1.00 0.00 H
ATOM 10210 HG23 ILE A 643 55.424 81.803 107.211 1.00 0.00 H
ATOM 10211 HD11 ILE A 643 52.910 83.839 106.295 1.00 0.00 H
ATOM 10212 HD12 ILE A 643 52.050 84.234 107.854 1.00 0.00 H
ATOM 10213 HD13 ILE A 643 52.930 85.511 107.078 1.00 0.00 H
ATOM 10214 N VAL A 644 57.394 86.606 107.111 1.00 0.00 N
ATOM 10215 CA VAL A 644 57.576 88.034 107.383 1.00 0.00 C
ATOM 10216 C VAL A 644 56.913 88.851 106.247 1.00 0.00 C
ATOM 10217 O VAL A 644 56.821 88.488 105.089 1.00 0.00 O
ATOM 10218 CB VAL A 644 59.073 88.299 107.577 1.00 0.00 C
ATOM 10219 CG1 VAL A 644 59.977 87.826 106.397 1.00 0.00 C
ATOM 10220 CG2 VAL A 644 59.388 89.752 107.849 1.00 0.00 C
ATOM 10221 H VAL A 644 57.703 86.235 106.223 1.00 0.00 H
ATOM 10222 HA VAL A 644 57.095 88.369 108.302 1.00 0.00 H
ATOM 10223 HB VAL A 644 59.391 87.764 108.472 1.00 0.00 H
ATOM 10224 HG11 VAL A 644 59.440 87.924 105.454 1.00 0.00 H
ATOM 10225 HG12 VAL A 644 60.888 88.413 106.274 1.00 0.00 H
ATOM 10226 HG13 VAL A 644 60.189 86.760 106.316 1.00 0.00 H
ATOM 10227 HG21 VAL A 644 58.750 90.147 108.640 1.00 0.00 H
ATOM 10228 HG22 VAL A 644 60.463 89.856 107.991 1.00 0.00 H
ATOM 10229 HG23 VAL A 644 59.011 90.433 107.086 1.00 0.00 H
ATOM 10230 N THR A 645 56.299 89.934 106.699 1.00 0.00 N
ATOM 10231 CA THR A 645 55.545 90.938 105.882 1.00 0.00 C
ATOM 10232 C THR A 645 55.665 92.266 106.538 1.00 0.00 C
ATOM 10233 O THR A 645 56.315 92.411 107.529 1.00 0.00 O
ATOM 10234 CB THR A 645 54.100 90.311 105.677 1.00 0.00 C
ATOM 10235 CG2 THR A 645 53.210 90.369 106.952 1.00 0.00 C
ATOM 10236 OG1 THR A 645 53.486 90.991 104.617 1.00 0.00 O
ATOM 10237 H THR A 645 56.314 90.066 107.700 1.00 0.00 H
ATOM 10238 HA THR A 645 55.962 90.844 104.880 1.00 0.00 H
ATOM 10239 HB THR A 645 54.095 89.296 105.282 1.00 0.00 H
ATOM 10240 HG1 THR A 645 53.875 90.714 103.784 1.00 0.00 H
ATOM 10241 HG21 THR A 645 52.164 90.310 106.649 1.00 0.00 H
ATOM 10242 HG22 THR A 645 53.540 89.592 107.642 1.00 0.00 H
ATOM 10243 HG23 THR A 645 53.403 91.345 107.398 1.00 0.00 H
ATOM 10244 N ASN A 646 55.096 93.332 105.968 1.00 0.00 N
ATOM 10245 CA ASN A 646 54.971 94.662 106.582 1.00 0.00 C
ATOM 10246 C ASN A 646 53.878 94.730 107.631 1.00 0.00 C
ATOM 10247 O ASN A 646 52.866 94.072 107.561 1.00 0.00 O
ATOM 10248 CB ASN A 646 54.811 95.740 105.428 1.00 0.00 C
ATOM 10249 CG ASN A 646 55.980 95.910 104.586 1.00 0.00 C
ATOM 10250 ND2 ASN A 646 56.786 96.945 104.832 1.00 0.00 N
ATOM 10251 OD1 ASN A 646 56.176 95.179 103.694 1.00 0.00 O
ATOM 10252 H ASN A 646 54.561 93.136 105.134 1.00 0.00 H
ATOM 10253 HA ASN A 646 55.944 94.726 107.069 1.00 0.00 H
ATOM 10254 HB2 ASN A 646 54.052 95.443 104.705 1.00 0.00 H
ATOM 10255 HB3 ASN A 646 54.463 96.668 105.880 1.00 0.00 H
ATOM 10256 HD21 ASN A 646 57.482 97.072 104.111 1.00 0.00 H
ATOM 10257 HD22 ASN A 646 56.512 97.587 105.562 1.00 0.00 H
ATOM 10258 N GLN A 647 53.976 95.464 108.728 1.00 0.00 N
ATOM 10259 CA GLN A 647 53.038 95.501 109.894 1.00 0.00 C
ATOM 10260 C GLN A 647 51.544 95.694 109.516 1.00 0.00 C
ATOM 10261 O GLN A 647 50.752 95.201 110.318 1.00 0.00 O
ATOM 10262 CB GLN A 647 53.408 96.519 110.932 1.00 0.00 C
ATOM 10263 CG GLN A 647 54.478 96.145 111.963 1.00 0.00 C
ATOM 10264 CD GLN A 647 54.508 97.076 113.174 1.00 0.00 C
ATOM 10265 NE2 GLN A 647 55.636 97.303 113.767 1.00 0.00 N
ATOM 10266 OE1 GLN A 647 53.486 97.491 113.721 1.00 0.00 O
ATOM 10267 H GLN A 647 54.732 96.115 108.882 1.00 0.00 H
ATOM 10268 HA GLN A 647 53.096 94.515 110.354 1.00 0.00 H
ATOM 10269 HB2 GLN A 647 53.687 97.407 110.364 1.00 0.00 H
ATOM 10270 HB3 GLN A 647 52.568 96.667 111.610 1.00 0.00 H
ATOM 10271 HG2 GLN A 647 54.223 95.183 112.407 1.00 0.00 H
ATOM 10272 HG3 GLN A 647 55.448 96.178 111.467 1.00 0.00 H
ATOM 10273 HE21 GLN A 647 55.516 97.560 114.736 1.00 0.00 H
ATOM 10274 HE22 GLN A 647 56.531 97.011 113.401 1.00 0.00 H
ATOM 10275 N HIE A 648 51.171 96.358 108.450 1.00 0.00 N
ATOM 10276 CA HIE A 648 49.760 96.809 108.085 1.00 0.00 C
ATOM 10277 C HIE A 648 48.778 95.660 107.812 1.00 0.00 C
ATOM 10278 O HIE A 648 47.650 95.968 107.419 1.00 0.00 O
ATOM 10279 CB HIE A 648 49.786 97.874 107.078 1.00 0.00 C
ATOM 10280 CG HIE A 648 50.266 97.500 105.710 1.00 0.00 C
ATOM 10281 CD2 HIE A 648 49.578 97.624 104.511 1.00 0.00 C
ATOM 10282 ND1 HIE A 648 51.572 97.199 105.452 1.00 0.00 N
ATOM 10283 CE1 HIE A 648 51.705 97.258 104.093 1.00 0.00 C
ATOM 10284 NE2 HIE A 648 50.488 97.544 103.542 1.00 0.00 N
ATOM 10285 H HIE A 648 51.932 96.689 107.874 1.00 0.00 H
ATOM 10286 HA HIE A 648 49.334 97.254 108.984 1.00 0.00 H
ATOM 10287 HB2 HIE A 648 48.746 98.166 106.933 1.00 0.00 H
ATOM 10288 HB3 HIE A 648 50.180 98.848 107.369 1.00 0.00 H
ATOM 10289 HD2 HIE A 648 48.523 97.820 104.390 1.00 0.00 H
ATOM 10290 HE1 HIE A 648 52.611 97.280 103.506 1.00 0.00 H
ATOM 10291 HE2 HIE A 648 50.397 97.814 102.573 1.00 0.00 H
ATOM 10292 N LEU A 649 49.173 94.370 107.872 1.00 0.00 N
ATOM 10293 CA LEU A 649 48.352 93.236 107.432 1.00 0.00 C
ATOM 10294 C LEU A 649 47.385 92.813 108.451 1.00 0.00 C
ATOM 10295 O LEU A 649 46.275 92.400 108.082 1.00 0.00 O
ATOM 10296 CB LEU A 649 49.267 92.095 106.970 1.00 0.00 C
ATOM 10297 CG LEU A 649 48.626 90.760 106.623 1.00 0.00 C
ATOM 10298 CD1 LEU A 649 47.751 90.919 105.400 1.00 0.00 C
ATOM 10299 CD2 LEU A 649 49.651 89.634 106.201 1.00 0.00 C
ATOM 10300 H LEU A 649 50.085 94.091 108.202 1.00 0.00 H
ATOM 10301 HA LEU A 649 47.808 93.591 106.557 1.00 0.00 H
ATOM 10302 HB2 LEU A 649 49.741 92.352 106.023 1.00 0.00 H
ATOM 10303 HB3 LEU A 649 49.925 91.941 107.826 1.00 0.00 H
ATOM 10304 HG LEU A 649 48.009 90.388 107.441 1.00 0.00 H
ATOM 10305 HD11 LEU A 649 47.291 90.013 105.006 1.00 0.00 H
ATOM 10306 HD12 LEU A 649 46.900 91.539 105.682 1.00 0.00 H
ATOM 10307 HD13 LEU A 649 48.374 91.252 104.570 1.00 0.00 H
ATOM 10308 HD21 LEU A 649 50.213 89.852 105.293 1.00 0.00 H
ATOM 10309 HD22 LEU A 649 50.301 89.471 107.062 1.00 0.00 H
ATOM 10310 HD23 LEU A 649 49.123 88.687 106.091 1.00 0.00 H
ATOM 10311 N PHE A 650 47.776 93.035 109.719 1.00 0.00 N
ATOM 10312 CA PHE A 650 46.935 92.791 110.835 1.00 0.00 C
ATOM 10313 C PHE A 650 46.206 94.071 111.385 1.00 0.00 C
ATOM 10314 O PHE A 650 46.300 94.387 112.605 1.00 0.00 O
ATOM 10315 CB PHE A 650 47.836 92.172 111.954 1.00 0.00 C
ATOM 10316 CG PHE A 650 48.313 90.798 111.475 1.00 0.00 C
ATOM 10317 CD1 PHE A 650 47.404 89.766 111.474 1.00 0.00 C
ATOM 10318 CD2 PHE A 650 49.630 90.582 111.024 1.00 0.00 C
ATOM 10319 CE1 PHE A 650 47.733 88.482 111.107 1.00 0.00 C
ATOM 10320 CE2 PHE A 650 49.990 89.295 110.610 1.00 0.00 C
ATOM 10321 CZ PHE A 650 49.096 88.235 110.741 1.00 0.00 C
ATOM 10322 H PHE A 650 48.639 93.541 109.858 1.00 0.00 H
ATOM 10323 HA PHE A 650 46.211 92.055 110.485 1.00 0.00 H
ATOM 10324 HB2 PHE A 650 48.666 92.878 111.991 1.00 0.00 H
ATOM 10325 HB3 PHE A 650 47.343 92.133 112.925 1.00 0.00 H
ATOM 10326 HD1 PHE A 650 46.382 89.971 111.754 1.00 0.00 H
ATOM 10327 HD2 PHE A 650 50.368 91.367 111.107 1.00 0.00 H
ATOM 10328 HE1 PHE A 650 46.992 87.742 111.368 1.00 0.00 H
ATOM 10329 HE2 PHE A 650 50.981 89.031 110.271 1.00 0.00 H
ATOM 10330 HZ PHE A 650 49.343 87.241 110.400 1.00 0.00 H
ATOM 10331 N LYS A 651 45.544 94.796 110.408 1.00 0.00 N
ATOM 10332 CA LYS A 651 44.682 95.918 110.765 1.00 0.00 C
ATOM 10333 C LYS A 651 43.590 95.406 111.720 1.00 0.00 C
ATOM 10334 O LYS A 651 43.324 95.952 112.764 1.00 0.00 O
ATOM 10335 CB LYS A 651 44.249 96.704 109.481 1.00 0.00 C
ATOM 10336 CG LYS A 651 43.400 97.918 109.752 1.00 0.00 C
ATOM 10337 CD LYS A 651 44.098 99.238 110.078 1.00 0.00 C
ATOM 10338 CE LYS A 651 42.988 100.227 110.338 1.00 0.00 C
ATOM 10339 NZ LYS A 651 43.514 101.636 110.556 1.00 0.00 N1+
ATOM 10340 H LYS A 651 45.673 94.550 109.437 1.00 0.00 H
ATOM 10341 HA LYS A 651 45.262 96.629 111.354 1.00 0.00 H
ATOM 10342 HB2 LYS A 651 45.202 96.853 108.974 1.00 0.00 H
ATOM 10343 HB3 LYS A 651 43.694 95.989 108.872 1.00 0.00 H
ATOM 10344 HG2 LYS A 651 42.676 98.090 108.956 1.00 0.00 H
ATOM 10345 HG3 LYS A 651 42.715 97.688 110.568 1.00 0.00 H
ATOM 10346 HD2 LYS A 651 44.742 99.142 110.952 1.00 0.00 H
ATOM 10347 HD3 LYS A 651 44.704 99.550 109.228 1.00 0.00 H
ATOM 10348 HE2 LYS A 651 42.296 100.270 109.497 1.00 0.00 H
ATOM 10349 HE3 LYS A 651 42.433 99.915 111.222 1.00 0.00 H
ATOM 10350 HZ1 LYS A 651 44.119 101.912 109.796 1.00 0.00 H
ATOM 10351 HZ2 LYS A 651 42.748 102.293 110.604 1.00 0.00 H
ATOM 10352 HZ3 LYS A 651 44.111 101.547 111.367 1.00 0.00 H
ATOM 10353 N ARG A 652 42.985 94.236 111.404 1.00 0.00 N
ATOM 10354 CA ARG A 652 42.170 93.377 112.377 1.00 0.00 C
ATOM 10355 C ARG A 652 42.813 92.022 112.609 1.00 0.00 C
ATOM 10356 O ARG A 652 43.547 91.528 111.758 1.00 0.00 O
ATOM 10357 CB ARG A 652 40.728 93.305 111.997 1.00 0.00 C
ATOM 10358 CG ARG A 652 39.904 94.592 112.124 1.00 0.00 C
ATOM 10359 CD ARG A 652 38.546 94.412 111.383 1.00 0.00 C
ATOM 10360 NE ARG A 652 37.675 93.511 111.963 1.00 0.00 N
ATOM 10361 CZ ARG A 652 36.423 93.156 111.511 1.00 0.00 C
ATOM 10362 NH1 ARG A 652 35.678 93.910 110.775 1.00 0.00 N1+
ATOM 10363 NH2 ARG A 652 35.809 92.123 112.003 1.00 0.00 N
ATOM 10364 H ARG A 652 43.118 93.796 110.505 1.00 0.00 H
ATOM 10365 HA ARG A 652 42.246 93.897 113.332 1.00 0.00 H
ATOM 10366 HB2 ARG A 652 40.672 92.791 111.037 1.00 0.00 H
ATOM 10367 HB3 ARG A 652 40.342 92.614 112.747 1.00 0.00 H
ATOM 10368 HG2 ARG A 652 39.561 94.557 113.158 1.00 0.00 H
ATOM 10369 HG3 ARG A 652 40.412 95.531 111.902 1.00 0.00 H
ATOM 10370 HD2 ARG A 652 38.099 95.406 111.398 1.00 0.00 H
ATOM 10371 HD3 ARG A 652 38.621 94.057 110.355 1.00 0.00 H
ATOM 10372 HE ARG A 652 38.001 92.827 112.631 1.00 0.00 H
ATOM 10373 HH11 ARG A 652 35.947 94.748 110.280 1.00 0.00 H
ATOM 10374 HH12 ARG A 652 34.729 93.571 110.695 1.00 0.00 H
ATOM 10375 HH21 ARG A 652 36.405 91.513 112.544 1.00 0.00 H
ATOM 10376 HH22 ARG A 652 34.912 91.798 111.672 1.00 0.00 H
ATOM 10377 N ASN A 653 42.514 91.392 113.758 1.00 0.00 N
ATOM 10378 CA ASN A 653 42.946 90.019 114.096 1.00 0.00 C
ATOM 10379 C ASN A 653 41.689 89.341 114.707 1.00 0.00 C
ATOM 10380 O ASN A 653 41.416 89.408 115.881 1.00 0.00 O
ATOM 10381 CB ASN A 653 44.182 90.195 115.015 1.00 0.00 C
ATOM 10382 CG ASN A 653 44.719 88.930 115.632 1.00 0.00 C
ATOM 10383 ND2 ASN A 653 45.955 88.945 116.051 1.00 0.00 N
ATOM 10384 OD1 ASN A 653 44.037 87.903 115.678 1.00 0.00 O
ATOM 10385 H ASN A 653 41.792 91.750 114.367 1.00 0.00 H
ATOM 10386 HA ASN A 653 43.276 89.394 113.266 1.00 0.00 H
ATOM 10387 HB2 ASN A 653 45.058 90.558 114.478 1.00 0.00 H
ATOM 10388 HB3 ASN A 653 43.923 90.948 115.759 1.00 0.00 H
ATOM 10389 HD21 ASN A 653 46.399 88.056 116.236 1.00 0.00 H
ATOM 10390 HD22 ASN A 653 46.463 89.817 116.036 1.00 0.00 H
ATOM 10391 N ASP A 654 40.814 88.811 113.867 1.00 0.00 N
ATOM 10392 CA ASP A 654 39.480 88.268 114.205 1.00 0.00 C
ATOM 10393 C ASP A 654 38.960 87.375 113.130 1.00 0.00 C
ATOM 10394 O ASP A 654 37.793 86.990 113.118 1.00 0.00 O
ATOM 10395 CB ASP A 654 38.530 89.331 114.710 1.00 0.00 C
ATOM 10396 CG ASP A 654 38.191 90.502 113.723 1.00 0.00 C
ATOM 10397 OD1 ASP A 654 37.991 91.621 114.196 1.00 0.00 O
ATOM 10398 OD2 ASP A 654 37.947 90.345 112.488 1.00 0.00 O1-
ATOM 10399 H ASP A 654 40.871 89.077 112.895 1.00 0.00 H
ATOM 10400 HA ASP A 654 39.576 87.550 115.019 1.00 0.00 H
ATOM 10401 HB2 ASP A 654 37.592 88.825 114.936 1.00 0.00 H
ATOM 10402 HB3 ASP A 654 39.068 89.821 115.522 1.00 0.00 H
ATOM 10403 N GLY A 655 39.844 86.759 112.389 1.00 0.00 N
ATOM 10404 CA GLY A 655 39.426 85.850 111.343 1.00 0.00 C
ATOM 10405 C GLY A 655 40.365 84.645 110.901 1.00 0.00 C
ATOM 10406 O GLY A 655 40.662 83.865 111.747 1.00 0.00 O
ATOM 10407 H GLY A 655 40.779 87.140 112.340 1.00 0.00 H
ATOM 10408 HA2 GLY A 655 38.572 85.246 111.649 1.00 0.00 H
ATOM 10409 HA3 GLY A 655 39.208 86.475 110.477 1.00 0.00 H
ATOM 10410 N GLU A 656 40.625 84.603 109.597 1.00 0.00 N
ATOM 10411 CA GLU A 656 41.533 83.554 109.023 1.00 0.00 C
ATOM 10412 C GLU A 656 42.662 84.221 108.215 1.00 0.00 C
ATOM 10413 O GLU A 656 42.563 85.342 107.733 1.00 0.00 O
ATOM 10414 CB GLU A 656 40.841 82.374 108.253 1.00 0.00 C
ATOM 10415 CG GLU A 656 39.434 82.062 108.803 1.00 0.00 C
ATOM 10416 CD GLU A 656 38.441 82.883 107.981 1.00 0.00 C
ATOM 10417 OE1 GLU A 656 38.397 82.994 106.722 1.00 0.00 O
ATOM 10418 OE2 GLU A 656 37.535 83.496 108.627 1.00 0.00 O1-
ATOM 10419 H GLU A 656 40.441 85.415 109.025 1.00 0.00 H
ATOM 10420 HA GLU A 656 41.978 83.066 109.890 1.00 0.00 H
ATOM 10421 HB2 GLU A 656 40.838 82.647 107.198 1.00 0.00 H
ATOM 10422 HB3 GLU A 656 41.513 81.531 108.411 1.00 0.00 H
ATOM 10423 HG2 GLU A 656 39.319 80.989 108.652 1.00 0.00 H
ATOM 10424 HG3 GLU A 656 39.388 82.224 109.880 1.00 0.00 H
ATOM 10425 N LEU A 657 43.804 83.537 107.980 1.00 0.00 N
ATOM 10426 CA LEU A 657 44.976 84.027 107.198 1.00 0.00 C
ATOM 10427 C LEU A 657 45.231 82.893 106.142 1.00 0.00 C
ATOM 10428 O LEU A 657 45.769 81.878 106.480 1.00 0.00 O
ATOM 10429 CB LEU A 657 46.213 84.356 108.107 1.00 0.00 C
ATOM 10430 CG LEU A 657 47.504 84.436 107.237 1.00 0.00 C
ATOM 10431 CD1 LEU A 657 47.585 85.722 106.406 1.00 0.00 C
ATOM 10432 CD2 LEU A 657 48.674 84.471 108.153 1.00 0.00 C
ATOM 10433 H LEU A 657 43.881 82.588 108.317 1.00 0.00 H
ATOM 10434 HA LEU A 657 44.723 84.938 106.656 1.00 0.00 H
ATOM 10435 HB2 LEU A 657 45.970 85.319 108.556 1.00 0.00 H
ATOM 10436 HB3 LEU A 657 46.370 83.593 108.870 1.00 0.00 H
ATOM 10437 HG LEU A 657 47.741 83.624 106.550 1.00 0.00 H
ATOM 10438 HD11 LEU A 657 48.441 85.794 105.734 1.00 0.00 H
ATOM 10439 HD12 LEU A 657 46.796 85.728 105.654 1.00 0.00 H
ATOM 10440 HD13 LEU A 657 47.365 86.643 106.944 1.00 0.00 H
ATOM 10441 HD21 LEU A 657 48.578 85.295 108.860 1.00 0.00 H
ATOM 10442 HD22 LEU A 657 48.781 83.537 108.704 1.00 0.00 H
ATOM 10443 HD23 LEU A 657 49.624 84.538 107.622 1.00 0.00 H
ATOM 10444 N THR A 658 44.921 83.191 104.887 1.00 0.00 N
ATOM 10445 CA THR A 658 45.259 82.431 103.689 1.00 0.00 C
ATOM 10446 C THR A 658 46.711 82.721 103.217 1.00 0.00 C
ATOM 10447 O THR A 658 47.200 83.923 103.152 1.00 0.00 O
ATOM 10448 CB THR A 658 44.280 82.767 102.581 1.00 0.00 C
ATOM 10449 CG2 THR A 658 44.505 81.952 101.271 1.00 0.00 C
ATOM 10450 OG1 THR A 658 42.880 82.646 102.924 1.00 0.00 O
ATOM 10451 H THR A 658 44.525 84.116 104.803 1.00 0.00 H
ATOM 10452 HA THR A 658 45.052 81.375 103.865 1.00 0.00 H
ATOM 10453 HB THR A 658 44.479 83.791 102.264 1.00 0.00 H
ATOM 10454 HG1 THR A 658 42.640 83.434 103.419 1.00 0.00 H
ATOM 10455 HG21 THR A 658 43.640 81.826 100.620 1.00 0.00 H
ATOM 10456 HG22 THR A 658 45.251 82.389 100.605 1.00 0.00 H
ATOM 10457 HG23 THR A 658 44.957 80.964 101.354 1.00 0.00 H
ATOM 10458 N ILE A 659 47.457 81.728 102.728 1.00 0.00 N
ATOM 10459 CA ILE A 659 48.806 81.857 102.148 1.00 0.00 C
ATOM 10460 C ILE A 659 48.977 80.914 100.915 1.00 0.00 C
ATOM 10461 O ILE A 659 48.621 79.717 100.952 1.00 0.00 O
ATOM 10462 CB ILE A 659 49.781 81.249 103.227 1.00 0.00 C
ATOM 10463 CG1 ILE A 659 49.814 82.002 104.571 1.00 0.00 C
ATOM 10464 CG2 ILE A 659 51.292 81.262 102.742 1.00 0.00 C
ATOM 10465 CD1 ILE A 659 49.323 81.100 105.684 1.00 0.00 C
ATOM 10466 H ILE A 659 47.215 80.764 102.905 1.00 0.00 H
ATOM 10467 HA ILE A 659 48.973 82.897 101.866 1.00 0.00 H
ATOM 10468 HB ILE A 659 49.375 80.264 103.460 1.00 0.00 H
ATOM 10469 HG12 ILE A 659 50.836 82.331 104.759 1.00 0.00 H
ATOM 10470 HG13 ILE A 659 49.118 82.836 104.477 1.00 0.00 H
ATOM 10471 HG21 ILE A 659 51.822 80.720 103.525 1.00 0.00 H
ATOM 10472 HG22 ILE A 659 51.373 80.923 101.709 1.00 0.00 H
ATOM 10473 HG23 ILE A 659 51.628 82.299 102.749 1.00 0.00 H
ATOM 10474 HD11 ILE A 659 49.929 80.199 105.781 1.00 0.00 H
ATOM 10475 HD12 ILE A 659 49.364 81.679 106.606 1.00 0.00 H
ATOM 10476 HD13 ILE A 659 48.272 80.930 105.451 1.00 0.00 H
ATOM 10477 N ARG A 660 49.486 81.428 99.827 1.00 0.00 N
ATOM 10478 CA ARG A 660 49.675 80.867 98.487 1.00 0.00 C
ATOM 10479 C ARG A 660 51.079 81.104 98.017 1.00 0.00 C
ATOM 10480 O ARG A 660 51.517 82.226 98.010 1.00 0.00 O
ATOM 10481 CB ARG A 660 48.543 81.502 97.578 1.00 0.00 C
ATOM 10482 CG ARG A 660 48.444 80.779 96.226 1.00 0.00 C
ATOM 10483 CD ARG A 660 47.323 81.353 95.294 1.00 0.00 C
ATOM 10484 NE ARG A 660 47.098 80.535 94.078 1.00 0.00 N
ATOM 10485 CZ ARG A 660 46.140 79.605 93.869 1.00 0.00 C
ATOM 10486 NH1 ARG A 660 45.482 79.111 94.883 1.00 0.00 N1+
ATOM 10487 NH2 ARG A 660 45.904 79.061 92.737 1.00 0.00 N
ATOM 10488 H ARG A 660 49.755 82.382 100.023 1.00 0.00 H
ATOM 10489 HA ARG A 660 49.420 79.812 98.589 1.00 0.00 H
ATOM 10490 HB2 ARG A 660 47.602 81.359 98.109 1.00 0.00 H
ATOM 10491 HB3 ARG A 660 48.660 82.584 97.521 1.00 0.00 H
ATOM 10492 HG2 ARG A 660 49.396 80.896 95.709 1.00 0.00 H
ATOM 10493 HG3 ARG A 660 48.217 79.716 96.310 1.00 0.00 H
ATOM 10494 HD2 ARG A 660 46.370 81.525 95.794 1.00 0.00 H
ATOM 10495 HD3 ARG A 660 47.660 82.288 94.845 1.00 0.00 H
ATOM 10496 HE ARG A 660 47.659 80.816 93.286 1.00 0.00 H
ATOM 10497 HH11 ARG A 660 45.435 79.672 95.722 1.00 0.00 H
ATOM 10498 HH12 ARG A 660 44.740 78.432 94.791 1.00 0.00 H
ATOM 10499 HH21 ARG A 660 46.349 79.400 91.896 1.00 0.00 H
ATOM 10500 HH22 ARG A 660 45.243 78.304 92.639 1.00 0.00 H
ATOM 10501 N SER A 661 51.650 80.023 97.502 1.00 0.00 N
ATOM 10502 CA SER A 661 52.782 80.056 96.519 1.00 0.00 C
ATOM 10503 C SER A 661 52.610 79.023 95.381 1.00 0.00 C
ATOM 10504 O SER A 661 51.661 78.252 95.324 1.00 0.00 O
ATOM 10505 CB SER A 661 54.097 79.978 97.310 1.00 0.00 C
ATOM 10506 OG SER A 661 54.288 78.644 97.770 1.00 0.00 O
ATOM 10507 H SER A 661 51.050 79.244 97.271 1.00 0.00 H
ATOM 10508 HA SER A 661 52.824 81.043 96.058 1.00 0.00 H
ATOM 10509 HB2 SER A 661 54.919 80.294 96.668 1.00 0.00 H
ATOM 10510 HB3 SER A 661 54.021 80.673 98.147 1.00 0.00 H
ATOM 10511 HG SER A 661 53.564 78.327 98.316 1.00 0.00 H
ATOM 10512 N HIE A 662 53.720 78.855 94.673 1.00 0.00 N
ATOM 10513 CA HIE A 662 53.842 77.914 93.569 1.00 0.00 C
ATOM 10514 C HIE A 662 53.784 76.418 93.997 1.00 0.00 C
ATOM 10515 O HIE A 662 53.617 75.531 93.157 1.00 0.00 O
ATOM 10516 CB HIE A 662 55.231 78.119 92.870 1.00 0.00 C
ATOM 10517 CG HIE A 662 56.401 77.634 93.652 1.00 0.00 C
ATOM 10518 CD2 HIE A 662 56.801 76.331 93.641 1.00 0.00 C
ATOM 10519 ND1 HIE A 662 57.148 78.318 94.620 1.00 0.00 N
ATOM 10520 CE1 HIE A 662 58.089 77.422 95.110 1.00 0.00 C
ATOM 10521 NE2 HIE A 662 57.777 76.190 94.525 1.00 0.00 N
ATOM 10522 H HIE A 662 54.511 79.414 94.958 1.00 0.00 H
ATOM 10523 HA HIE A 662 53.079 78.160 92.830 1.00 0.00 H
ATOM 10524 HB2 HIE A 662 55.132 77.650 91.891 1.00 0.00 H
ATOM 10525 HB3 HIE A 662 55.405 79.187 92.736 1.00 0.00 H
ATOM 10526 HD2 HIE A 662 56.541 75.526 92.969 1.00 0.00 H
ATOM 10527 HE1 HIE A 662 58.672 77.556 96.009 1.00 0.00 H
ATOM 10528 HE2 HIE A 662 58.342 75.373 94.704 1.00 0.00 H
ATOM 10529 N HIE A 663 53.938 76.137 95.308 1.00 0.00 N
ATOM 10530 CA HIE A 663 53.658 74.838 95.913 1.00 0.00 C
ATOM 10531 C HIE A 663 52.161 74.510 96.092 1.00 0.00 C
ATOM 10532 O HIE A 663 51.802 73.347 95.834 1.00 0.00 O
ATOM 10533 CB HIE A 663 54.293 74.727 97.268 1.00 0.00 C
ATOM 10534 CG HIE A 663 54.344 73.281 97.788 1.00 0.00 C
ATOM 10535 CD2 HIE A 663 54.307 72.171 97.045 1.00 0.00 C
ATOM 10536 ND1 HIE A 663 54.426 72.845 99.105 1.00 0.00 N
ATOM 10537 CE1 HIE A 663 54.422 71.496 99.103 1.00 0.00 C
ATOM 10538 NE2 HIE A 663 54.479 71.077 97.861 1.00 0.00 N
ATOM 10539 H HIE A 663 54.180 76.858 95.973 1.00 0.00 H
ATOM 10540 HA HIE A 663 54.118 74.033 95.339 1.00 0.00 H
ATOM 10541 HB2 HIE A 663 55.341 75.015 97.184 1.00 0.00 H
ATOM 10542 HB3 HIE A 663 53.790 75.435 97.925 1.00 0.00 H
ATOM 10543 HD2 HIE A 663 54.297 72.096 95.968 1.00 0.00 H
ATOM 10544 HE1 HIE A 663 54.310 70.843 99.956 1.00 0.00 H
ATOM 10545 HE2 HIE A 663 54.591 70.099 97.633 1.00 0.00 H
ATOM 10546 N GLY A 664 51.374 75.488 96.426 1.00 0.00 N
ATOM 10547 CA GLY A 664 49.880 75.461 96.639 1.00 0.00 C
ATOM 10548 C GLY A 664 49.383 76.528 97.522 1.00 0.00 C
ATOM 10549 O GLY A 664 49.860 77.666 97.425 1.00 0.00 O
ATOM 10550 H GLY A 664 51.819 76.395 96.440 1.00 0.00 H
ATOM 10551 HA2 GLY A 664 49.395 75.628 95.678 1.00 0.00 H
ATOM 10552 HA3 GLY A 664 49.519 74.479 96.947 1.00 0.00 H
ATOM 10553 N GLU A 665 48.378 76.175 98.345 1.00 0.00 N
ATOM 10554 CA GLU A 665 47.638 77.105 99.302 1.00 0.00 C
ATOM 10555 C GLU A 665 47.131 76.429 100.577 1.00 0.00 C
ATOM 10556 O GLU A 665 46.931 75.248 100.642 1.00 0.00 O
ATOM 10557 CB GLU A 665 46.506 77.805 98.501 1.00 0.00 C
ATOM 10558 CG GLU A 665 45.787 79.040 99.230 1.00 0.00 C
ATOM 10559 CD GLU A 665 44.729 79.730 98.400 1.00 0.00 C
ATOM 10560 OE1 GLU A 665 45.068 80.244 97.328 1.00 0.00 O
ATOM 10561 OE2 GLU A 665 43.482 79.699 98.738 1.00 0.00 O1-
ATOM 10562 H GLU A 665 47.921 75.312 98.087 1.00 0.00 H
ATOM 10563 HA GLU A 665 48.369 77.863 99.583 1.00 0.00 H
ATOM 10564 HB2 GLU A 665 46.961 78.190 97.589 1.00 0.00 H
ATOM 10565 HB3 GLU A 665 45.885 76.932 98.300 1.00 0.00 H
ATOM 10566 HG2 GLU A 665 45.451 78.741 100.222 1.00 0.00 H
ATOM 10567 HG3 GLU A 665 46.598 79.761 99.344 1.00 0.00 H
ATOM 10568 N PHE A 666 47.048 77.229 101.703 1.00 0.00 N
ATOM 10569 CA PHE A 666 46.628 76.858 103.072 1.00 0.00 C
ATOM 10570 C PHE A 666 45.955 78.022 103.768 1.00 0.00 C
ATOM 10571 O PHE A 666 46.316 79.132 103.469 1.00 0.00 O
ATOM 10572 CB PHE A 666 47.823 76.292 103.846 1.00 0.00 C
ATOM 10573 CG PHE A 666 47.534 75.804 105.240 1.00 0.00 C
ATOM 10574 CD1 PHE A 666 47.620 76.703 106.327 1.00 0.00 C
ATOM 10575 CD2 PHE A 666 47.099 74.482 105.473 1.00 0.00 C
ATOM 10576 CE1 PHE A 666 47.376 76.239 107.625 1.00 0.00 C
ATOM 10577 CE2 PHE A 666 46.729 74.064 106.737 1.00 0.00 C
ATOM 10578 CZ PHE A 666 46.978 74.926 107.796 1.00 0.00 C
ATOM 10579 H PHE A 666 47.219 78.215 101.566 1.00 0.00 H
ATOM 10580 HA PHE A 666 45.909 76.052 102.926 1.00 0.00 H
ATOM 10581 HB2 PHE A 666 48.288 75.506 103.251 1.00 0.00 H
ATOM 10582 HB3 PHE A 666 48.614 77.034 103.956 1.00 0.00 H
ATOM 10583 HD1 PHE A 666 47.877 77.738 106.156 1.00 0.00 H
ATOM 10584 HD2 PHE A 666 46.945 73.880 104.589 1.00 0.00 H
ATOM 10585 HE1 PHE A 666 47.522 76.838 108.513 1.00 0.00 H
ATOM 10586 HE2 PHE A 666 46.445 73.046 106.962 1.00 0.00 H
ATOM 10587 HZ PHE A 666 46.907 74.561 108.811 1.00 0.00 H
ATOM 10588 N VAL A 667 44.947 77.793 104.650 1.00 0.00 N
ATOM 10589 CA VAL A 667 44.284 78.989 105.274 1.00 0.00 C
ATOM 10590 C VAL A 667 44.297 78.736 106.843 1.00 0.00 C
ATOM 10591 O VAL A 667 43.709 77.742 107.258 1.00 0.00 O
ATOM 10592 CB VAL A 667 42.868 79.247 104.692 1.00 0.00 C
ATOM 10593 CG1 VAL A 667 42.312 80.585 105.207 1.00 0.00 C
ATOM 10594 CG2 VAL A 667 42.780 79.153 103.154 1.00 0.00 C
ATOM 10595 H VAL A 667 44.711 76.854 104.939 1.00 0.00 H
ATOM 10596 HA VAL A 667 44.880 79.879 105.073 1.00 0.00 H
ATOM 10597 HB VAL A 667 42.332 78.401 105.124 1.00 0.00 H
ATOM 10598 HG11 VAL A 667 42.188 80.445 106.281 1.00 0.00 H
ATOM 10599 HG12 VAL A 667 43.063 81.318 104.913 1.00 0.00 H
ATOM 10600 HG13 VAL A 667 41.382 80.765 104.668 1.00 0.00 H
ATOM 10601 HG21 VAL A 667 43.293 80.028 102.754 1.00 0.00 H
ATOM 10602 HG22 VAL A 667 43.262 78.322 102.640 1.00 0.00 H
ATOM 10603 HG23 VAL A 667 41.726 79.170 102.875 1.00 0.00 H
ATOM 10604 N VAL A 668 44.825 79.649 107.673 1.00 0.00 N
ATOM 10605 CA VAL A 668 44.867 79.472 109.119 1.00 0.00 C
ATOM 10606 C VAL A 668 43.504 79.763 109.727 1.00 0.00 C
ATOM 10607 O VAL A 668 43.131 80.906 109.846 1.00 0.00 O
ATOM 10608 CB VAL A 668 45.988 80.239 109.803 1.00 0.00 C
ATOM 10609 CG1 VAL A 668 45.989 79.872 111.257 1.00 0.00 C
ATOM 10610 CG2 VAL A 668 47.405 79.881 109.347 1.00 0.00 C
ATOM 10611 H VAL A 668 45.359 80.374 107.216 1.00 0.00 H
ATOM 10612 HA VAL A 668 45.083 78.419 109.299 1.00 0.00 H
ATOM 10613 HB VAL A 668 45.808 81.314 109.807 1.00 0.00 H
ATOM 10614 HG11 VAL A 668 46.809 80.325 111.815 1.00 0.00 H
ATOM 10615 HG12 VAL A 668 45.112 80.412 111.614 1.00 0.00 H
ATOM 10616 HG13 VAL A 668 45.965 78.785 111.336 1.00 0.00 H
ATOM 10617 HG21 VAL A 668 47.622 78.815 109.415 1.00 0.00 H
ATOM 10618 HG22 VAL A 668 47.453 80.187 108.302 1.00 0.00 H
ATOM 10619 HG23 VAL A 668 48.102 80.453 109.960 1.00 0.00 H
ATOM 10620 N LYS A 669 42.787 78.787 110.337 1.00 0.00 N
ATOM 10621 CA LYS A 669 41.406 78.852 110.728 1.00 0.00 C
ATOM 10622 C LYS A 669 41.073 79.756 111.898 1.00 0.00 C
ATOM 10623 O LYS A 669 39.923 80.190 112.055 1.00 0.00 O
ATOM 10624 CB LYS A 669 40.841 77.416 110.729 1.00 0.00 C
ATOM 10625 CG LYS A 669 40.581 76.940 109.245 1.00 0.00 C
ATOM 10626 CD LYS A 669 40.182 75.498 109.005 1.00 0.00 C
ATOM 10627 CE LYS A 669 40.585 75.238 107.553 1.00 0.00 C
ATOM 10628 NZ LYS A 669 40.200 73.836 107.222 1.00 0.00 N1+
ATOM 10629 H LYS A 669 43.207 77.878 110.208 1.00 0.00 H
ATOM 10630 HA LYS A 669 40.926 79.442 109.947 1.00 0.00 H
ATOM 10631 HB2 LYS A 669 41.591 76.822 111.253 1.00 0.00 H
ATOM 10632 HB3 LYS A 669 39.885 77.432 111.253 1.00 0.00 H
ATOM 10633 HG2 LYS A 669 39.819 77.597 108.824 1.00 0.00 H
ATOM 10634 HG3 LYS A 669 41.444 77.161 108.617 1.00 0.00 H
ATOM 10635 HD2 LYS A 669 40.762 74.738 109.530 1.00 0.00 H
ATOM 10636 HD3 LYS A 669 39.129 75.478 109.287 1.00 0.00 H
ATOM 10637 HE2 LYS A 669 39.988 75.856 106.882 1.00 0.00 H
ATOM 10638 HE3 LYS A 669 41.646 75.417 107.380 1.00 0.00 H
ATOM 10639 HZ1 LYS A 669 40.706 73.627 106.373 1.00 0.00 H
ATOM 10640 HZ2 LYS A 669 40.574 73.227 107.935 1.00 0.00 H
ATOM 10641 HZ3 LYS A 669 39.208 73.817 107.029 1.00 0.00 H
ATOM 10642 N ASP A 670 42.096 80.208 112.651 1.00 0.00 N
ATOM 10643 CA ASP A 670 42.067 81.374 113.570 1.00 0.00 C
ATOM 10644 C ASP A 670 43.351 82.238 113.519 1.00 0.00 C
ATOM 10645 O ASP A 670 44.419 81.710 113.863 1.00 0.00 O
ATOM 10646 CB ASP A 670 42.043 80.961 115.033 1.00 0.00 C
ATOM 10647 CG ASP A 670 41.933 82.163 116.033 1.00 0.00 C
ATOM 10648 OD1 ASP A 670 42.534 82.072 117.098 1.00 0.00 O
ATOM 10649 OD2 ASP A 670 41.403 83.245 115.736 1.00 0.00 O1-
ATOM 10650 H ASP A 670 43.006 79.872 112.368 1.00 0.00 H
ATOM 10651 HA ASP A 670 41.197 81.998 113.367 1.00 0.00 H
ATOM 10652 HB2 ASP A 670 41.160 80.346 115.208 1.00 0.00 H
ATOM 10653 HB3 ASP A 670 42.896 80.370 115.367 1.00 0.00 H
ATOM 10654 N THR A 671 43.236 83.561 113.367 1.00 0.00 N
ATOM 10655 CA THR A 671 44.358 84.472 113.511 1.00 0.00 C
ATOM 10656 C THR A 671 44.746 84.751 115.010 1.00 0.00 C
ATOM 10657 O THR A 671 45.954 84.911 115.312 1.00 0.00 O
ATOM 10658 CB THR A 671 43.990 85.816 112.852 1.00 0.00 C
ATOM 10659 CG2 THR A 671 43.806 85.677 111.336 1.00 0.00 C
ATOM 10660 OG1 THR A 671 42.758 86.362 113.352 1.00 0.00 O
ATOM 10661 H THR A 671 42.308 83.936 113.236 1.00 0.00 H
ATOM 10662 HA THR A 671 45.256 84.035 113.073 1.00 0.00 H
ATOM 10663 HB THR A 671 44.718 86.605 113.041 1.00 0.00 H
ATOM 10664 HG1 THR A 671 42.819 86.538 114.294 1.00 0.00 H
ATOM 10665 HG21 THR A 671 43.437 86.674 111.095 1.00 0.00 H
ATOM 10666 HG22 THR A 671 44.792 85.579 110.882 1.00 0.00 H
ATOM 10667 HG23 THR A 671 43.123 84.872 111.063 1.00 0.00 H
ATOM 10668 N LYS A 672 43.813 84.805 115.978 1.00 0.00 N
ATOM 10669 CA LYS A 672 44.074 85.287 117.415 1.00 0.00 C
ATOM 10670 C LYS A 672 45.189 84.372 118.113 1.00 0.00 C
ATOM 10671 O LYS A 672 45.854 84.819 119.021 1.00 0.00 O
ATOM 10672 CB LYS A 672 42.775 85.305 118.210 1.00 0.00 C
ATOM 10673 CG LYS A 672 41.740 86.308 117.585 1.00 0.00 C
ATOM 10674 CD LYS A 672 40.428 86.411 118.437 1.00 0.00 C
ATOM 10675 CE LYS A 672 39.582 85.115 118.543 1.00 0.00 C
ATOM 10676 NZ LYS A 672 39.250 84.496 117.228 1.00 0.00 N1+
ATOM 10677 H LYS A 672 42.843 84.644 115.748 1.00 0.00 H
ATOM 10678 HA LYS A 672 44.531 86.276 117.471 1.00 0.00 H
ATOM 10679 HB2 LYS A 672 42.373 84.293 118.179 1.00 0.00 H
ATOM 10680 HB3 LYS A 672 42.982 85.459 119.270 1.00 0.00 H
ATOM 10681 HG2 LYS A 672 42.351 87.210 117.617 1.00 0.00 H
ATOM 10682 HG3 LYS A 672 41.560 86.035 116.545 1.00 0.00 H
ATOM 10683 HD2 LYS A 672 40.758 86.578 119.463 1.00 0.00 H
ATOM 10684 HD3 LYS A 672 39.756 87.211 118.129 1.00 0.00 H
ATOM 10685 HE2 LYS A 672 40.219 84.485 119.164 1.00 0.00 H
ATOM 10686 HE3 LYS A 672 38.758 85.315 119.228 1.00 0.00 H
ATOM 10687 HZ1 LYS A 672 38.782 83.634 117.473 1.00 0.00 H
ATOM 10688 HZ2 LYS A 672 38.604 85.044 116.678 1.00 0.00 H
ATOM 10689 HZ3 LYS A 672 40.093 84.346 116.692 1.00 0.00 H
ATOM 10690 N THR A 673 45.227 83.154 117.767 1.00 0.00 N
ATOM 10691 CA THR A 673 46.016 82.150 118.350 1.00 0.00 C
ATOM 10692 C THR A 673 47.383 82.057 117.713 1.00 0.00 C
ATOM 10693 O THR A 673 48.350 81.566 118.388 1.00 0.00 O
ATOM 10694 CB THR A 673 45.336 80.765 118.278 1.00 0.00 C
ATOM 10695 CG2 THR A 673 46.164 79.814 119.233 1.00 0.00 C
ATOM 10696 OG1 THR A 673 44.114 80.925 118.814 1.00 0.00 O
ATOM 10697 H THR A 673 44.483 82.772 117.200 1.00 0.00 H
ATOM 10698 HA THR A 673 46.190 82.342 119.409 1.00 0.00 H
ATOM 10699 HB THR A 673 45.308 80.363 117.265 1.00 0.00 H
ATOM 10700 HG1 THR A 673 43.644 81.511 118.217 1.00 0.00 H
ATOM 10701 HG21 THR A 673 46.482 80.294 120.159 1.00 0.00 H
ATOM 10702 HG22 THR A 673 45.475 79.000 119.461 1.00 0.00 H
ATOM 10703 HG23 THR A 673 47.007 79.409 118.674 1.00 0.00 H
ATOM 10704 N LEU A 674 47.588 82.626 116.559 1.00 0.00 N
ATOM 10705 CA LEU A 674 48.882 82.829 115.911 1.00 0.00 C
ATOM 10706 C LEU A 674 49.817 83.632 116.859 1.00 0.00 C
ATOM 10707 O LEU A 674 49.465 84.693 117.386 1.00 0.00 O
ATOM 10708 CB LEU A 674 48.787 83.595 114.593 1.00 0.00 C
ATOM 10709 CG LEU A 674 48.260 82.830 113.353 1.00 0.00 C
ATOM 10710 CD1 LEU A 674 48.075 83.750 112.188 1.00 0.00 C
ATOM 10711 CD2 LEU A 674 49.237 81.776 112.971 1.00 0.00 C
ATOM 10712 H LEU A 674 46.751 82.965 116.107 1.00 0.00 H
ATOM 10713 HA LEU A 674 49.346 81.846 115.837 1.00 0.00 H
ATOM 10714 HB2 LEU A 674 48.214 84.515 114.708 1.00 0.00 H
ATOM 10715 HB3 LEU A 674 49.806 83.932 114.405 1.00 0.00 H
ATOM 10716 HG LEU A 674 47.291 82.397 113.602 1.00 0.00 H
ATOM 10717 HD11 LEU A 674 47.377 84.524 112.507 1.00 0.00 H
ATOM 10718 HD12 LEU A 674 48.993 84.271 111.914 1.00 0.00 H
ATOM 10719 HD13 LEU A 674 47.670 83.286 111.289 1.00 0.00 H
ATOM 10720 HD21 LEU A 674 50.252 82.173 112.987 1.00 0.00 H
ATOM 10721 HD22 LEU A 674 49.231 80.958 113.692 1.00 0.00 H
ATOM 10722 HD23 LEU A 674 49.146 81.327 111.981 1.00 0.00 H
ATOM 10723 N LYS A 675 51.043 83.093 116.888 1.00 0.00 N
ATOM 10724 CA LYS A 675 52.297 83.745 117.353 1.00 0.00 C
ATOM 10725 C LYS A 675 52.745 84.780 116.339 1.00 0.00 C
ATOM 10726 O LYS A 675 53.561 84.442 115.432 1.00 0.00 O
ATOM 10727 CB LYS A 675 53.231 82.650 117.804 1.00 0.00 C
ATOM 10728 CG LYS A 675 52.862 82.089 119.193 1.00 0.00 C
ATOM 10729 CD LYS A 675 54.074 81.284 119.752 1.00 0.00 C
ATOM 10730 CE LYS A 675 53.731 80.586 121.048 1.00 0.00 C
ATOM 10731 NZ LYS A 675 54.900 80.125 121.624 1.00 0.00 N1+
ATOM 10732 H LYS A 675 51.137 82.208 116.410 1.00 0.00 H
ATOM 10733 HA LYS A 675 51.980 84.352 118.200 1.00 0.00 H
ATOM 10734 HB2 LYS A 675 53.374 81.814 117.119 1.00 0.00 H
ATOM 10735 HB3 LYS A 675 54.163 83.197 117.945 1.00 0.00 H
ATOM 10736 HG2 LYS A 675 52.664 82.876 119.920 1.00 0.00 H
ATOM 10737 HG3 LYS A 675 52.017 81.417 119.044 1.00 0.00 H
ATOM 10738 HD2 LYS A 675 54.430 80.570 119.009 1.00 0.00 H
ATOM 10739 HD3 LYS A 675 54.933 81.931 119.928 1.00 0.00 H
ATOM 10740 HE2 LYS A 675 53.265 81.390 121.617 1.00 0.00 H
ATOM 10741 HE3 LYS A 675 52.969 79.826 120.877 1.00 0.00 H
ATOM 10742 HZ1 LYS A 675 54.603 79.419 122.283 1.00 0.00 H
ATOM 10743 HZ2 LYS A 675 55.445 79.636 120.929 1.00 0.00 H
ATOM 10744 HZ3 LYS A 675 55.422 80.931 121.938 1.00 0.00 H
ATOM 10745 N LEU A 676 52.261 86.009 116.578 1.00 0.00 N
ATOM 10746 CA LEU A 676 52.779 87.245 115.960 1.00 0.00 C
ATOM 10747 C LEU A 676 54.030 87.764 116.675 1.00 0.00 C
ATOM 10748 O LEU A 676 54.182 87.681 117.898 1.00 0.00 O
ATOM 10749 CB LEU A 676 51.656 88.280 116.074 1.00 0.00 C
ATOM 10750 CG LEU A 676 50.337 87.879 115.386 1.00 0.00 C
ATOM 10751 CD1 LEU A 676 49.336 88.851 115.869 1.00 0.00 C
ATOM 10752 CD2 LEU A 676 50.394 87.952 113.850 1.00 0.00 C
ATOM 10753 H LEU A 676 51.544 86.064 117.288 1.00 0.00 H
ATOM 10754 HA LEU A 676 52.868 87.060 114.889 1.00 0.00 H
ATOM 10755 HB2 LEU A 676 51.571 88.571 117.121 1.00 0.00 H
ATOM 10756 HB3 LEU A 676 51.921 89.208 115.565 1.00 0.00 H
ATOM 10757 HG LEU A 676 50.006 86.921 115.788 1.00 0.00 H
ATOM 10758 HD11 LEU A 676 48.379 88.736 115.361 1.00 0.00 H
ATOM 10759 HD12 LEU A 676 49.357 88.779 116.956 1.00 0.00 H
ATOM 10760 HD13 LEU A 676 49.570 89.903 115.709 1.00 0.00 H
ATOM 10761 HD21 LEU A 676 50.788 88.885 113.445 1.00 0.00 H
ATOM 10762 HD22 LEU A 676 51.002 87.108 113.524 1.00 0.00 H
ATOM 10763 HD23 LEU A 676 49.438 87.759 113.362 1.00 0.00 H
ATOM 10764 N LEU A 677 54.907 88.351 115.935 1.00 0.00 N
ATOM 10765 CA LEU A 677 55.925 89.271 116.569 1.00 0.00 C
ATOM 10766 C LEU A 677 56.390 90.495 115.683 1.00 0.00 C
ATOM 10767 O LEU A 677 57.015 90.144 114.648 1.00 0.00 O
ATOM 10768 CB LEU A 677 57.077 88.431 117.027 1.00 0.00 C
ATOM 10769 CG LEU A 677 58.352 89.264 117.511 1.00 0.00 C
ATOM 10770 CD1 LEU A 677 58.056 90.026 118.841 1.00 0.00 C
ATOM 10771 CD2 LEU A 677 59.635 88.487 117.719 1.00 0.00 C
ATOM 10772 H LEU A 677 54.682 88.515 114.964 1.00 0.00 H
ATOM 10773 HA LEU A 677 55.549 89.641 117.523 1.00 0.00 H
ATOM 10774 HB2 LEU A 677 56.751 87.691 117.758 1.00 0.00 H
ATOM 10775 HB3 LEU A 677 57.324 87.887 116.115 1.00 0.00 H
ATOM 10776 HG LEU A 677 58.560 89.991 116.727 1.00 0.00 H
ATOM 10777 HD11 LEU A 677 58.922 90.652 119.055 1.00 0.00 H
ATOM 10778 HD12 LEU A 677 57.103 90.554 118.864 1.00 0.00 H
ATOM 10779 HD13 LEU A 677 58.112 89.313 119.664 1.00 0.00 H
ATOM 10780 HD21 LEU A 677 59.980 87.932 116.846 1.00 0.00 H
ATOM 10781 HD22 LEU A 677 60.485 88.994 118.175 1.00 0.00 H
ATOM 10782 HD23 LEU A 677 59.548 87.657 118.420 1.00 0.00 H
ATOM 10783 N PRO A 678 56.149 91.751 116.083 1.00 0.00 N
ATOM 10784 CA PRO A 678 56.593 92.843 115.260 1.00 0.00 C
ATOM 10785 C PRO A 678 57.974 93.362 115.575 1.00 0.00 C
ATOM 10786 O PRO A 678 58.467 93.120 116.682 1.00 0.00 O
ATOM 10787 CB PRO A 678 55.507 93.943 115.476 1.00 0.00 C
ATOM 10788 CG PRO A 678 55.154 93.688 116.963 1.00 0.00 C
ATOM 10789 CD PRO A 678 55.291 92.202 117.149 1.00 0.00 C
ATOM 10790 HA PRO A 678 56.501 92.617 114.197 1.00 0.00 H
ATOM 10791 HB2 PRO A 678 55.829 94.981 115.396 1.00 0.00 H
ATOM 10792 HB3 PRO A 678 54.647 93.717 114.846 1.00 0.00 H
ATOM 10793 HG2 PRO A 678 55.799 94.232 117.653 1.00 0.00 H
ATOM 10794 HG3 PRO A 678 54.105 93.952 117.090 1.00 0.00 H
ATOM 10795 HD2 PRO A 678 55.819 92.054 118.091 1.00 0.00 H
ATOM 10796 HD3 PRO A 678 54.293 91.783 117.019 1.00 0.00 H
ATOM 10797 N CYS A 679 58.617 93.906 114.562 1.00 0.00 N
ATOM 10798 CA CYS A 679 60.010 94.511 114.723 1.00 0.00 C
ATOM 10799 C CYS A 679 59.972 95.835 115.579 1.00 0.00 C
ATOM 10800 O CYS A 679 58.886 96.479 115.643 1.00 0.00 O
ATOM 10801 CB CYS A 679 60.617 94.728 113.412 1.00 0.00 C
ATOM 10802 SG CYS A 679 62.361 95.420 113.299 1.00 0.00 S
ATOM 10803 H CYS A 679 58.024 94.240 113.816 1.00 0.00 H
ATOM 10804 HA CYS A 679 60.438 93.742 115.366 1.00 0.00 H
ATOM 10805 HB2 CYS A 679 60.702 93.746 112.946 1.00 0.00 H
ATOM 10806 HB3 CYS A 679 59.967 95.331 112.778 1.00 0.00 H
ATOM 10807 HG CYS A 679 62.145 96.598 113.892 1.00 0.00 H
ATOM 10808 N LYS A 680 61.138 96.177 116.117 1.00 0.00 N
ATOM 10809 CA LYS A 680 61.238 97.299 117.020 1.00 0.00 C
ATOM 10810 C LYS A 680 61.140 98.673 116.291 1.00 0.00 C
ATOM 10811 O LYS A 680 62.130 99.073 115.604 1.00 0.00 O
ATOM 10812 CB LYS A 680 62.497 97.217 117.959 1.00 0.00 C
ATOM 10813 CG LYS A 680 62.772 98.291 118.986 1.00 0.00 C
ATOM 10814 CD LYS A 680 64.246 98.222 119.326 1.00 0.00 C
ATOM 10815 CE LYS A 680 64.622 99.341 120.375 1.00 0.00 C
ATOM 10816 NZ LYS A 680 66.059 99.399 120.639 1.00 0.00 N1+
ATOM 10817 H LYS A 680 61.876 95.496 116.226 1.00 0.00 H
ATOM 10818 HA LYS A 680 60.388 97.178 117.691 1.00 0.00 H
ATOM 10819 HB2 LYS A 680 62.402 96.265 118.482 1.00 0.00 H
ATOM 10820 HB3 LYS A 680 63.330 97.189 117.256 1.00 0.00 H
ATOM 10821 HG2 LYS A 680 62.536 99.322 118.721 1.00 0.00 H
ATOM 10822 HG3 LYS A 680 62.146 98.109 119.860 1.00 0.00 H
ATOM 10823 HD2 LYS A 680 64.386 97.281 119.859 1.00 0.00 H
ATOM 10824 HD3 LYS A 680 64.916 98.282 118.469 1.00 0.00 H
ATOM 10825 HE2 LYS A 680 64.243 100.338 120.152 1.00 0.00 H
ATOM 10826 HE3 LYS A 680 64.161 99.002 121.302 1.00 0.00 H
ATOM 10827 HZ1 LYS A 680 66.375 98.599 121.169 1.00 0.00 H
ATOM 10828 HZ2 LYS A 680 66.541 99.601 119.775 1.00 0.00 H
ATOM 10829 HZ3 LYS A 680 66.131 100.144 121.317 1.00 0.00 H
ATOM 10830 N GLY A 681 59.986 99.332 116.413 1.00 0.00 N
ATOM 10831 CA GLY A 681 59.870 100.655 115.751 1.00 0.00 C
ATOM 10832 C GLY A 681 59.651 100.636 114.268 1.00 0.00 C
ATOM 10833 O GLY A 681 59.860 101.568 113.572 1.00 0.00 O
ATOM 10834 H GLY A 681 59.298 99.061 117.101 1.00 0.00 H
ATOM 10835 HA2 GLY A 681 59.018 101.175 116.188 1.00 0.00 H
ATOM 10836 HA3 GLY A 681 60.765 101.258 115.907 1.00 0.00 H
ATOM 10837 N ARG A 682 59.244 99.496 113.659 1.00 0.00 N
ATOM 10838 CA ARG A 682 59.523 99.223 112.232 1.00 0.00 C
ATOM 10839 C ARG A 682 58.452 98.402 111.580 1.00 0.00 C
ATOM 10840 O ARG A 682 57.966 97.477 112.237 1.00 0.00 O
ATOM 10841 CB ARG A 682 60.859 98.626 111.922 1.00 0.00 C
ATOM 10842 CG ARG A 682 62.019 99.687 112.059 1.00 0.00 C
ATOM 10843 CD ARG A 682 63.325 99.051 111.697 1.00 0.00 C
ATOM 10844 NE ARG A 682 64.418 99.936 112.019 1.00 0.00 N
ATOM 10845 CZ ARG A 682 65.609 100.058 111.499 1.00 0.00 C
ATOM 10846 NH1 ARG A 682 65.926 99.444 110.379 1.00 0.00 N1+
ATOM 10847 NH2 ARG A 682 66.452 100.868 111.981 1.00 0.00 N
ATOM 10848 H ARG A 682 59.007 98.696 114.229 1.00 0.00 H
ATOM 10849 HA ARG A 682 59.534 100.170 111.693 1.00 0.00 H
ATOM 10850 HB2 ARG A 682 60.994 97.733 112.532 1.00 0.00 H
ATOM 10851 HB3 ARG A 682 60.976 98.316 110.884 1.00 0.00 H
ATOM 10852 HG2 ARG A 682 61.923 100.472 111.309 1.00 0.00 H
ATOM 10853 HG3 ARG A 682 61.955 100.074 113.076 1.00 0.00 H
ATOM 10854 HD2 ARG A 682 63.448 98.137 112.277 1.00 0.00 H
ATOM 10855 HD3 ARG A 682 63.460 98.829 110.638 1.00 0.00 H
ATOM 10856 HE ARG A 682 64.254 100.575 112.784 1.00 0.00 H
ATOM 10857 HH11 ARG A 682 65.300 98.827 109.881 1.00 0.00 H
ATOM 10858 HH12 ARG A 682 66.823 99.733 110.016 1.00 0.00 H
ATOM 10859 HH21 ARG A 682 66.244 101.526 112.718 1.00 0.00 H
ATOM 10860 HH22 ARG A 682 67.365 101.024 111.580 1.00 0.00 H
ATOM 10861 N ASP A 683 58.138 98.728 110.310 1.00 0.00 N
ATOM 10862 CA ASP A 683 57.078 98.202 109.470 1.00 0.00 C
ATOM 10863 C ASP A 683 57.313 96.773 109.022 1.00 0.00 C
ATOM 10864 O ASP A 683 57.299 96.366 107.863 1.00 0.00 O
ATOM 10865 CB ASP A 683 57.023 99.142 108.230 1.00 0.00 C
ATOM 10866 CG ASP A 683 55.668 98.839 107.504 1.00 0.00 C
ATOM 10867 OD1 ASP A 683 54.698 98.346 108.057 1.00 0.00 O
ATOM 10868 OD2 ASP A 683 55.656 99.174 106.298 1.00 0.00 O1-
ATOM 10869 H ASP A 683 58.714 99.454 109.908 1.00 0.00 H
ATOM 10870 HA ASP A 683 56.196 98.121 110.105 1.00 0.00 H
ATOM 10871 HB2 ASP A 683 57.145 100.160 108.600 1.00 0.00 H
ATOM 10872 HB3 ASP A 683 57.823 98.990 107.505 1.00 0.00 H
ATOM 10873 N ILE A 684 57.579 95.954 110.041 1.00 0.00 N
ATOM 10874 CA ILE A 684 58.029 94.610 109.871 1.00 0.00 C
ATOM 10875 C ILE A 684 57.350 93.813 110.936 1.00 0.00 C
ATOM 10876 O ILE A 684 57.380 94.215 112.139 1.00 0.00 O
ATOM 10877 CB ILE A 684 59.554 94.361 109.867 1.00 0.00 C
ATOM 10878 CG1 ILE A 684 60.164 95.195 108.745 1.00 0.00 C
ATOM 10879 CG2 ILE A 684 59.911 92.936 109.659 1.00 0.00 C
ATOM 10880 CD1 ILE A 684 61.614 95.446 109.070 1.00 0.00 C
ATOM 10881 H ILE A 684 57.476 96.286 110.990 1.00 0.00 H
ATOM 10882 HA ILE A 684 57.459 94.271 109.006 1.00 0.00 H
ATOM 10883 HB ILE A 684 60.046 94.661 110.792 1.00 0.00 H
ATOM 10884 HG12 ILE A 684 60.081 94.669 107.794 1.00 0.00 H
ATOM 10885 HG13 ILE A 684 59.801 96.202 108.544 1.00 0.00 H
ATOM 10886 HG21 ILE A 684 59.491 92.256 110.400 1.00 0.00 H
ATOM 10887 HG22 ILE A 684 59.427 92.686 108.715 1.00 0.00 H
ATOM 10888 HG23 ILE A 684 60.981 92.794 109.507 1.00 0.00 H
ATOM 10889 HD11 ILE A 684 61.835 96.233 108.349 1.00 0.00 H
ATOM 10890 HD12 ILE A 684 61.734 95.889 110.059 1.00 0.00 H
ATOM 10891 HD13 ILE A 684 62.332 94.647 108.887 1.00 0.00 H
ATOM 10892 N VAL A 685 56.680 92.689 110.559 1.00 0.00 N
ATOM 10893 CA VAL A 685 56.145 91.663 111.483 1.00 0.00 C
ATOM 10894 C VAL A 685 56.563 90.315 110.996 1.00 0.00 C
ATOM 10895 O VAL A 685 56.595 90.033 109.825 1.00 0.00 O
ATOM 10896 CB VAL A 685 54.643 91.829 111.676 1.00 0.00 C
ATOM 10897 CG1 VAL A 685 53.829 91.989 110.381 1.00 0.00 C
ATOM 10898 CG2 VAL A 685 54.033 90.636 112.508 1.00 0.00 C
ATOM 10899 H VAL A 685 56.658 92.513 109.565 1.00 0.00 H
ATOM 10900 HA VAL A 685 56.557 91.838 112.476 1.00 0.00 H
ATOM 10901 HB VAL A 685 54.518 92.697 112.324 1.00 0.00 H
ATOM 10902 HG11 VAL A 685 54.008 91.100 109.777 1.00 0.00 H
ATOM 10903 HG12 VAL A 685 52.763 92.204 110.457 1.00 0.00 H
ATOM 10904 HG13 VAL A 685 54.202 92.830 109.796 1.00 0.00 H
ATOM 10905 HG21 VAL A 685 54.787 90.317 113.228 1.00 0.00 H
ATOM 10906 HG22 VAL A 685 53.080 90.988 112.902 1.00 0.00 H
ATOM 10907 HG23 VAL A 685 53.757 89.774 111.901 1.00 0.00 H
ATOM 10908 N ILE A 686 56.907 89.413 111.917 1.00 0.00 N
ATOM 10909 CA ILE A 686 57.139 88.005 111.705 1.00 0.00 C
ATOM 10910 C ILE A 686 55.902 87.278 112.320 1.00 0.00 C
ATOM 10911 O ILE A 686 55.380 87.681 113.309 1.00 0.00 O
ATOM 10912 CB ILE A 686 58.440 87.686 112.350 1.00 0.00 C
ATOM 10913 CG1 ILE A 686 59.608 88.831 112.117 1.00 0.00 C
ATOM 10914 CG2 ILE A 686 58.978 86.380 111.902 1.00 0.00 C
ATOM 10915 CD1 ILE A 686 59.591 90.282 112.602 1.00 0.00 C
ATOM 10916 H ILE A 686 56.853 89.725 112.876 1.00 0.00 H
ATOM 10917 HA ILE A 686 57.162 87.747 110.646 1.00 0.00 H
ATOM 10918 HB ILE A 686 58.290 87.710 113.429 1.00 0.00 H
ATOM 10919 HG12 ILE A 686 60.468 88.362 112.594 1.00 0.00 H
ATOM 10920 HG13 ILE A 686 59.864 88.801 111.058 1.00 0.00 H
ATOM 10921 HG21 ILE A 686 59.521 85.998 112.767 1.00 0.00 H
ATOM 10922 HG22 ILE A 686 58.168 85.677 111.706 1.00 0.00 H
ATOM 10923 HG23 ILE A 686 59.627 86.432 111.028 1.00 0.00 H
ATOM 10924 HD11 ILE A 686 60.563 90.724 112.385 1.00 0.00 H
ATOM 10925 HD12 ILE A 686 58.863 90.906 112.084 1.00 0.00 H
ATOM 10926 HD13 ILE A 686 59.480 90.445 113.674 1.00 0.00 H
ATOM 10927 N ILE A 687 55.576 86.141 111.750 1.00 0.00 N
ATOM 10928 CA ILE A 687 54.583 85.102 112.287 1.00 0.00 C
ATOM 10929 C ILE A 687 55.223 83.675 112.242 1.00 0.00 C
ATOM 10930 O ILE A 687 55.971 83.308 111.329 1.00 0.00 O
ATOM 10931 CB ILE A 687 53.330 85.262 111.507 1.00 0.00 C
ATOM 10932 CG1 ILE A 687 52.726 86.686 111.362 1.00 0.00 C
ATOM 10933 CG2 ILE A 687 52.079 84.330 111.885 1.00 0.00 C
ATOM 10934 CD1 ILE A 687 53.329 87.425 110.100 1.00 0.00 C
ATOM 10935 H ILE A 687 56.045 85.810 110.919 1.00 0.00 H
ATOM 10936 HA ILE A 687 54.335 85.291 113.332 1.00 0.00 H
ATOM 10937 HB ILE A 687 53.600 84.842 110.538 1.00 0.00 H
ATOM 10938 HG12 ILE A 687 51.656 86.687 111.151 1.00 0.00 H
ATOM 10939 HG13 ILE A 687 53.033 87.314 112.198 1.00 0.00 H
ATOM 10940 HG21 ILE A 687 51.816 84.709 112.872 1.00 0.00 H
ATOM 10941 HG22 ILE A 687 51.221 84.405 111.217 1.00 0.00 H
ATOM 10942 HG23 ILE A 687 52.397 83.289 111.939 1.00 0.00 H
ATOM 10943 HD11 ILE A 687 54.407 87.524 109.966 1.00 0.00 H
ATOM 10944 HD12 ILE A 687 52.962 86.945 109.193 1.00 0.00 H
ATOM 10945 HD13 ILE A 687 52.926 88.438 110.080 1.00 0.00 H
ATOM 10946 N ARG A 688 54.859 82.762 113.125 1.00 0.00 N
ATOM 10947 CA ARG A 688 55.187 81.343 113.190 1.00 0.00 C
ATOM 10948 C ARG A 688 53.907 80.517 113.066 1.00 0.00 C
ATOM 10949 O ARG A 688 53.064 80.565 113.834 1.00 0.00 O
ATOM 10950 CB ARG A 688 55.978 81.012 114.461 1.00 0.00 C
ATOM 10951 CG ARG A 688 56.451 79.551 114.669 1.00 0.00 C
ATOM 10952 CD ARG A 688 55.681 78.753 115.719 1.00 0.00 C
ATOM 10953 NE ARG A 688 56.456 77.579 116.204 1.00 0.00 N
ATOM 10954 CZ ARG A 688 57.558 77.604 116.975 1.00 0.00 C
ATOM 10955 NH1 ARG A 688 57.920 78.723 117.552 1.00 0.00 N1+
ATOM 10956 NH2 ARG A 688 58.165 76.441 117.263 1.00 0.00 N
ATOM 10957 H ARG A 688 54.130 83.112 113.730 1.00 0.00 H
ATOM 10958 HA ARG A 688 55.790 81.047 112.331 1.00 0.00 H
ATOM 10959 HB2 ARG A 688 56.943 81.521 114.471 1.00 0.00 H
ATOM 10960 HB3 ARG A 688 55.360 81.340 115.296 1.00 0.00 H
ATOM 10961 HG2 ARG A 688 56.479 79.041 113.707 1.00 0.00 H
ATOM 10962 HG3 ARG A 688 57.474 79.588 115.045 1.00 0.00 H
ATOM 10963 HD2 ARG A 688 55.461 79.338 116.612 1.00 0.00 H
ATOM 10964 HD3 ARG A 688 54.728 78.390 115.332 1.00 0.00 H
ATOM 10965 HE ARG A 688 56.140 76.688 115.849 1.00 0.00 H
ATOM 10966 HH11 ARG A 688 57.495 79.605 117.301 1.00 0.00 H
ATOM 10967 HH12 ARG A 688 58.704 78.648 118.185 1.00 0.00 H
ATOM 10968 HH21 ARG A 688 57.885 75.518 116.963 1.00 0.00 H
ATOM 10969 HH22 ARG A 688 58.993 76.510 117.837 1.00 0.00 H
ATOM 10970 N LEU A 689 53.774 79.884 111.944 1.00 0.00 N
ATOM 10971 CA LEU A 689 52.494 79.167 111.505 1.00 0.00 C
ATOM 10972 C LEU A 689 52.435 77.777 112.299 1.00 0.00 C
ATOM 10973 O LEU A 689 53.473 77.278 112.810 1.00 0.00 O
ATOM 10974 CB LEU A 689 52.657 78.977 109.982 1.00 0.00 C
ATOM 10975 CG LEU A 689 52.738 80.345 109.325 1.00 0.00 C
ATOM 10976 CD1 LEU A 689 53.033 80.143 107.858 1.00 0.00 C
ATOM 10977 CD2 LEU A 689 51.456 81.184 109.551 1.00 0.00 C
ATOM 10978 H LEU A 689 54.556 79.669 111.341 1.00 0.00 H
ATOM 10979 HA LEU A 689 51.580 79.729 111.698 1.00 0.00 H
ATOM 10980 HB2 LEU A 689 53.519 78.390 109.666 1.00 0.00 H
ATOM 10981 HB3 LEU A 689 51.836 78.382 109.581 1.00 0.00 H
ATOM 10982 HG LEU A 689 53.455 81.056 109.736 1.00 0.00 H
ATOM 10983 HD11 LEU A 689 52.472 79.264 107.541 1.00 0.00 H
ATOM 10984 HD12 LEU A 689 52.867 80.987 107.189 1.00 0.00 H
ATOM 10985 HD13 LEU A 689 54.113 79.995 107.838 1.00 0.00 H
ATOM 10986 HD21 LEU A 689 51.588 82.098 108.973 1.00 0.00 H
ATOM 10987 HD22 LEU A 689 50.612 80.687 109.073 1.00 0.00 H
ATOM 10988 HD23 LEU A 689 51.344 81.473 110.596 1.00 0.00 H
ATOM 10989 N PRO A 690 51.284 77.067 112.354 1.00 0.00 N
ATOM 10990 CA PRO A 690 51.137 75.768 113.022 1.00 0.00 C
ATOM 10991 C PRO A 690 51.958 74.738 112.246 1.00 0.00 C
ATOM 10992 O PRO A 690 52.293 74.915 111.073 1.00 0.00 O
ATOM 10993 CB PRO A 690 49.660 75.307 113.003 1.00 0.00 C
ATOM 10994 CG PRO A 690 49.066 76.302 111.994 1.00 0.00 C
ATOM 10995 CD PRO A 690 49.964 77.534 111.989 1.00 0.00 C
ATOM 10996 HA PRO A 690 51.512 75.752 114.046 1.00 0.00 H
ATOM 10997 HB2 PRO A 690 49.571 74.254 112.736 1.00 0.00 H
ATOM 10998 HB3 PRO A 690 49.136 75.530 113.933 1.00 0.00 H
ATOM 10999 HG2 PRO A 690 49.015 75.849 111.004 1.00 0.00 H
ATOM 11000 HG3 PRO A 690 48.064 76.624 112.279 1.00 0.00 H
ATOM 11001 HD2 PRO A 690 49.993 77.928 110.973 1.00 0.00 H
ATOM 11002 HD3 PRO A 690 49.594 78.269 112.704 1.00 0.00 H
ATOM 11003 N LYS A 691 52.136 73.517 112.799 1.00 0.00 N
ATOM 11004 CA LYS A 691 52.905 72.403 112.138 1.00 0.00 C
ATOM 11005 C LYS A 691 52.307 71.860 110.851 1.00 0.00 C
ATOM 11006 O LYS A 691 52.954 71.205 110.064 1.00 0.00 O
ATOM 11007 CB LYS A 691 53.129 71.230 113.153 1.00 0.00 C
ATOM 11008 CG LYS A 691 52.020 70.153 113.413 1.00 0.00 C
ATOM 11009 CD LYS A 691 52.524 69.192 114.510 1.00 0.00 C
ATOM 11010 CE LYS A 691 51.575 68.002 114.529 1.00 0.00 C
ATOM 11011 NZ LYS A 691 51.515 67.171 113.229 1.00 0.00 N1+
ATOM 11012 H LYS A 691 51.570 73.295 113.606 1.00 0.00 H
ATOM 11013 HA LYS A 691 53.936 72.684 111.923 1.00 0.00 H
ATOM 11014 HB2 LYS A 691 53.898 70.589 112.722 1.00 0.00 H
ATOM 11015 HB3 LYS A 691 53.366 71.697 114.108 1.00 0.00 H
ATOM 11016 HG2 LYS A 691 51.172 70.775 113.699 1.00 0.00 H
ATOM 11017 HG3 LYS A 691 51.687 69.619 112.523 1.00 0.00 H
ATOM 11018 HD2 LYS A 691 53.549 68.900 114.282 1.00 0.00 H
ATOM 11019 HD3 LYS A 691 52.519 69.719 115.464 1.00 0.00 H
ATOM 11020 HE2 LYS A 691 51.870 67.398 115.387 1.00 0.00 H
ATOM 11021 HE3 LYS A 691 50.651 68.427 114.924 1.00 0.00 H
ATOM 11022 HZ1 LYS A 691 51.012 67.671 112.510 1.00 0.00 H
ATOM 11023 HZ2 LYS A 691 52.448 66.949 112.914 1.00 0.00 H
ATOM 11024 HZ3 LYS A 691 50.973 66.370 113.520 1.00 0.00 H
ATOM 11025 N ASP A 692 51.000 72.176 110.609 1.00 0.00 N
ATOM 11026 CA ASP A 692 50.119 71.647 109.576 1.00 0.00 C
ATOM 11027 C ASP A 692 50.538 72.325 108.300 1.00 0.00 C
ATOM 11028 O ASP A 692 50.313 71.724 107.210 1.00 0.00 O
ATOM 11029 CB ASP A 692 48.593 72.006 109.874 1.00 0.00 C
ATOM 11030 CG ASP A 692 48.028 71.418 111.158 1.00 0.00 C
ATOM 11031 OD1 ASP A 692 46.809 71.152 111.190 1.00 0.00 O
ATOM 11032 OD2 ASP A 692 48.753 71.250 112.136 1.00 0.00 O1-
ATOM 11033 H ASP A 692 50.571 72.779 111.296 1.00 0.00 H
ATOM 11034 HA ASP A 692 50.209 70.563 109.514 1.00 0.00 H
ATOM 11035 HB2 ASP A 692 48.516 73.082 110.031 1.00 0.00 H
ATOM 11036 HB3 ASP A 692 47.909 71.892 109.033 1.00 0.00 H
ATOM 11037 N PHE A 693 51.075 73.569 108.390 1.00 0.00 N
ATOM 11038 CA PHE A 693 51.595 74.324 107.226 1.00 0.00 C
ATOM 11039 C PHE A 693 52.940 73.718 106.635 1.00 0.00 C
ATOM 11040 O PHE A 693 53.922 73.420 107.330 1.00 0.00 O
ATOM 11041 CB PHE A 693 51.672 75.792 107.632 1.00 0.00 C
ATOM 11042 CG PHE A 693 52.205 76.589 106.467 1.00 0.00 C
ATOM 11043 CD1 PHE A 693 53.582 77.013 106.424 1.00 0.00 C
ATOM 11044 CD2 PHE A 693 51.328 77.026 105.466 1.00 0.00 C
ATOM 11045 CE1 PHE A 693 53.908 77.966 105.436 1.00 0.00 C
ATOM 11046 CE2 PHE A 693 51.691 77.812 104.419 1.00 0.00 C
ATOM 11047 CZ PHE A 693 52.950 78.338 104.436 1.00 0.00 C
ATOM 11048 H PHE A 693 51.307 73.938 109.301 1.00 0.00 H
ATOM 11049 HA PHE A 693 50.725 74.140 106.596 1.00 0.00 H
ATOM 11050 HB2 PHE A 693 50.736 76.236 107.971 1.00 0.00 H
ATOM 11051 HB3 PHE A 693 52.455 75.845 108.388 1.00 0.00 H
ATOM 11052 HD1 PHE A 693 54.323 76.817 107.184 1.00 0.00 H
ATOM 11053 HD2 PHE A 693 50.301 76.690 105.469 1.00 0.00 H
ATOM 11054 HE1 PHE A 693 54.903 78.386 105.416 1.00 0.00 H
ATOM 11055 HE2 PHE A 693 51.011 78.161 103.655 1.00 0.00 H
ATOM 11056 HZ PHE A 693 53.170 79.027 103.635 1.00 0.00 H
ATOM 11057 N PRO A 694 52.961 73.417 105.312 1.00 0.00 N
ATOM 11058 CA PRO A 694 54.199 73.069 104.673 1.00 0.00 C
ATOM 11059 C PRO A 694 55.348 74.071 104.876 1.00 0.00 C
ATOM 11060 O PRO A 694 55.210 75.197 104.388 1.00 0.00 O
ATOM 11061 CB PRO A 694 53.814 72.908 103.188 1.00 0.00 C
ATOM 11062 CG PRO A 694 52.243 72.711 103.226 1.00 0.00 C
ATOM 11063 CD PRO A 694 51.920 73.595 104.320 1.00 0.00 C
ATOM 11064 HA PRO A 694 54.479 72.119 105.130 1.00 0.00 H
ATOM 11065 HB2 PRO A 694 54.160 73.800 102.666 1.00 0.00 H
ATOM 11066 HB3 PRO A 694 54.299 72.084 102.665 1.00 0.00 H
ATOM 11067 HG2 PRO A 694 51.717 72.980 102.310 1.00 0.00 H
ATOM 11068 HG3 PRO A 694 52.156 71.702 103.629 1.00 0.00 H
ATOM 11069 HD2 PRO A 694 51.911 74.661 104.093 1.00 0.00 H
ATOM 11070 HD3 PRO A 694 50.915 73.379 104.681 1.00 0.00 H
ATOM 11071 N PRO A 695 56.488 73.677 105.552 1.00 0.00 N
ATOM 11072 CA PRO A 695 57.634 74.543 105.910 1.00 0.00 C
ATOM 11073 C PRO A 695 58.533 75.004 104.650 1.00 0.00 C
ATOM 11074 O PRO A 695 59.001 74.165 103.865 1.00 0.00 O
ATOM 11075 CB PRO A 695 58.402 73.788 106.905 1.00 0.00 C
ATOM 11076 CG PRO A 695 58.308 72.366 106.558 1.00 0.00 C
ATOM 11077 CD PRO A 695 56.830 72.333 106.039 1.00 0.00 C
ATOM 11078 HA PRO A 695 57.228 75.417 106.418 1.00 0.00 H
ATOM 11079 HB2 PRO A 695 59.437 74.117 107.000 1.00 0.00 H
ATOM 11080 HB3 PRO A 695 57.990 74.050 107.879 1.00 0.00 H
ATOM 11081 HG2 PRO A 695 58.975 72.219 105.709 1.00 0.00 H
ATOM 11082 HG3 PRO A 695 58.635 71.729 107.380 1.00 0.00 H
ATOM 11083 HD2 PRO A 695 56.754 71.620 105.218 1.00 0.00 H
ATOM 11084 HD3 PRO A 695 56.117 72.010 106.798 1.00 0.00 H
ATOM 11085 N PHE A 696 58.958 76.286 104.537 1.00 0.00 N
ATOM 11086 CA PHE A 696 59.858 76.761 103.534 1.00 0.00 C
ATOM 11087 C PHE A 696 61.214 76.205 103.847 1.00 0.00 C
ATOM 11088 O PHE A 696 61.519 75.714 104.918 1.00 0.00 O
ATOM 11089 CB PHE A 696 59.863 78.331 103.610 1.00 0.00 C
ATOM 11090 CG PHE A 696 58.552 78.966 103.061 1.00 0.00 C
ATOM 11091 CD1 PHE A 696 58.290 78.859 101.672 1.00 0.00 C
ATOM 11092 CD2 PHE A 696 57.601 79.463 103.931 1.00 0.00 C
ATOM 11093 CE1 PHE A 696 57.151 79.493 101.092 1.00 0.00 C
ATOM 11094 CE2 PHE A 696 56.411 80.047 103.382 1.00 0.00 C
ATOM 11095 CZ PHE A 696 56.245 80.158 101.998 1.00 0.00 C
ATOM 11096 H PHE A 696 58.598 76.934 105.223 1.00 0.00 H
ATOM 11097 HA PHE A 696 59.561 76.417 102.543 1.00 0.00 H
ATOM 11098 HB2 PHE A 696 59.902 78.621 104.660 1.00 0.00 H
ATOM 11099 HB3 PHE A 696 60.729 78.779 103.123 1.00 0.00 H
ATOM 11100 HD1 PHE A 696 59.037 78.492 100.984 1.00 0.00 H
ATOM 11101 HD2 PHE A 696 57.782 79.375 104.992 1.00 0.00 H
ATOM 11102 HE1 PHE A 696 57.134 79.660 100.025 1.00 0.00 H
ATOM 11103 HE2 PHE A 696 55.639 80.467 104.010 1.00 0.00 H
ATOM 11104 HZ PHE A 696 55.324 80.585 101.629 1.00 0.00 H
ATOM 11105 N PRO A 697 62.161 76.115 102.850 1.00 0.00 N
ATOM 11106 CA PRO A 697 63.504 75.796 103.156 1.00 0.00 C
ATOM 11107 C PRO A 697 64.218 76.966 103.825 1.00 0.00 C
ATOM 11108 O PRO A 697 63.754 78.141 103.882 1.00 0.00 O
ATOM 11109 CB PRO A 697 64.145 75.424 101.797 1.00 0.00 C
ATOM 11110 CG PRO A 697 63.544 76.374 100.847 1.00 0.00 C
ATOM 11111 CD PRO A 697 62.113 76.667 101.521 1.00 0.00 C
ATOM 11112 HA PRO A 697 63.544 74.913 103.794 1.00 0.00 H
ATOM 11113 HB2 PRO A 697 65.229 75.539 101.813 1.00 0.00 H
ATOM 11114 HB3 PRO A 697 63.913 74.396 101.518 1.00 0.00 H
ATOM 11115 HG2 PRO A 697 64.170 77.264 100.911 1.00 0.00 H
ATOM 11116 HG3 PRO A 697 63.446 75.919 99.862 1.00 0.00 H
ATOM 11117 HD2 PRO A 697 61.834 77.705 101.706 1.00 0.00 H
ATOM 11118 HD3 PRO A 697 61.337 76.172 100.937 1.00 0.00 H
ATOM 11119 N ARG A 698 65.382 76.609 104.432 1.00 0.00 N
ATOM 11120 CA ARG A 698 66.076 77.555 105.322 1.00 0.00 C
ATOM 11121 C ARG A 698 67.421 78.129 104.689 1.00 0.00 C
ATOM 11122 O ARG A 698 68.381 78.343 105.382 1.00 0.00 O
ATOM 11123 CB ARG A 698 66.334 76.923 106.719 1.00 0.00 C
ATOM 11124 CG ARG A 698 64.969 76.892 107.463 1.00 0.00 C
ATOM 11125 CD ARG A 698 65.100 76.319 108.863 1.00 0.00 C
ATOM 11126 NE ARG A 698 65.058 74.855 108.860 1.00 0.00 N
ATOM 11127 CZ ARG A 698 65.415 74.121 109.863 1.00 0.00 C
ATOM 11128 NH1 ARG A 698 65.848 74.733 110.961 1.00 0.00 N1+
ATOM 11129 NH2 ARG A 698 65.104 72.870 109.873 1.00 0.00 N
ATOM 11130 H ARG A 698 65.552 75.631 104.617 1.00 0.00 H
ATOM 11131 HA ARG A 698 65.673 78.553 105.496 1.00 0.00 H
ATOM 11132 HB2 ARG A 698 66.760 75.928 106.588 1.00 0.00 H
ATOM 11133 HB3 ARG A 698 67.016 77.534 107.310 1.00 0.00 H
ATOM 11134 HG2 ARG A 698 64.609 77.920 107.421 1.00 0.00 H
ATOM 11135 HG3 ARG A 698 64.240 76.276 106.936 1.00 0.00 H
ATOM 11136 HD2 ARG A 698 65.910 76.725 109.469 1.00 0.00 H
ATOM 11137 HD3 ARG A 698 64.251 76.705 109.426 1.00 0.00 H
ATOM 11138 HE ARG A 698 64.712 74.387 108.034 1.00 0.00 H
ATOM 11139 HH11 ARG A 698 65.600 75.694 111.148 1.00 0.00 H
ATOM 11140 HH12 ARG A 698 66.063 74.106 111.723 1.00 0.00 H
ATOM 11141 HH21 ARG A 698 64.624 72.389 109.125 1.00 0.00 H
ATOM 11142 HH22 ARG A 698 65.651 72.280 110.484 1.00 0.00 H
ATOM 11143 N ARG A 699 67.455 78.203 103.354 1.00 0.00 N
ATOM 11144 CA ARG A 699 68.639 78.779 102.661 1.00 0.00 C
ATOM 11145 C ARG A 699 68.987 80.252 102.719 1.00 0.00 C
ATOM 11146 O ARG A 699 70.180 80.514 102.414 1.00 0.00 O
ATOM 11147 CB ARG A 699 68.509 78.308 101.140 1.00 0.00 C
ATOM 11148 CG ARG A 699 67.420 78.874 100.211 1.00 0.00 C
ATOM 11149 CD ARG A 699 67.477 78.216 98.827 1.00 0.00 C
ATOM 11150 NE ARG A 699 67.278 76.702 98.877 1.00 0.00 N
ATOM 11151 CZ ARG A 699 66.699 75.965 97.940 1.00 0.00 C
ATOM 11152 NH1 ARG A 699 66.056 76.361 96.848 1.00 0.00 N1+
ATOM 11153 NH2 ARG A 699 66.570 74.701 98.140 1.00 0.00 N
ATOM 11154 H ARG A 699 66.547 78.205 102.910 1.00 0.00 H
ATOM 11155 HA ARG A 699 69.508 78.374 103.179 1.00 0.00 H
ATOM 11156 HB2 ARG A 699 69.462 78.462 100.635 1.00 0.00 H
ATOM 11157 HB3 ARG A 699 68.606 77.228 101.250 1.00 0.00 H
ATOM 11158 HG2 ARG A 699 66.386 78.731 100.523 1.00 0.00 H
ATOM 11159 HG3 ARG A 699 67.688 79.929 100.167 1.00 0.00 H
ATOM 11160 HD2 ARG A 699 66.574 78.459 98.266 1.00 0.00 H
ATOM 11161 HD3 ARG A 699 68.387 78.538 98.321 1.00 0.00 H
ATOM 11162 HE ARG A 699 67.840 76.175 99.530 1.00 0.00 H
ATOM 11163 HH11 ARG A 699 66.287 77.283 96.508 1.00 0.00 H
ATOM 11164 HH12 ARG A 699 65.469 75.717 96.337 1.00 0.00 H
ATOM 11165 HH21 ARG A 699 66.833 74.499 99.094 1.00 0.00 H
ATOM 11166 HH22 ARG A 699 65.875 74.191 97.613 1.00 0.00 H
ATOM 11167 N LEU A 700 68.048 81.198 103.021 1.00 0.00 N
ATOM 11168 CA LEU A 700 68.183 82.656 102.897 1.00 0.00 C
ATOM 11169 C LEU A 700 69.340 83.210 103.817 1.00 0.00 C
ATOM 11170 O LEU A 700 69.949 82.549 104.614 1.00 0.00 O
ATOM 11171 CB LEU A 700 66.856 83.310 103.211 1.00 0.00 C
ATOM 11172 CG LEU A 700 65.707 82.975 102.166 1.00 0.00 C
ATOM 11173 CD1 LEU A 700 64.370 83.148 102.939 1.00 0.00 C
ATOM 11174 CD2 LEU A 700 65.808 83.839 100.968 1.00 0.00 C
ATOM 11175 H LEU A 700 67.151 80.804 103.268 1.00 0.00 H
ATOM 11176 HA LEU A 700 68.442 82.888 101.864 1.00 0.00 H
ATOM 11177 HB2 LEU A 700 66.501 83.003 104.195 1.00 0.00 H
ATOM 11178 HB3 LEU A 700 66.926 84.397 103.248 1.00 0.00 H
ATOM 11179 HG LEU A 700 65.889 81.967 101.793 1.00 0.00 H
ATOM 11180 HD11 LEU A 700 63.531 83.194 102.244 1.00 0.00 H
ATOM 11181 HD12 LEU A 700 64.124 82.320 103.604 1.00 0.00 H
ATOM 11182 HD13 LEU A 700 64.342 84.138 103.395 1.00 0.00 H
ATOM 11183 HD21 LEU A 700 66.691 83.518 100.416 1.00 0.00 H
ATOM 11184 HD22 LEU A 700 64.899 83.827 100.365 1.00 0.00 H
ATOM 11185 HD23 LEU A 700 65.842 84.896 101.233 1.00 0.00 H
ATOM 11186 N GLN A 701 69.620 84.450 103.499 1.00 0.00 N
ATOM 11187 CA GLN A 701 70.796 85.261 104.004 1.00 0.00 C
ATOM 11188 C GLN A 701 70.303 86.709 104.099 1.00 0.00 C
ATOM 11189 O GLN A 701 69.603 87.154 103.166 1.00 0.00 O
ATOM 11190 CB GLN A 701 71.990 85.097 103.011 1.00 0.00 C
ATOM 11191 CG GLN A 701 73.204 85.954 103.279 1.00 0.00 C
ATOM 11192 CD GLN A 701 74.106 85.961 102.108 1.00 0.00 C
ATOM 11193 NE2 GLN A 701 74.429 86.998 101.417 1.00 0.00 N
ATOM 11194 OE1 GLN A 701 74.523 84.846 101.684 1.00 0.00 O
ATOM 11195 H GLN A 701 68.911 84.987 103.021 1.00 0.00 H
ATOM 11196 HA GLN A 701 71.076 84.821 104.961 1.00 0.00 H
ATOM 11197 HB2 GLN A 701 72.297 84.051 103.007 1.00 0.00 H
ATOM 11198 HB3 GLN A 701 71.649 85.370 102.012 1.00 0.00 H
ATOM 11199 HG2 GLN A 701 72.882 86.940 103.613 1.00 0.00 H
ATOM 11200 HG3 GLN A 701 73.706 85.527 104.148 1.00 0.00 H
ATOM 11201 HE21 GLN A 701 74.983 86.930 100.575 1.00 0.00 H
ATOM 11202 HE22 GLN A 701 74.004 87.888 101.634 1.00 0.00 H
ATOM 11203 N PHE A 702 70.588 87.340 105.210 1.00 0.00 N
ATOM 11204 CA PHE A 702 70.023 88.706 105.458 1.00 0.00 C
ATOM 11205 C PHE A 702 71.030 89.684 105.960 1.00 0.00 C
ATOM 11206 O PHE A 702 71.969 89.287 106.617 1.00 0.00 O
ATOM 11207 CB PHE A 702 68.766 88.579 106.330 1.00 0.00 C
ATOM 11208 CG PHE A 702 67.819 87.447 105.993 1.00 0.00 C
ATOM 11209 CD1 PHE A 702 68.042 86.148 106.502 1.00 0.00 C
ATOM 11210 CD2 PHE A 702 66.517 87.678 105.584 1.00 0.00 C
ATOM 11211 CE1 PHE A 702 67.186 85.092 106.380 1.00 0.00 C
ATOM 11212 CE2 PHE A 702 65.570 86.610 105.521 1.00 0.00 C
ATOM 11213 CZ PHE A 702 65.932 85.294 105.754 1.00 0.00 C
ATOM 11214 H PHE A 702 71.072 86.819 105.928 1.00 0.00 H
ATOM 11215 HA PHE A 702 69.704 89.144 104.512 1.00 0.00 H
ATOM 11216 HB2 PHE A 702 69.131 88.411 107.344 1.00 0.00 H
ATOM 11217 HB3 PHE A 702 68.146 89.474 106.296 1.00 0.00 H
ATOM 11218 HD1 PHE A 702 69.004 86.055 106.984 1.00 0.00 H
ATOM 11219 HD2 PHE A 702 66.157 88.652 105.287 1.00 0.00 H
ATOM 11220 HE1 PHE A 702 67.382 84.121 106.812 1.00 0.00 H
ATOM 11221 HE2 PHE A 702 64.629 86.791 105.024 1.00 0.00 H
ATOM 11222 HZ PHE A 702 65.192 84.510 105.695 1.00 0.00 H
ATOM 11223 N ARG A 703 70.870 91.043 105.700 1.00 0.00 N
ATOM 11224 CA ARG A 703 71.572 92.027 106.552 1.00 0.00 C
ATOM 11225 C ARG A 703 70.874 93.406 106.508 1.00 0.00 C
ATOM 11226 O ARG A 703 69.950 93.511 105.698 1.00 0.00 O
ATOM 11227 CB ARG A 703 73.076 92.184 106.161 1.00 0.00 C
ATOM 11228 CG ARG A 703 73.345 92.802 104.837 1.00 0.00 C
ATOM 11229 CD ARG A 703 74.833 93.162 104.527 1.00 0.00 C
ATOM 11230 NE ARG A 703 74.991 93.205 103.070 1.00 0.00 N
ATOM 11231 CZ ARG A 703 74.650 94.189 102.280 1.00 0.00 C
ATOM 11232 NH1 ARG A 703 74.320 95.328 102.795 1.00 0.00 N1+
ATOM 11233 NH2 ARG A 703 74.537 94.016 100.989 1.00 0.00 N
ATOM 11234 H ARG A 703 70.028 91.308 105.211 1.00 0.00 H
ATOM 11235 HA ARG A 703 71.520 91.702 107.591 1.00 0.00 H
ATOM 11236 HB2 ARG A 703 73.322 92.787 107.035 1.00 0.00 H
ATOM 11237 HB3 ARG A 703 73.714 91.326 106.371 1.00 0.00 H
ATOM 11238 HG2 ARG A 703 73.045 92.200 103.980 1.00 0.00 H
ATOM 11239 HG3 ARG A 703 72.735 93.695 104.702 1.00 0.00 H
ATOM 11240 HD2 ARG A 703 75.135 94.060 105.065 1.00 0.00 H
ATOM 11241 HD3 ARG A 703 75.481 92.335 104.815 1.00 0.00 H
ATOM 11242 HE ARG A 703 75.354 92.375 102.623 1.00 0.00 H
ATOM 11243 HH11 ARG A 703 74.186 95.283 103.795 1.00 0.00 H
ATOM 11244 HH12 ARG A 703 74.082 96.135 102.237 1.00 0.00 H
ATOM 11245 HH21 ARG A 703 74.890 93.114 100.703 1.00 0.00 H
ATOM 11246 HH22 ARG A 703 74.334 94.769 100.347 1.00 0.00 H
ATOM 11247 N THR A 704 71.280 94.411 107.308 1.00 0.00 N
ATOM 11248 CA THR A 704 70.783 95.754 107.146 1.00 0.00 C
ATOM 11249 C THR A 704 71.475 96.350 105.850 1.00 0.00 C
ATOM 11250 O THR A 704 72.638 95.988 105.559 1.00 0.00 O
ATOM 11251 CB THR A 704 71.114 96.503 108.435 1.00 0.00 C
ATOM 11252 CG2 THR A 704 72.686 96.477 108.737 1.00 0.00 C
ATOM 11253 OG1 THR A 704 70.604 97.741 108.314 1.00 0.00 O
ATOM 11254 H THR A 704 71.930 94.112 108.020 1.00 0.00 H
ATOM 11255 HA THR A 704 69.721 95.707 106.904 1.00 0.00 H
ATOM 11256 HB THR A 704 70.649 95.881 109.200 1.00 0.00 H
ATOM 11257 HG1 THR A 704 69.644 97.715 108.314 1.00 0.00 H
ATOM 11258 HG21 THR A 704 73.062 95.459 108.836 1.00 0.00 H
ATOM 11259 HG22 THR A 704 73.282 96.875 107.915 1.00 0.00 H
ATOM 11260 HG23 THR A 704 73.057 97.007 109.614 1.00 0.00 H
ATOM 11261 N PRO A 705 70.719 97.101 105.023 1.00 0.00 N
ATOM 11262 CA PRO A 705 71.201 97.801 103.821 1.00 0.00 C
ATOM 11263 C PRO A 705 72.266 98.915 104.193 1.00 0.00 C
ATOM 11264 O PRO A 705 72.522 99.284 105.338 1.00 0.00 O
ATOM 11265 CB PRO A 705 69.971 98.510 103.177 1.00 0.00 C
ATOM 11266 CG PRO A 705 68.987 98.586 104.301 1.00 0.00 C
ATOM 11267 CD PRO A 705 69.359 97.491 105.199 1.00 0.00 C
ATOM 11268 HA PRO A 705 71.668 97.104 103.126 1.00 0.00 H
ATOM 11269 HB2 PRO A 705 70.219 99.491 102.772 1.00 0.00 H
ATOM 11270 HB3 PRO A 705 69.515 97.965 102.350 1.00 0.00 H
ATOM 11271 HG2 PRO A 705 69.061 99.532 104.839 1.00 0.00 H
ATOM 11272 HG3 PRO A 705 68.012 98.444 103.836 1.00 0.00 H
ATOM 11273 HD2 PRO A 705 69.116 97.676 106.246 1.00 0.00 H
ATOM 11274 HD3 PRO A 705 68.872 96.575 104.865 1.00 0.00 H
ATOM 11275 N THR A 706 72.920 99.486 103.188 1.00 0.00 N
ATOM 11276 CA THR A 706 73.992 100.507 103.279 1.00 0.00 C
ATOM 11277 C THR A 706 74.078 101.421 102.079 1.00 0.00 C
ATOM 11278 O THR A 706 73.523 101.143 100.985 1.00 0.00 O
ATOM 11279 CB THR A 706 75.277 99.800 103.556 1.00 0.00 C
ATOM 11280 CG2 THR A 706 75.381 98.956 104.849 1.00 0.00 C
ATOM 11281 OG1 THR A 706 75.575 98.897 102.491 1.00 0.00 O
ATOM 11282 H THR A 706 72.724 99.230 102.231 1.00 0.00 H
ATOM 11283 HA THR A 706 73.805 101.088 104.182 1.00 0.00 H
ATOM 11284 HB THR A 706 76.116 100.496 103.539 1.00 0.00 H
ATOM 11285 HG1 THR A 706 74.829 98.351 102.233 1.00 0.00 H
ATOM 11286 HG21 THR A 706 75.091 99.652 105.636 1.00 0.00 H
ATOM 11287 HG22 THR A 706 74.717 98.094 104.790 1.00 0.00 H
ATOM 11288 HG23 THR A 706 76.402 98.592 104.969 1.00 0.00 H
ATOM 11289 N THR A 707 74.769 102.634 102.163 1.00 0.00 N
ATOM 11290 CA THR A 707 74.856 103.538 100.955 1.00 0.00 C
ATOM 11291 C THR A 707 75.834 103.045 99.827 1.00 0.00 C
ATOM 11292 O THR A 707 76.068 103.791 98.853 1.00 0.00 O
ATOM 11293 CB THR A 707 75.317 104.945 101.336 1.00 0.00 C
ATOM 11294 CG2 THR A 707 74.323 105.628 102.309 1.00 0.00 C
ATOM 11295 OG1 THR A 707 76.612 104.879 101.905 1.00 0.00 O
ATOM 11296 H THR A 707 75.073 102.978 103.062 1.00 0.00 H
ATOM 11297 HA THR A 707 73.821 103.652 100.634 1.00 0.00 H
ATOM 11298 HB THR A 707 75.305 105.651 100.505 1.00 0.00 H
ATOM 11299 HG1 THR A 707 77.122 105.155 101.140 1.00 0.00 H
ATOM 11300 HG21 THR A 707 74.522 106.687 102.471 1.00 0.00 H
ATOM 11301 HG22 THR A 707 73.333 105.570 101.856 1.00 0.00 H
ATOM 11302 HG23 THR A 707 74.013 105.014 103.154 1.00 0.00 H
ATOM 11303 N GLU A 708 76.422 101.857 100.069 1.00 0.00 N
ATOM 11304 CA GLU A 708 77.316 101.092 99.162 1.00 0.00 C
ATOM 11305 C GLU A 708 76.586 99.934 98.411 1.00 0.00 C
ATOM 11306 O GLU A 708 77.090 99.436 97.426 1.00 0.00 O
ATOM 11307 CB GLU A 708 78.495 100.475 100.040 1.00 0.00 C
ATOM 11308 CG GLU A 708 79.496 101.488 100.599 1.00 0.00 C
ATOM 11309 CD GLU A 708 80.203 102.207 99.484 1.00 0.00 C
ATOM 11310 OE1 GLU A 708 80.577 103.384 99.725 1.00 0.00 O
ATOM 11311 OE2 GLU A 708 80.640 101.612 98.463 1.00 0.00 O1-
ATOM 11312 H GLU A 708 76.149 101.335 100.890 1.00 0.00 H
ATOM 11313 HA GLU A 708 77.719 101.817 98.455 1.00 0.00 H
ATOM 11314 HB2 GLU A 708 78.074 99.820 100.803 1.00 0.00 H
ATOM 11315 HB3 GLU A 708 79.146 99.840 99.439 1.00 0.00 H
ATOM 11316 HG2 GLU A 708 78.844 102.105 101.217 1.00 0.00 H
ATOM 11317 HG3 GLU A 708 80.166 101.064 101.346 1.00 0.00 H
ATOM 11318 N ASP A 709 75.353 99.557 98.850 1.00 0.00 N
ATOM 11319 CA ASP A 709 74.482 98.724 98.056 1.00 0.00 C
ATOM 11320 C ASP A 709 73.908 99.369 96.770 1.00 0.00 C
ATOM 11321 O ASP A 709 73.163 100.357 96.862 1.00 0.00 O
ATOM 11322 CB ASP A 709 73.357 98.122 98.982 1.00 0.00 C
ATOM 11323 CG ASP A 709 73.850 97.337 100.189 1.00 0.00 C
ATOM 11324 OD1 ASP A 709 74.828 96.588 100.007 1.00 0.00 O
ATOM 11325 OD2 ASP A 709 73.424 97.579 101.353 1.00 0.00 O1-
ATOM 11326 H ASP A 709 74.930 100.071 99.609 1.00 0.00 H
ATOM 11327 HA ASP A 709 75.087 97.882 97.719 1.00 0.00 H
ATOM 11328 HB2 ASP A 709 72.938 99.056 99.357 1.00 0.00 H
ATOM 11329 HB3 ASP A 709 72.561 97.642 98.412 1.00 0.00 H
ATOM 11330 N ARG A 710 74.005 98.589 95.712 1.00 0.00 N
ATOM 11331 CA ARG A 710 73.179 98.678 94.485 1.00 0.00 C
ATOM 11332 C ARG A 710 72.270 97.474 94.562 1.00 0.00 C
ATOM 11333 O ARG A 710 72.749 96.420 94.987 1.00 0.00 O
ATOM 11334 CB ARG A 710 73.964 98.789 93.213 1.00 0.00 C
ATOM 11335 CG ARG A 710 74.741 100.203 93.129 1.00 0.00 C
ATOM 11336 CD ARG A 710 75.574 100.253 91.856 1.00 0.00 C
ATOM 11337 NE ARG A 710 74.798 99.988 90.579 1.00 0.00 N
ATOM 11338 CZ ARG A 710 73.937 100.765 89.972 1.00 0.00 C
ATOM 11339 NH1 ARG A 710 73.593 101.957 90.427 1.00 0.00 N1+
ATOM 11340 NH2 ARG A 710 73.279 100.436 88.910 1.00 0.00 N
ATOM 11341 H ARG A 710 74.363 97.675 95.950 1.00 0.00 H
ATOM 11342 HA ARG A 710 72.607 99.596 94.620 1.00 0.00 H
ATOM 11343 HB2 ARG A 710 74.768 98.070 93.053 1.00 0.00 H
ATOM 11344 HB3 ARG A 710 73.215 98.666 92.431 1.00 0.00 H
ATOM 11345 HG2 ARG A 710 73.963 100.961 93.036 1.00 0.00 H
ATOM 11346 HG3 ARG A 710 75.359 100.413 94.002 1.00 0.00 H
ATOM 11347 HD2 ARG A 710 75.887 101.296 91.902 1.00 0.00 H
ATOM 11348 HD3 ARG A 710 76.480 99.652 91.942 1.00 0.00 H
ATOM 11349 HE ARG A 710 75.037 99.099 90.164 1.00 0.00 H
ATOM 11350 HH11 ARG A 710 74.088 102.478 91.137 1.00 0.00 H
ATOM 11351 HH12 ARG A 710 72.820 102.435 89.987 1.00 0.00 H
ATOM 11352 HH21 ARG A 710 73.630 99.709 88.303 1.00 0.00 H
ATOM 11353 HH22 ARG A 710 72.824 101.250 88.522 1.00 0.00 H
ATOM 11354 N VAL A 711 70.982 97.591 94.214 1.00 0.00 N
ATOM 11355 CA VAL A 711 69.947 96.614 94.625 1.00 0.00 C
ATOM 11356 C VAL A 711 68.868 96.407 93.573 1.00 0.00 C
ATOM 11357 O VAL A 711 68.682 97.231 92.751 1.00 0.00 O
ATOM 11358 CB VAL A 711 69.226 97.188 95.918 1.00 0.00 C
ATOM 11359 CG1 VAL A 711 70.137 97.260 97.194 1.00 0.00 C
ATOM 11360 CG2 VAL A 711 68.313 98.446 95.827 1.00 0.00 C
ATOM 11361 H VAL A 711 70.623 98.329 93.625 1.00 0.00 H
ATOM 11362 HA VAL A 711 70.377 95.668 94.955 1.00 0.00 H
ATOM 11363 HB VAL A 711 68.504 96.412 96.172 1.00 0.00 H
ATOM 11364 HG11 VAL A 711 69.482 96.961 98.013 1.00 0.00 H
ATOM 11365 HG12 VAL A 711 70.843 96.432 97.127 1.00 0.00 H
ATOM 11366 HG13 VAL A 711 70.676 98.190 97.374 1.00 0.00 H
ATOM 11367 HG21 VAL A 711 67.547 98.384 95.054 1.00 0.00 H
ATOM 11368 HG22 VAL A 711 67.815 98.611 96.782 1.00 0.00 H
ATOM 11369 HG23 VAL A 711 69.091 99.188 95.644 1.00 0.00 H
ATOM 11370 N CYS A 712 68.125 95.290 93.548 1.00 0.00 N
ATOM 11371 CA CYS A 712 66.877 95.082 92.762 1.00 0.00 C
ATOM 11372 C CYS A 712 65.656 94.673 93.612 1.00 0.00 C
ATOM 11373 O CYS A 712 65.788 94.079 94.708 1.00 0.00 O
ATOM 11374 CB CYS A 712 67.204 94.113 91.741 1.00 0.00 C
ATOM 11375 SG CYS A 712 68.389 94.859 90.512 1.00 0.00 S
ATOM 11376 H CYS A 712 68.325 94.553 94.210 1.00 0.00 H
ATOM 11377 HA CYS A 712 66.672 96.072 92.354 1.00 0.00 H
ATOM 11378 HB2 CYS A 712 67.704 93.290 92.252 1.00 0.00 H
ATOM 11379 HB3 CYS A 712 66.291 93.858 91.204 1.00 0.00 H
ATOM 11380 HG CYS A 712 67.397 95.623 90.045 1.00 0.00 H
ATOM 11381 N LEU A 713 64.498 94.917 93.030 1.00 0.00 N
ATOM 11382 CA LEU A 713 63.251 94.416 93.532 1.00 0.00 C
ATOM 11383 C LEU A 713 63.025 93.058 92.784 1.00 0.00 C
ATOM 11384 O LEU A 713 62.868 92.987 91.531 1.00 0.00 O
ATOM 11385 CB LEU A 713 62.132 95.394 93.230 1.00 0.00 C
ATOM 11386 CG LEU A 713 60.783 95.044 93.821 1.00 0.00 C
ATOM 11387 CD1 LEU A 713 60.671 95.729 95.138 1.00 0.00 C
ATOM 11388 CD2 LEU A 713 59.620 95.491 92.913 1.00 0.00 C
ATOM 11389 H LEU A 713 64.429 95.380 92.135 1.00 0.00 H
ATOM 11390 HA LEU A 713 63.180 94.330 94.617 1.00 0.00 H
ATOM 11391 HB2 LEU A 713 62.440 96.399 93.519 1.00 0.00 H
ATOM 11392 HB3 LEU A 713 61.901 95.456 92.166 1.00 0.00 H
ATOM 11393 HG LEU A 713 60.678 93.959 93.832 1.00 0.00 H
ATOM 11394 HD11 LEU A 713 59.609 95.734 95.382 1.00 0.00 H
ATOM 11395 HD12 LEU A 713 61.137 95.127 95.918 1.00 0.00 H
ATOM 11396 HD13 LEU A 713 60.872 96.800 95.149 1.00 0.00 H
ATOM 11397 HD21 LEU A 713 59.819 96.459 92.453 1.00 0.00 H
ATOM 11398 HD22 LEU A 713 59.646 94.790 92.078 1.00 0.00 H
ATOM 11399 HD23 LEU A 713 58.629 95.359 93.349 1.00 0.00 H
ATOM 11400 N ILE A 714 62.991 91.990 93.565 1.00 0.00 N
ATOM 11401 CA ILE A 714 62.872 90.593 93.045 1.00 0.00 C
ATOM 11402 C ILE A 714 61.477 90.094 93.348 1.00 0.00 C
ATOM 11403 O ILE A 714 60.918 90.411 94.427 1.00 0.00 O
ATOM 11404 CB ILE A 714 64.035 89.731 93.730 1.00 0.00 C
ATOM 11405 CG1 ILE A 714 65.449 90.320 93.549 1.00 0.00 C
ATOM 11406 CG2 ILE A 714 63.941 88.264 93.306 1.00 0.00 C
ATOM 11407 CD1 ILE A 714 65.973 90.192 92.113 1.00 0.00 C
ATOM 11408 H ILE A 714 62.982 92.205 94.552 1.00 0.00 H
ATOM 11409 HA ILE A 714 62.988 90.457 91.970 1.00 0.00 H
ATOM 11410 HB ILE A 714 63.871 89.859 94.800 1.00 0.00 H
ATOM 11411 HG12 ILE A 714 65.398 91.345 93.918 1.00 0.00 H
ATOM 11412 HG13 ILE A 714 65.994 89.676 94.239 1.00 0.00 H
ATOM 11413 HG21 ILE A 714 63.014 87.823 93.672 1.00 0.00 H
ATOM 11414 HG22 ILE A 714 63.899 88.272 92.217 1.00 0.00 H
ATOM 11415 HG23 ILE A 714 64.798 87.726 93.711 1.00 0.00 H
ATOM 11416 HD11 ILE A 714 66.043 89.166 91.755 1.00 0.00 H
ATOM 11417 HD12 ILE A 714 65.372 90.776 91.416 1.00 0.00 H
ATOM 11418 HD13 ILE A 714 67.000 90.558 92.128 1.00 0.00 H
ATOM 11419 N GLY A 715 60.968 89.293 92.405 1.00 0.00 N
ATOM 11420 CA GLY A 715 59.818 88.484 92.607 1.00 0.00 C
ATOM 11421 C GLY A 715 59.950 87.104 92.051 1.00 0.00 C
ATOM 11422 O GLY A 715 60.959 86.603 91.704 1.00 0.00 O
ATOM 11423 H GLY A 715 61.431 89.231 91.510 1.00 0.00 H
ATOM 11424 HA2 GLY A 715 59.708 88.269 93.670 1.00 0.00 H
ATOM 11425 HA3 GLY A 715 58.900 88.947 92.244 1.00 0.00 H
ATOM 11426 N SER A 716 58.771 86.572 91.640 1.00 0.00 N
ATOM 11427 CA SER A 716 58.449 85.268 90.947 1.00 0.00 C
ATOM 11428 C SER A 716 56.936 85.306 90.503 1.00 0.00 C
ATOM 11429 O SER A 716 56.106 85.403 91.362 1.00 0.00 O
ATOM 11430 CB SER A 716 58.706 84.102 91.809 1.00 0.00 C
ATOM 11431 OG SER A 716 58.568 82.893 90.994 1.00 0.00 O
ATOM 11432 H SER A 716 58.017 87.241 91.704 1.00 0.00 H
ATOM 11433 HA SER A 716 59.076 85.293 90.055 1.00 0.00 H
ATOM 11434 HB2 SER A 716 59.720 84.133 92.207 1.00 0.00 H
ATOM 11435 HB3 SER A 716 57.998 83.977 92.629 1.00 0.00 H
ATOM 11436 HG SER A 716 58.501 82.112 91.549 1.00 0.00 H
ATOM 11437 N ASN A 717 56.636 84.912 89.231 1.00 0.00 N
ATOM 11438 CA ASN A 717 55.199 84.620 88.907 1.00 0.00 C
ATOM 11439 C ASN A 717 54.851 83.135 89.162 1.00 0.00 C
ATOM 11440 O ASN A 717 55.343 82.300 88.399 1.00 0.00 O
ATOM 11441 CB ASN A 717 55.007 85.069 87.461 1.00 0.00 C
ATOM 11442 CG ASN A 717 55.042 86.586 87.323 1.00 0.00 C
ATOM 11443 ND2 ASN A 717 55.956 87.091 86.617 1.00 0.00 N
ATOM 11444 OD1 ASN A 717 54.407 87.322 88.089 1.00 0.00 O
ATOM 11445 H ASN A 717 57.332 84.580 88.578 1.00 0.00 H
ATOM 11446 HA ASN A 717 54.495 85.277 89.418 1.00 0.00 H
ATOM 11447 HB2 ASN A 717 55.706 84.466 86.882 1.00 0.00 H
ATOM 11448 HB3 ASN A 717 53.978 84.795 87.229 1.00 0.00 H
ATOM 11449 HD21 ASN A 717 56.051 88.083 86.784 1.00 0.00 H
ATOM 11450 HD22 ASN A 717 56.573 86.609 85.979 1.00 0.00 H
ATOM 11451 N PHE A 718 53.931 82.781 90.082 1.00 0.00 N
ATOM 11452 CA PHE A 718 53.645 81.396 90.614 1.00 0.00 C
ATOM 11453 C PHE A 718 53.092 80.341 89.648 1.00 0.00 C
ATOM 11454 O PHE A 718 53.307 79.164 89.949 1.00 0.00 O
ATOM 11455 CB PHE A 718 52.846 81.447 91.968 1.00 0.00 C
ATOM 11456 CG PHE A 718 53.293 82.339 93.096 1.00 0.00 C
ATOM 11457 CD1 PHE A 718 52.377 82.724 94.067 1.00 0.00 C
ATOM 11458 CD2 PHE A 718 54.620 82.774 93.122 1.00 0.00 C
ATOM 11459 CE1 PHE A 718 52.862 83.532 95.165 1.00 0.00 C
ATOM 11460 CE2 PHE A 718 55.097 83.619 94.123 1.00 0.00 C
ATOM 11461 CZ PHE A 718 54.197 83.972 95.183 1.00 0.00 C
ATOM 11462 H PHE A 718 53.404 83.534 90.501 1.00 0.00 H
ATOM 11463 HA PHE A 718 54.623 80.975 90.849 1.00 0.00 H
ATOM 11464 HB2 PHE A 718 51.814 81.680 91.707 1.00 0.00 H
ATOM 11465 HB3 PHE A 718 52.740 80.446 92.388 1.00 0.00 H
ATOM 11466 HD1 PHE A 718 51.361 82.362 94.006 1.00 0.00 H
ATOM 11467 HD2 PHE A 718 55.316 82.609 92.313 1.00 0.00 H
ATOM 11468 HE1 PHE A 718 52.204 83.974 95.898 1.00 0.00 H
ATOM 11469 HE2 PHE A 718 56.031 84.141 93.971 1.00 0.00 H
ATOM 11470 HZ PHE A 718 54.444 84.738 95.903 1.00 0.00 H
ATOM 11471 N GLN A 719 52.463 80.742 88.489 1.00 0.00 N
ATOM 11472 CA GLN A 719 51.816 79.832 87.561 1.00 0.00 C
ATOM 11473 C GLN A 719 50.670 79.069 88.208 1.00 0.00 C
ATOM 11474 O GLN A 719 50.374 77.895 87.912 1.00 0.00 O
ATOM 11475 CB GLN A 719 52.767 78.984 86.733 1.00 0.00 C
ATOM 11476 CG GLN A 719 53.945 79.621 86.116 1.00 0.00 C
ATOM 11477 CD GLN A 719 53.548 80.614 85.031 1.00 0.00 C
ATOM 11478 NE2 GLN A 719 54.333 81.668 84.819 1.00 0.00 N
ATOM 11479 OE1 GLN A 719 52.558 80.484 84.314 1.00 0.00 O
ATOM 11480 H GLN A 719 52.279 81.733 88.423 1.00 0.00 H
ATOM 11481 HA GLN A 719 51.286 80.518 86.900 1.00 0.00 H
ATOM 11482 HB2 GLN A 719 53.180 78.222 87.395 1.00 0.00 H
ATOM 11483 HB3 GLN A 719 52.133 78.481 86.003 1.00 0.00 H
ATOM 11484 HG2 GLN A 719 54.688 79.976 86.831 1.00 0.00 H
ATOM 11485 HG3 GLN A 719 54.461 78.803 85.613 1.00 0.00 H
ATOM 11486 HE21 GLN A 719 53.872 82.245 84.131 1.00 0.00 H
ATOM 11487 HE22 GLN A 719 55.116 81.962 85.386 1.00 0.00 H
ATOM 11488 N THR A 720 50.048 79.698 89.212 1.00 0.00 N
ATOM 11489 CA THR A 720 49.113 79.061 90.162 1.00 0.00 C
ATOM 11490 C THR A 720 48.263 80.188 90.730 1.00 0.00 C
ATOM 11491 O THR A 720 47.053 80.180 90.493 1.00 0.00 O
ATOM 11492 CB THR A 720 49.889 78.437 91.302 1.00 0.00 C
ATOM 11493 CG2 THR A 720 49.119 77.760 92.365 1.00 0.00 C
ATOM 11494 OG1 THR A 720 50.827 77.423 90.897 1.00 0.00 O
ATOM 11495 OXT THR A 720 48.700 80.911 91.630 1.00 0.00 O1-
ATOM 11496 H THR A 720 50.230 80.661 89.456 1.00 0.00 H
ATOM 11497 HA THR A 720 48.531 78.328 89.604 1.00 0.00 H
ATOM 11498 HB THR A 720 50.488 79.239 91.733 1.00 0.00 H
ATOM 11499 HG1 THR A 720 51.566 77.871 90.479 1.00 0.00 H
ATOM 11500 HG21 THR A 720 48.596 78.469 93.007 1.00 0.00 H
ATOM 11501 HG22 THR A 720 48.506 76.995 91.889 1.00 0.00 H
ATOM 11502 HG23 THR A 720 49.789 77.287 93.084 1.00 0.00 H
ATOM 11503 N GLU A 721 78.396 58.319 92.754 1.00 0.00 N
ATOM 11504 CA GLU A 721 78.944 59.184 91.660 1.00 0.00 C
ATOM 11505 C GLU A 721 77.829 60.207 91.320 1.00 0.00 C
ATOM 11506 O GLU A 721 76.665 60.069 91.699 1.00 0.00 O
ATOM 11507 CB GLU A 721 79.437 58.452 90.436 1.00 0.00 C
ATOM 11508 CG GLU A 721 80.782 57.791 90.633 1.00 0.00 C
ATOM 11509 CD GLU A 721 80.574 56.333 91.163 1.00 0.00 C
ATOM 11510 OE1 GLU A 721 79.884 56.113 92.172 1.00 0.00 O
ATOM 11511 OE2 GLU A 721 81.148 55.358 90.624 1.00 0.00 O1-
ATOM 11512 HA GLU A 721 79.827 59.729 91.995 1.00 0.00 H
ATOM 11513 HB2 GLU A 721 78.723 57.793 89.942 1.00 0.00 H
ATOM 11514 HB3 GLU A 721 79.549 59.247 89.699 1.00 0.00 H
ATOM 11515 HG2 GLU A 721 81.371 57.618 89.732 1.00 0.00 H
ATOM 11516 HG3 GLU A 721 81.304 58.379 91.388 1.00 0.00 H
ATOM 11517 H1 GLU A 721 77.462 58.019 92.515 1.00 0.00 H
ATOM 11518 H2 GLU A 721 78.320 58.793 93.643 1.00 0.00 H
ATOM 11519 H3 GLU A 721 78.929 57.466 92.839 1.00 0.00 H
ATOM 11520 N LEU A 722 78.208 61.355 90.720 1.00 0.00 N
ATOM 11521 CA LEU A 722 77.290 62.312 90.168 1.00 0.00 C
ATOM 11522 C LEU A 722 76.619 61.726 88.921 1.00 0.00 C
ATOM 11523 O LEU A 722 77.283 61.444 87.946 1.00 0.00 O
ATOM 11524 CB LEU A 722 78.131 63.635 89.920 1.00 0.00 C
ATOM 11525 CG LEU A 722 77.198 64.875 89.770 1.00 0.00 C
ATOM 11526 CD1 LEU A 722 76.870 65.403 91.117 1.00 0.00 C
ATOM 11527 CD2 LEU A 722 78.131 66.003 89.190 1.00 0.00 C
ATOM 11528 H LEU A 722 79.192 61.581 90.732 1.00 0.00 H
ATOM 11529 HA LEU A 722 76.520 62.552 90.900 1.00 0.00 H
ATOM 11530 HB2 LEU A 722 78.806 63.919 90.728 1.00 0.00 H
ATOM 11531 HB3 LEU A 722 78.792 63.475 89.068 1.00 0.00 H
ATOM 11532 HG LEU A 722 76.357 64.716 89.095 1.00 0.00 H
ATOM 11533 HD11 LEU A 722 76.227 64.761 91.721 1.00 0.00 H
ATOM 11534 HD12 LEU A 722 77.781 65.449 91.713 1.00 0.00 H
ATOM 11535 HD13 LEU A 722 76.516 66.414 90.919 1.00 0.00 H
ATOM 11536 HD21 LEU A 722 77.632 66.954 89.001 1.00 0.00 H
ATOM 11537 HD22 LEU A 722 78.995 66.221 89.817 1.00 0.00 H
ATOM 11538 HD23 LEU A 722 78.485 65.705 88.203 1.00 0.00 H
ATOM 11539 N PRO A 723 75.238 61.658 88.872 1.00 0.00 N
ATOM 11540 CA PRO A 723 74.481 61.032 87.777 1.00 0.00 C
ATOM 11541 C PRO A 723 74.461 61.850 86.454 1.00 0.00 C
ATOM 11542 O PRO A 723 74.866 63.011 86.405 1.00 0.00 O
ATOM 11543 CB PRO A 723 73.100 60.605 88.327 1.00 0.00 C
ATOM 11544 CG PRO A 723 72.868 61.719 89.363 1.00 0.00 C
ATOM 11545 CD PRO A 723 74.315 61.795 89.930 1.00 0.00 C
ATOM 11546 HA PRO A 723 75.073 60.158 87.505 1.00 0.00 H
ATOM 11547 HB2 PRO A 723 72.228 60.426 87.698 1.00 0.00 H
ATOM 11548 HB3 PRO A 723 73.279 59.656 88.832 1.00 0.00 H
ATOM 11549 HG2 PRO A 723 72.701 62.661 88.841 1.00 0.00 H
ATOM 11550 HG3 PRO A 723 72.073 61.489 90.072 1.00 0.00 H
ATOM 11551 HD2 PRO A 723 74.501 62.720 90.477 1.00 0.00 H
ATOM 11552 HD3 PRO A 723 74.408 60.914 90.565 1.00 0.00 H
ATOM 11553 N ILE A 724 73.968 61.331 85.348 1.00 0.00 N
ATOM 11554 CA ILE A 724 74.055 62.059 84.052 1.00 0.00 C
ATOM 11555 C ILE A 724 72.970 63.172 83.838 1.00 0.00 C
ATOM 11556 O ILE A 724 71.755 62.936 84.017 1.00 0.00 O
ATOM 11557 CB ILE A 724 74.032 61.024 82.895 1.00 0.00 C
ATOM 11558 CG1 ILE A 724 75.306 60.231 82.769 1.00 0.00 C
ATOM 11559 CG2 ILE A 724 73.805 61.675 81.483 1.00 0.00 C
ATOM 11560 CD1 ILE A 724 75.121 58.824 82.126 1.00 0.00 C
ATOM 11561 H ILE A 724 73.454 60.462 85.376 1.00 0.00 H
ATOM 11562 HA ILE A 724 74.985 62.628 84.060 1.00 0.00 H
ATOM 11563 HB ILE A 724 73.149 60.415 83.089 1.00 0.00 H
ATOM 11564 HG12 ILE A 724 76.062 60.830 82.263 1.00 0.00 H
ATOM 11565 HG13 ILE A 724 75.641 60.152 83.804 1.00 0.00 H
ATOM 11566 HG21 ILE A 724 73.853 60.878 80.741 1.00 0.00 H
ATOM 11567 HG22 ILE A 724 72.817 62.134 81.426 1.00 0.00 H
ATOM 11568 HG23 ILE A 724 74.584 62.399 81.243 1.00 0.00 H
ATOM 11569 HD11 ILE A 724 74.757 58.882 81.100 1.00 0.00 H
ATOM 11570 HD12 ILE A 724 76.035 58.230 82.149 1.00 0.00 H
ATOM 11571 HD13 ILE A 724 74.376 58.324 82.745 1.00 0.00 H
ATOM 11572 N ALA A 725 73.423 64.319 83.349 1.00 0.00 N
ATOM 11573 CA ALA A 725 72.558 65.445 82.895 1.00 0.00 C
ATOM 11574 C ALA A 725 71.728 65.162 81.646 1.00 0.00 C
ATOM 11575 O ALA A 725 72.296 64.586 80.699 1.00 0.00 O
ATOM 11576 CB ALA A 725 73.215 66.801 82.853 1.00 0.00 C
ATOM 11577 H ALA A 725 74.425 64.299 83.224 1.00 0.00 H
ATOM 11578 HA ALA A 725 71.863 65.538 83.730 1.00 0.00 H
ATOM 11579 HB1 ALA A 725 73.734 66.980 83.795 1.00 0.00 H
ATOM 11580 HB2 ALA A 725 73.932 66.826 82.032 1.00 0.00 H
ATOM 11581 HB3 ALA A 725 72.426 67.523 82.645 1.00 0.00 H
ATOM 11582 N ARG A 726 70.440 65.578 81.532 1.00 0.00 N
ATOM 11583 CA ARG A 726 69.494 65.240 80.474 1.00 0.00 C
ATOM 11584 C ARG A 726 69.610 66.214 79.251 1.00 0.00 C
ATOM 11585 O ARG A 726 69.803 67.412 79.463 1.00 0.00 O
ATOM 11586 CB ARG A 726 68.083 65.432 81.124 1.00 0.00 C
ATOM 11587 CG ARG A 726 67.719 66.897 81.500 1.00 0.00 C
ATOM 11588 CD ARG A 726 66.692 66.720 82.606 1.00 0.00 C
ATOM 11589 NE ARG A 726 65.720 67.811 82.630 1.00 0.00 N
ATOM 11590 CZ ARG A 726 64.920 68.208 83.633 1.00 0.00 C
ATOM 11591 NH1 ARG A 726 64.677 67.483 84.668 1.00 0.00 N1+
ATOM 11592 NH2 ARG A 726 64.428 69.450 83.647 1.00 0.00 N
ATOM 11593 H ARG A 726 70.113 66.173 82.280 1.00 0.00 H
ATOM 11594 HA ARG A 726 69.631 64.204 80.164 1.00 0.00 H
ATOM 11595 HB2 ARG A 726 67.276 65.219 80.423 1.00 0.00 H
ATOM 11596 HB3 ARG A 726 67.960 64.730 81.949 1.00 0.00 H
ATOM 11597 HG2 ARG A 726 68.582 67.425 81.906 1.00 0.00 H
ATOM 11598 HG3 ARG A 726 67.182 67.370 80.678 1.00 0.00 H
ATOM 11599 HD2 ARG A 726 66.149 65.787 82.458 1.00 0.00 H
ATOM 11600 HD3 ARG A 726 67.270 66.627 83.525 1.00 0.00 H
ATOM 11601 HE ARG A 726 65.742 68.500 81.891 1.00 0.00 H
ATOM 11602 HH11 ARG A 726 65.039 66.559 84.851 1.00 0.00 H
ATOM 11603 HH12 ARG A 726 64.006 67.850 85.328 1.00 0.00 H
ATOM 11604 HH21 ARG A 726 64.425 70.020 82.814 1.00 0.00 H
ATOM 11605 HH22 ARG A 726 63.774 69.630 84.396 1.00 0.00 H
ATOM 11606 N ARG A 727 69.324 65.743 77.982 1.00 0.00 N
ATOM 11607 CA ARG A 727 69.201 66.663 76.831 1.00 0.00 C
ATOM 11608 C ARG A 727 67.930 67.473 76.926 1.00 0.00 C
ATOM 11609 O ARG A 727 66.841 66.842 76.944 1.00 0.00 O
ATOM 11610 CB ARG A 727 69.321 65.885 75.516 1.00 0.00 C
ATOM 11611 CG ARG A 727 68.996 66.557 74.147 1.00 0.00 C
ATOM 11612 CD ARG A 727 69.471 65.686 72.997 1.00 0.00 C
ATOM 11613 NE ARG A 727 69.007 66.284 71.768 1.00 0.00 N
ATOM 11614 CZ ARG A 727 69.049 65.775 70.577 1.00 0.00 C
ATOM 11615 NH1 ARG A 727 69.642 64.634 70.495 1.00 0.00 N1+
ATOM 11616 NH2 ARG A 727 68.569 66.451 69.571 1.00 0.00 N
ATOM 11617 H ARG A 727 68.872 64.841 77.931 1.00 0.00 H
ATOM 11618 HA ARG A 727 70.037 67.361 76.868 1.00 0.00 H
ATOM 11619 HB2 ARG A 727 70.313 65.448 75.394 1.00 0.00 H
ATOM 11620 HB3 ARG A 727 68.619 65.051 75.519 1.00 0.00 H
ATOM 11621 HG2 ARG A 727 67.938 66.813 74.104 1.00 0.00 H
ATOM 11622 HG3 ARG A 727 69.551 67.494 74.185 1.00 0.00 H
ATOM 11623 HD2 ARG A 727 70.556 65.758 73.075 1.00 0.00 H
ATOM 11624 HD3 ARG A 727 68.980 64.714 73.050 1.00 0.00 H
ATOM 11625 HE ARG A 727 68.740 67.257 71.799 1.00 0.00 H
ATOM 11626 HH11 ARG A 727 70.028 64.116 71.271 1.00 0.00 H
ATOM 11627 HH12 ARG A 727 69.653 64.174 69.596 1.00 0.00 H
ATOM 11628 HH21 ARG A 727 68.190 67.354 69.819 1.00 0.00 H
ATOM 11629 HH22 ARG A 727 68.684 66.079 68.639 1.00 0.00 H
ATOM 11630 N ALA A 728 67.990 68.811 76.927 1.00 0.00 N
ATOM 11631 CA ALA A 728 66.873 69.711 77.104 1.00 0.00 C
ATOM 11632 C ALA A 728 65.691 69.512 76.077 1.00 0.00 C
ATOM 11633 O ALA A 728 64.535 69.586 76.450 1.00 0.00 O
ATOM 11634 CB ALA A 728 67.396 71.168 76.858 1.00 0.00 C
ATOM 11635 H ALA A 728 68.934 69.169 76.894 1.00 0.00 H
ATOM 11636 HA ALA A 728 66.433 69.546 78.088 1.00 0.00 H
ATOM 11637 HB1 ALA A 728 68.267 71.365 77.483 1.00 0.00 H
ATOM 11638 HB2 ALA A 728 67.579 71.217 75.784 1.00 0.00 H
ATOM 11639 HB3 ALA A 728 66.652 71.953 76.998 1.00 0.00 H
ATOM 11640 N SER A 729 65.961 69.032 74.850 1.00 0.00 N
ATOM 11641 CA SER A 729 64.894 68.758 73.850 1.00 0.00 C
ATOM 11642 C SER A 729 64.352 67.352 73.856 1.00 0.00 C
ATOM 11643 O SER A 729 63.520 67.016 73.045 1.00 0.00 O
ATOM 11644 CB SER A 729 65.480 69.251 72.438 1.00 0.00 C
ATOM 11645 OG SER A 729 66.723 68.522 72.339 1.00 0.00 O
ATOM 11646 H SER A 729 66.925 69.084 74.556 1.00 0.00 H
ATOM 11647 HA SER A 729 64.015 69.385 74.003 1.00 0.00 H
ATOM 11648 HB2 SER A 729 64.970 68.984 71.512 1.00 0.00 H
ATOM 11649 HB3 SER A 729 65.648 70.327 72.467 1.00 0.00 H
ATOM 11650 HG SER A 729 67.158 68.825 71.539 1.00 0.00 H
ATOM 11651 N LEU A 730 64.855 66.479 74.705 1.00 0.00 N
ATOM 11652 CA LEU A 730 64.587 65.024 74.870 1.00 0.00 C
ATOM 11653 C LEU A 730 63.811 64.660 76.102 1.00 0.00 C
ATOM 11654 O LEU A 730 63.062 63.711 76.101 1.00 0.00 O
ATOM 11655 CB LEU A 730 65.881 64.317 74.660 1.00 0.00 C
ATOM 11656 CG LEU A 730 65.852 62.784 74.598 1.00 0.00 C
ATOM 11657 CD1 LEU A 730 64.936 62.366 73.391 1.00 0.00 C
ATOM 11658 CD2 LEU A 730 67.181 62.126 74.493 1.00 0.00 C
ATOM 11659 H LEU A 730 65.412 66.865 75.455 1.00 0.00 H
ATOM 11660 HA LEU A 730 63.953 64.791 74.014 1.00 0.00 H
ATOM 11661 HB2 LEU A 730 66.364 64.705 73.763 1.00 0.00 H
ATOM 11662 HB3 LEU A 730 66.531 64.568 75.498 1.00 0.00 H
ATOM 11663 HG LEU A 730 65.396 62.468 75.536 1.00 0.00 H
ATOM 11664 HD11 LEU A 730 63.915 62.735 73.307 1.00 0.00 H
ATOM 11665 HD12 LEU A 730 65.288 62.756 72.437 1.00 0.00 H
ATOM 11666 HD13 LEU A 730 64.827 61.281 73.410 1.00 0.00 H
ATOM 11667 HD21 LEU A 730 67.648 62.577 73.618 1.00 0.00 H
ATOM 11668 HD22 LEU A 730 67.881 62.393 75.285 1.00 0.00 H
ATOM 11669 HD23 LEU A 730 67.074 61.045 74.399 1.00 0.00 H
ATOM 11670 N HIE A 731 63.981 65.457 77.200 1.00 0.00 N
ATOM 11671 CA HIE A 731 63.235 65.170 78.475 1.00 0.00 C
ATOM 11672 C HIE A 731 61.703 65.010 78.283 1.00 0.00 C
ATOM 11673 O HIE A 731 61.191 64.017 78.695 1.00 0.00 O
ATOM 11674 CB HIE A 731 63.452 66.282 79.448 1.00 0.00 C
ATOM 11675 CG HIE A 731 62.763 66.115 80.723 1.00 0.00 C
ATOM 11676 CD2 HIE A 731 61.553 66.591 81.189 1.00 0.00 C
ATOM 11677 ND1 HIE A 731 63.343 65.307 81.810 1.00 0.00 N
ATOM 11678 CE1 HIE A 731 62.496 65.307 82.874 1.00 0.00 C
ATOM 11679 NE2 HIE A 731 61.401 65.974 82.488 1.00 0.00 N
ATOM 11680 H HIE A 731 64.407 66.374 77.215 1.00 0.00 H
ATOM 11681 HA HIE A 731 63.546 64.257 78.984 1.00 0.00 H
ATOM 11682 HB2 HIE A 731 64.530 66.404 79.549 1.00 0.00 H
ATOM 11683 HB3 HIE A 731 63.074 67.155 78.916 1.00 0.00 H
ATOM 11684 HD2 HIE A 731 60.903 67.304 80.705 1.00 0.00 H
ATOM 11685 HE1 HIE A 731 62.625 65.001 83.902 1.00 0.00 H
ATOM 11686 HE2 HIE A 731 60.554 66.030 83.035 1.00 0.00 H
ATOM 11687 N ARG A 732 60.984 65.935 77.659 1.00 0.00 N
ATOM 11688 CA ARG A 732 59.519 65.815 77.678 1.00 0.00 C
ATOM 11689 C ARG A 732 58.994 64.638 76.885 1.00 0.00 C
ATOM 11690 O ARG A 732 58.030 64.089 77.236 1.00 0.00 O
ATOM 11691 CB ARG A 732 58.995 67.142 77.179 1.00 0.00 C
ATOM 11692 CG ARG A 732 58.815 68.193 78.205 1.00 0.00 C
ATOM 11693 CD ARG A 732 58.111 69.380 77.517 1.00 0.00 C
ATOM 11694 NE ARG A 732 59.067 70.244 76.660 1.00 0.00 N
ATOM 11695 CZ ARG A 732 59.066 71.554 76.577 1.00 0.00 C
ATOM 11696 NH1 ARG A 732 57.997 72.240 76.881 1.00 0.00 N1+
ATOM 11697 NH2 ARG A 732 60.108 72.182 76.247 1.00 0.00 N
ATOM 11698 H ARG A 732 61.392 66.840 77.476 1.00 0.00 H
ATOM 11699 HA ARG A 732 59.163 65.740 78.705 1.00 0.00 H
ATOM 11700 HB2 ARG A 732 59.539 67.484 76.298 1.00 0.00 H
ATOM 11701 HB3 ARG A 732 58.030 66.853 76.762 1.00 0.00 H
ATOM 11702 HG2 ARG A 732 58.228 67.775 79.022 1.00 0.00 H
ATOM 11703 HG3 ARG A 732 59.780 68.532 78.582 1.00 0.00 H
ATOM 11704 HD2 ARG A 732 57.248 69.058 76.935 1.00 0.00 H
ATOM 11705 HD3 ARG A 732 57.810 70.018 78.348 1.00 0.00 H
ATOM 11706 HE ARG A 732 59.891 69.759 76.335 1.00 0.00 H
ATOM 11707 HH11 ARG A 732 57.157 71.719 77.093 1.00 0.00 H
ATOM 11708 HH12 ARG A 732 57.954 73.240 76.747 1.00 0.00 H
ATOM 11709 HH21 ARG A 732 60.894 71.638 75.922 1.00 0.00 H
ATOM 11710 HH22 ARG A 732 60.006 73.184 76.169 1.00 0.00 H
ATOM 11711 N PHE A 733 59.746 64.242 75.827 1.00 0.00 N
ATOM 11712 CA PHE A 733 59.632 62.932 75.193 1.00 0.00 C
ATOM 11713 C PHE A 733 59.932 61.716 75.992 1.00 0.00 C
ATOM 11714 O PHE A 733 59.082 60.836 76.177 1.00 0.00 O
ATOM 11715 CB PHE A 733 60.487 63.050 73.925 1.00 0.00 C
ATOM 11716 CG PHE A 733 60.441 61.788 73.247 1.00 0.00 C
ATOM 11717 CD1 PHE A 733 61.458 60.820 73.531 1.00 0.00 C
ATOM 11718 CD2 PHE A 733 59.437 61.380 72.371 1.00 0.00 C
ATOM 11719 CE1 PHE A 733 61.430 59.559 72.922 1.00 0.00 C
ATOM 11720 CE2 PHE A 733 59.378 60.159 71.741 1.00 0.00 C
ATOM 11721 CZ PHE A 733 60.426 59.217 72.046 1.00 0.00 C
ATOM 11722 H PHE A 733 60.541 64.829 75.616 1.00 0.00 H
ATOM 11723 HA PHE A 733 58.602 62.817 74.855 1.00 0.00 H
ATOM 11724 HB2 PHE A 733 60.025 63.814 73.300 1.00 0.00 H
ATOM 11725 HB3 PHE A 733 61.519 63.384 74.038 1.00 0.00 H
ATOM 11726 HD1 PHE A 733 62.244 61.056 74.234 1.00 0.00 H
ATOM 11727 HD2 PHE A 733 58.673 62.086 72.081 1.00 0.00 H
ATOM 11728 HE1 PHE A 733 62.227 58.850 73.091 1.00 0.00 H
ATOM 11729 HE2 PHE A 733 58.582 59.811 71.100 1.00 0.00 H
ATOM 11730 HZ PHE A 733 60.404 58.220 71.633 1.00 0.00 H
ATOM 11731 N LEU A 734 61.022 61.733 76.789 1.00 0.00 N
ATOM 11732 CA LEU A 734 61.346 60.591 77.716 1.00 0.00 C
ATOM 11733 C LEU A 734 60.325 60.415 78.859 1.00 0.00 C
ATOM 11734 O LEU A 734 59.934 59.262 79.136 1.00 0.00 O
ATOM 11735 CB LEU A 734 62.694 60.746 78.339 1.00 0.00 C
ATOM 11736 CG LEU A 734 63.872 60.587 77.379 1.00 0.00 C
ATOM 11737 CD1 LEU A 734 65.204 60.921 78.061 1.00 0.00 C
ATOM 11738 CD2 LEU A 734 64.041 59.142 76.829 1.00 0.00 C
ATOM 11739 H LEU A 734 61.657 62.511 76.681 1.00 0.00 H
ATOM 11740 HA LEU A 734 61.351 59.673 77.129 1.00 0.00 H
ATOM 11741 HB2 LEU A 734 62.751 61.761 78.731 1.00 0.00 H
ATOM 11742 HB3 LEU A 734 62.883 60.002 79.113 1.00 0.00 H
ATOM 11743 HG LEU A 734 63.744 61.268 76.538 1.00 0.00 H
ATOM 11744 HD11 LEU A 734 65.216 61.970 78.359 1.00 0.00 H
ATOM 11745 HD12 LEU A 734 65.298 60.282 78.938 1.00 0.00 H
ATOM 11746 HD13 LEU A 734 66.016 60.841 77.337 1.00 0.00 H
ATOM 11747 HD21 LEU A 734 63.233 58.773 76.196 1.00 0.00 H
ATOM 11748 HD22 LEU A 734 64.901 59.002 76.174 1.00 0.00 H
ATOM 11749 HD23 LEU A 734 64.157 58.469 77.678 1.00 0.00 H
ATOM 11750 N GLU A 735 59.909 61.542 79.411 1.00 0.00 N
ATOM 11751 CA GLU A 735 58.754 61.613 80.300 1.00 0.00 C
ATOM 11752 C GLU A 735 57.513 61.056 79.790 1.00 0.00 C
ATOM 11753 O GLU A 735 56.873 60.242 80.454 1.00 0.00 O
ATOM 11754 CB GLU A 735 58.551 63.067 80.676 1.00 0.00 C
ATOM 11755 CG GLU A 735 59.585 63.548 81.738 1.00 0.00 C
ATOM 11756 CD GLU A 735 59.772 62.756 83.110 1.00 0.00 C
ATOM 11757 OE1 GLU A 735 60.907 62.404 83.431 1.00 0.00 O
ATOM 11758 OE2 GLU A 735 58.781 62.474 83.800 1.00 0.00 O1-
ATOM 11759 H GLU A 735 60.420 62.362 79.115 1.00 0.00 H
ATOM 11760 HA GLU A 735 59.026 61.020 81.174 1.00 0.00 H
ATOM 11761 HB2 GLU A 735 58.422 63.767 79.850 1.00 0.00 H
ATOM 11762 HB3 GLU A 735 57.585 63.133 81.177 1.00 0.00 H
ATOM 11763 HG2 GLU A 735 60.575 63.722 81.318 1.00 0.00 H
ATOM 11764 HG3 GLU A 735 59.195 64.527 82.015 1.00 0.00 H
ATOM 11765 N LYS A 736 57.136 61.260 78.555 1.00 0.00 N
ATOM 11766 CA LYS A 736 55.974 60.610 77.895 1.00 0.00 C
ATOM 11767 C LYS A 736 56.215 59.172 77.516 1.00 0.00 C
ATOM 11768 O LYS A 736 55.254 58.407 77.588 1.00 0.00 O
ATOM 11769 CB LYS A 736 55.557 61.462 76.705 1.00 0.00 C
ATOM 11770 CG LYS A 736 54.079 61.262 76.339 1.00 0.00 C
ATOM 11771 CD LYS A 736 53.543 62.214 75.180 1.00 0.00 C
ATOM 11772 CE LYS A 736 52.105 61.749 74.897 1.00 0.00 C
ATOM 11773 NZ LYS A 736 51.341 62.585 73.965 1.00 0.00 N1+
ATOM 11774 H LYS A 736 57.557 62.058 78.101 1.00 0.00 H
ATOM 11775 HA LYS A 736 55.132 60.679 78.584 1.00 0.00 H
ATOM 11776 HB2 LYS A 736 55.705 62.531 76.861 1.00 0.00 H
ATOM 11777 HB3 LYS A 736 56.068 61.200 75.778 1.00 0.00 H
ATOM 11778 HG2 LYS A 736 53.861 60.237 76.039 1.00 0.00 H
ATOM 11779 HG3 LYS A 736 53.421 61.499 77.176 1.00 0.00 H
ATOM 11780 HD2 LYS A 736 53.587 63.240 75.545 1.00 0.00 H
ATOM 11781 HD3 LYS A 736 54.213 62.168 74.322 1.00 0.00 H
ATOM 11782 HE2 LYS A 736 52.241 60.720 74.564 1.00 0.00 H
ATOM 11783 HE3 LYS A 736 51.559 61.663 75.836 1.00 0.00 H
ATOM 11784 HZ1 LYS A 736 51.793 62.826 73.094 1.00 0.00 H
ATOM 11785 HZ2 LYS A 736 50.483 62.160 73.643 1.00 0.00 H
ATOM 11786 HZ3 LYS A 736 51.023 63.463 74.350 1.00 0.00 H
ATOM 11787 N ARG A 737 57.484 58.752 77.247 1.00 0.00 N
ATOM 11788 CA ARG A 737 57.872 57.373 76.903 1.00 0.00 C
ATOM 11789 C ARG A 737 58.074 56.387 78.035 1.00 0.00 C
ATOM 11790 O ARG A 737 58.258 55.148 77.844 1.00 0.00 O
ATOM 11791 CB ARG A 737 59.000 57.563 75.866 1.00 0.00 C
ATOM 11792 CG ARG A 737 59.574 56.228 75.327 1.00 0.00 C
ATOM 11793 CD ARG A 737 58.504 55.251 74.782 1.00 0.00 C
ATOM 11794 NE ARG A 737 59.204 53.939 74.492 1.00 0.00 N
ATOM 11795 CZ ARG A 737 58.734 52.946 73.860 1.00 0.00 C
ATOM 11796 NH1 ARG A 737 57.564 52.909 73.235 1.00 0.00 N1+
ATOM 11797 NH2 ARG A 737 59.561 51.936 73.598 1.00 0.00 N
ATOM 11798 H ARG A 737 58.152 59.502 77.346 1.00 0.00 H
ATOM 11799 HA ARG A 737 57.019 56.968 76.358 1.00 0.00 H
ATOM 11800 HB2 ARG A 737 58.639 58.159 75.028 1.00 0.00 H
ATOM 11801 HB3 ARG A 737 59.890 58.071 76.236 1.00 0.00 H
ATOM 11802 HG2 ARG A 737 60.391 56.367 74.619 1.00 0.00 H
ATOM 11803 HG3 ARG A 737 60.211 55.848 76.126 1.00 0.00 H
ATOM 11804 HD2 ARG A 737 57.611 55.097 75.387 1.00 0.00 H
ATOM 11805 HD3 ARG A 737 58.179 55.667 73.829 1.00 0.00 H
ATOM 11806 HE ARG A 737 60.207 53.913 74.606 1.00 0.00 H
ATOM 11807 HH11 ARG A 737 56.853 53.615 73.361 1.00 0.00 H
ATOM 11808 HH12 ARG A 737 57.390 52.075 72.692 1.00 0.00 H
ATOM 11809 HH21 ARG A 737 60.498 52.071 73.949 1.00 0.00 H
ATOM 11810 HH22 ARG A 737 59.189 51.105 73.161 1.00 0.00 H
ATOM 11811 N LYS A 738 58.184 56.808 79.349 1.00 0.00 N
ATOM 11812 CA LYS A 738 58.568 55.877 80.461 1.00 0.00 C
ATOM 11813 C LYS A 738 57.337 55.066 80.952 1.00 0.00 C
ATOM 11814 O LYS A 738 56.184 55.402 80.624 1.00 0.00 O
ATOM 11815 CB LYS A 738 59.169 56.720 81.633 1.00 0.00 C
ATOM 11816 CG LYS A 738 58.090 57.671 82.205 1.00 0.00 C
ATOM 11817 CD LYS A 738 58.764 58.641 83.263 1.00 0.00 C
ATOM 11818 CE LYS A 738 57.567 59.530 83.572 1.00 0.00 C
ATOM 11819 NZ LYS A 738 57.670 60.198 84.866 1.00 0.00 N1+
ATOM 11820 H LYS A 738 58.043 57.792 79.526 1.00 0.00 H
ATOM 11821 HA LYS A 738 59.337 55.217 80.062 1.00 0.00 H
ATOM 11822 HB2 LYS A 738 59.449 56.080 82.469 1.00 0.00 H
ATOM 11823 HB3 LYS A 738 60.003 57.332 81.288 1.00 0.00 H
ATOM 11824 HG2 LYS A 738 57.593 58.239 81.418 1.00 0.00 H
ATOM 11825 HG3 LYS A 738 57.312 57.098 82.708 1.00 0.00 H
ATOM 11826 HD2 LYS A 738 59.008 58.109 84.182 1.00 0.00 H
ATOM 11827 HD3 LYS A 738 59.647 59.112 82.831 1.00 0.00 H
ATOM 11828 HE2 LYS A 738 57.419 60.145 82.685 1.00 0.00 H
ATOM 11829 HE3 LYS A 738 56.717 58.856 83.686 1.00 0.00 H
ATOM 11830 HZ1 LYS A 738 57.990 59.592 85.608 1.00 0.00 H
ATOM 11831 HZ2 LYS A 738 58.172 61.055 84.684 1.00 0.00 H
ATOM 11832 HZ3 LYS A 738 56.792 60.577 85.192 1.00 0.00 H
ATOM 11833 N GLY A 739 57.660 54.033 81.744 1.00 0.00 N
ATOM 11834 CA GLY A 739 56.777 53.129 82.506 1.00 0.00 C
ATOM 11835 C GLY A 739 55.919 53.920 83.485 1.00 0.00 C
ATOM 11836 O GLY A 739 56.456 54.679 84.277 1.00 0.00 O
ATOM 11837 H GLY A 739 58.622 54.121 82.037 1.00 0.00 H
ATOM 11838 HA2 GLY A 739 56.159 52.639 81.754 1.00 0.00 H
ATOM 11839 HA3 GLY A 739 57.361 52.419 83.092 1.00 0.00 H
ATOM 11840 N GLY A 740 54.587 53.541 83.568 1.00 0.00 N
ATOM 11841 CA GLY A 740 53.593 54.278 84.458 1.00 0.00 C
ATOM 11842 C GLY A 740 53.324 55.788 84.072 1.00 0.00 C
ATOM 11843 O GLY A 740 53.038 56.650 84.947 1.00 0.00 O
ATOM 11844 H GLY A 740 54.279 52.705 83.093 1.00 0.00 H
ATOM 11845 HA2 GLY A 740 52.629 53.770 84.457 1.00 0.00 H
ATOM 11846 HA3 GLY A 740 53.869 54.231 85.511 1.00 0.00 H
ATOM 11847 N SER A 741 53.614 56.236 82.875 1.00 0.00 N
ATOM 11848 CA SER A 741 53.491 57.609 82.322 1.00 0.00 C
ATOM 11849 C SER A 741 52.050 58.114 82.381 1.00 0.00 C
ATOM 11850 O SER A 741 51.090 57.433 82.058 1.00 0.00 O
ATOM 11851 CB SER A 741 54.181 57.641 80.884 1.00 0.00 C
ATOM 11852 OG SER A 741 53.881 58.907 80.387 1.00 0.00 O
ATOM 11853 H SER A 741 53.747 55.549 82.146 1.00 0.00 H
ATOM 11854 HA SER A 741 54.169 58.154 82.979 1.00 0.00 H
ATOM 11855 HB2 SER A 741 55.251 57.441 80.949 1.00 0.00 H
ATOM 11856 HB3 SER A 741 53.650 56.943 80.238 1.00 0.00 H
ATOM 11857 HG SER A 741 53.638 58.840 79.461 1.00 0.00 H
ATOM 11858 N GLY A 742 51.962 59.397 82.831 1.00 0.00 N
ATOM 11859 CA GLY A 742 50.726 60.184 82.697 1.00 0.00 C
ATOM 11860 C GLY A 742 50.503 60.785 81.259 1.00 0.00 C
ATOM 11861 O GLY A 742 49.351 61.121 81.021 1.00 0.00 O
ATOM 11862 H GLY A 742 52.830 59.832 83.109 1.00 0.00 H
ATOM 11863 HA2 GLY A 742 49.886 59.541 82.959 1.00 0.00 H
ATOM 11864 HA3 GLY A 742 50.703 60.995 83.424 1.00 0.00 H
ATOM 11865 N GLY A 743 51.457 60.976 80.414 1.00 0.00 N
ATOM 11866 CA GLY A 743 51.418 61.601 79.100 1.00 0.00 C
ATOM 11867 C GLY A 743 51.609 63.101 79.111 1.00 0.00 C
ATOM 11868 O GLY A 743 52.249 63.738 78.243 1.00 0.00 O
ATOM 11869 H GLY A 743 52.375 60.684 80.719 1.00 0.00 H
ATOM 11870 HA2 GLY A 743 52.229 61.137 78.539 1.00 0.00 H
ATOM 11871 HA3 GLY A 743 50.462 61.409 78.614 1.00 0.00 H
ATOM 11872 N GLY A 744 51.005 63.710 80.191 1.00 0.00 N
ATOM 11873 CA GLY A 744 50.948 65.186 80.264 1.00 0.00 C
ATOM 11874 C GLY A 744 49.980 65.710 81.332 1.00 0.00 C
ATOM 11875 O GLY A 744 49.469 64.936 82.161 1.00 0.00 O
ATOM 11876 H GLY A 744 50.470 63.135 80.826 1.00 0.00 H
ATOM 11877 HA2 GLY A 744 51.942 65.538 80.540 1.00 0.00 H
ATOM 11878 HA3 GLY A 744 50.566 65.549 79.310 1.00 0.00 H
ATOM 11879 N SER A 745 49.952 67.022 81.401 1.00 0.00 N
ATOM 11880 CA SER A 745 49.069 67.855 82.189 1.00 0.00 C
ATOM 11881 C SER A 745 48.825 69.246 81.578 1.00 0.00 C
ATOM 11882 O SER A 745 49.686 69.658 80.827 1.00 0.00 O
ATOM 11883 CB SER A 745 49.688 68.097 83.602 1.00 0.00 C
ATOM 11884 OG SER A 745 48.714 68.744 84.338 1.00 0.00 O
ATOM 11885 H SER A 745 50.408 67.591 80.702 1.00 0.00 H
ATOM 11886 HA SER A 745 48.080 67.407 82.285 1.00 0.00 H
ATOM 11887 HB2 SER A 745 49.934 67.149 84.081 1.00 0.00 H
ATOM 11888 HB3 SER A 745 50.552 68.761 83.564 1.00 0.00 H
ATOM 11889 HG SER A 745 48.826 69.686 84.190 1.00 0.00 H
ATOM 11890 N GLY A 746 47.667 69.886 81.813 1.00 0.00 N
ATOM 11891 CA GLY A 746 47.435 71.322 81.815 1.00 0.00 C
ATOM 11892 C GLY A 746 48.210 72.078 82.916 1.00 0.00 C
ATOM 11893 O GLY A 746 48.829 71.487 83.842 1.00 0.00 O
ATOM 11894 H GLY A 746 46.976 69.337 82.304 1.00 0.00 H
ATOM 11895 HA2 GLY A 746 47.635 71.725 80.822 1.00 0.00 H
ATOM 11896 HA3 GLY A 746 46.370 71.523 81.930 1.00 0.00 H
ATOM 11897 N GLY A 747 48.239 73.375 82.801 1.00 0.00 N
ATOM 11898 CA GLY A 747 49.287 74.228 83.487 1.00 0.00 C
ATOM 11899 C GLY A 747 50.716 73.772 83.098 1.00 0.00 C
ATOM 11900 O GLY A 747 51.062 73.729 81.900 1.00 0.00 O
ATOM 11901 H GLY A 747 47.613 73.910 82.214 1.00 0.00 H
ATOM 11902 HA2 GLY A 747 49.064 75.283 83.324 1.00 0.00 H
ATOM 11903 HA3 GLY A 747 48.987 74.101 84.527 1.00 0.00 H
ATOM 11904 N SER A 748 51.509 73.342 84.050 1.00 0.00 N
ATOM 11905 CA SER A 748 52.870 72.783 83.878 1.00 0.00 C
ATOM 11906 C SER A 748 53.956 73.708 83.519 1.00 0.00 C
ATOM 11907 O SER A 748 55.071 73.309 83.372 1.00 0.00 O
ATOM 11908 CB SER A 748 52.817 71.576 82.892 1.00 0.00 C
ATOM 11909 OG SER A 748 51.766 70.777 83.341 1.00 0.00 O
ATOM 11910 H SER A 748 51.081 73.115 84.937 1.00 0.00 H
ATOM 11911 HA SER A 748 53.257 72.461 84.844 1.00 0.00 H
ATOM 11912 HB2 SER A 748 52.618 71.866 81.860 1.00 0.00 H
ATOM 11913 HB3 SER A 748 53.748 71.009 82.869 1.00 0.00 H
ATOM 11914 HG SER A 748 50.957 71.278 83.462 1.00 0.00 H
ATOM 11915 N LYS A 749 53.685 75.040 83.495 1.00 0.00 N
ATOM 11916 CA LYS A 749 54.655 76.054 83.165 1.00 0.00 C
ATOM 11917 C LYS A 749 55.825 76.057 84.171 1.00 0.00 C
ATOM 11918 O LYS A 749 55.648 75.808 85.348 1.00 0.00 O
ATOM 11919 CB LYS A 749 53.897 77.372 82.799 1.00 0.00 C
ATOM 11920 CG LYS A 749 53.027 77.305 81.555 1.00 0.00 C
ATOM 11921 CD LYS A 749 52.216 78.628 81.319 1.00 0.00 C
ATOM 11922 CE LYS A 749 51.003 78.436 80.346 1.00 0.00 C
ATOM 11923 NZ LYS A 749 51.540 77.756 79.105 1.00 0.00 N1+
ATOM 11924 H LYS A 749 52.736 75.381 83.451 1.00 0.00 H
ATOM 11925 HA LYS A 749 55.167 75.695 82.272 1.00 0.00 H
ATOM 11926 HB2 LYS A 749 53.351 77.742 83.667 1.00 0.00 H
ATOM 11927 HB3 LYS A 749 54.591 78.160 82.507 1.00 0.00 H
ATOM 11928 HG2 LYS A 749 53.563 77.049 80.641 1.00 0.00 H
ATOM 11929 HG3 LYS A 749 52.291 76.511 81.683 1.00 0.00 H
ATOM 11930 HD2 LYS A 749 51.854 79.019 82.270 1.00 0.00 H
ATOM 11931 HD3 LYS A 749 52.983 79.307 80.945 1.00 0.00 H
ATOM 11932 HE2 LYS A 749 50.263 77.825 80.863 1.00 0.00 H
ATOM 11933 HE3 LYS A 749 50.605 79.371 79.953 1.00 0.00 H
ATOM 11934 HZ1 LYS A 749 50.917 77.922 78.327 1.00 0.00 H
ATOM 11935 HZ2 LYS A 749 52.443 78.009 78.730 1.00 0.00 H
ATOM 11936 HZ3 LYS A 749 51.648 76.757 79.206 1.00 0.00 H
ATOM 11937 N SER A 750 57.055 76.456 83.768 1.00 0.00 N
ATOM 11938 CA SER A 750 58.277 76.416 84.514 1.00 0.00 C
ATOM 11939 C SER A 750 58.221 77.752 85.335 1.00 0.00 C
ATOM 11940 O SER A 750 57.674 78.775 84.911 1.00 0.00 O
ATOM 11941 CB SER A 750 59.461 76.147 83.644 1.00 0.00 C
ATOM 11942 OG SER A 750 59.169 74.970 82.873 1.00 0.00 O
ATOM 11943 H SER A 750 57.082 76.698 82.788 1.00 0.00 H
ATOM 11944 HA SER A 750 58.110 75.625 85.245 1.00 0.00 H
ATOM 11945 HB2 SER A 750 59.600 77.002 82.982 1.00 0.00 H
ATOM 11946 HB3 SER A 750 60.305 76.057 84.327 1.00 0.00 H
ATOM 11947 HG SER A 750 59.780 74.947 82.133 1.00 0.00 H
ATOM 11948 N ILE A 751 58.805 77.768 86.537 1.00 0.00 N
ATOM 11949 CA ILE A 751 59.040 78.920 87.420 1.00 0.00 C
ATOM 11950 C ILE A 751 60.443 79.425 87.085 1.00 0.00 C
ATOM 11951 O ILE A 751 61.379 78.605 86.846 1.00 0.00 O
ATOM 11952 CB ILE A 751 58.945 78.371 88.846 1.00 0.00 C
ATOM 11953 CG1 ILE A 751 57.454 78.576 89.329 1.00 0.00 C
ATOM 11954 CG2 ILE A 751 59.824 79.221 89.849 1.00 0.00 C
ATOM 11955 CD1 ILE A 751 56.465 77.478 88.865 1.00 0.00 C
ATOM 11956 H ILE A 751 59.280 76.896 86.722 1.00 0.00 H
ATOM 11957 HA ILE A 751 58.297 79.717 87.382 1.00 0.00 H
ATOM 11958 HB ILE A 751 59.278 77.333 88.860 1.00 0.00 H
ATOM 11959 HG12 ILE A 751 57.436 78.431 90.409 1.00 0.00 H
ATOM 11960 HG13 ILE A 751 57.195 79.606 89.082 1.00 0.00 H
ATOM 11961 HG21 ILE A 751 60.847 79.409 89.524 1.00 0.00 H
ATOM 11962 HG22 ILE A 751 59.368 80.195 90.023 1.00 0.00 H
ATOM 11963 HG23 ILE A 751 59.862 78.711 90.811 1.00 0.00 H
ATOM 11964 HD11 ILE A 751 56.252 77.619 87.805 1.00 0.00 H
ATOM 11965 HD12 ILE A 751 56.903 76.488 88.991 1.00 0.00 H
ATOM 11966 HD13 ILE A 751 55.565 77.422 89.478 1.00 0.00 H
ATOM 11967 N SER A 752 60.569 80.763 87.041 1.00 0.00 N
ATOM 11968 CA SER A 752 61.917 81.397 87.133 1.00 0.00 C
ATOM 11969 C SER A 752 61.829 82.752 87.870 1.00 0.00 C
ATOM 11970 O SER A 752 60.756 83.335 88.040 1.00 0.00 O
ATOM 11971 CB SER A 752 62.380 81.606 85.656 1.00 0.00 C
ATOM 11972 OG SER A 752 63.763 82.046 85.670 1.00 0.00 O
ATOM 11973 H SER A 752 59.769 81.371 87.137 1.00 0.00 H
ATOM 11974 HA SER A 752 62.692 80.870 87.689 1.00 0.00 H
ATOM 11975 HB2 SER A 752 62.286 80.643 85.153 1.00 0.00 H
ATOM 11976 HB3 SER A 752 61.780 82.275 85.040 1.00 0.00 H
ATOM 11977 HG SER A 752 64.234 81.211 85.714 1.00 0.00 H
ATOM 11978 N SER A 753 62.949 83.274 88.430 1.00 0.00 N
ATOM 11979 CA SER A 753 62.895 84.570 89.164 1.00 0.00 C
ATOM 11980 C SER A 753 62.598 85.766 88.282 1.00 0.00 C
ATOM 11981 O SER A 753 62.838 85.800 87.069 1.00 0.00 O
ATOM 11982 CB SER A 753 64.166 84.725 90.012 1.00 0.00 C
ATOM 11983 OG SER A 753 65.239 84.938 89.184 1.00 0.00 O
ATOM 11984 H SER A 753 63.794 82.761 88.223 1.00 0.00 H
ATOM 11985 HA SER A 753 62.058 84.305 89.810 1.00 0.00 H
ATOM 11986 HB2 SER A 753 64.010 85.568 90.686 1.00 0.00 H
ATOM 11987 HB3 SER A 753 64.266 83.823 90.614 1.00 0.00 H
ATOM 11988 HG SER A 753 65.470 84.075 88.832 1.00 0.00 H
ATOM 11989 N THR A 754 61.986 86.715 88.950 1.00 0.00 N
ATOM 11990 CA THR A 754 61.703 87.989 88.330 1.00 0.00 C
ATOM 11991 C THR A 754 62.670 88.991 88.891 1.00 0.00 C
ATOM 11992 O THR A 754 62.905 88.978 90.092 1.00 0.00 O
ATOM 11993 CB THR A 754 60.289 88.347 88.712 1.00 0.00 C
ATOM 11994 CG2 THR A 754 59.937 89.812 88.681 1.00 0.00 C
ATOM 11995 OG1 THR A 754 59.240 87.663 88.020 1.00 0.00 O
ATOM 11996 H THR A 754 61.920 86.635 89.955 1.00 0.00 H
ATOM 11997 HA THR A 754 61.538 88.039 87.253 1.00 0.00 H
ATOM 11998 HB THR A 754 60.203 88.116 89.774 1.00 0.00 H
ATOM 11999 HG1 THR A 754 58.443 87.984 88.447 1.00 0.00 H
ATOM 12000 HG21 THR A 754 60.206 90.216 87.704 1.00 0.00 H
ATOM 12001 HG22 THR A 754 58.858 89.875 88.822 1.00 0.00 H
ATOM 12002 HG23 THR A 754 60.247 90.407 89.540 1.00 0.00 H
ATOM 12003 N MET A 755 63.179 89.894 88.043 1.00 0.00 N
ATOM 12004 CA MET A 755 63.811 91.129 88.545 1.00 0.00 C
ATOM 12005 C MET A 755 63.499 92.404 87.787 1.00 0.00 C
ATOM 12006 O MET A 755 63.147 92.351 86.599 1.00 0.00 O
ATOM 12007 CB MET A 755 65.369 90.709 88.625 1.00 0.00 C
ATOM 12008 CG MET A 755 66.036 90.622 87.311 1.00 0.00 C
ATOM 12009 SD MET A 755 67.855 90.245 87.181 1.00 0.00 S
ATOM 12010 CE MET A 755 68.489 91.880 87.624 1.00 0.00 C
ATOM 12011 H MET A 755 63.035 89.775 87.051 1.00 0.00 H
ATOM 12012 HA MET A 755 63.415 91.307 89.544 1.00 0.00 H
ATOM 12013 HB2 MET A 755 65.747 91.552 89.204 1.00 0.00 H
ATOM 12014 HB3 MET A 755 65.492 89.799 89.211 1.00 0.00 H
ATOM 12015 HG2 MET A 755 65.595 89.878 86.648 1.00 0.00 H
ATOM 12016 HG3 MET A 755 65.875 91.564 86.787 1.00 0.00 H
ATOM 12017 HE1 MET A 755 68.594 91.827 88.708 1.00 0.00 H
ATOM 12018 HE2 MET A 755 69.373 91.999 86.997 1.00 0.00 H
ATOM 12019 HE3 MET A 755 67.734 92.602 87.311 1.00 0.00 H
ATOM 12020 N SER A 756 63.627 93.555 88.460 1.00 0.00 N
ATOM 12021 CA SER A 756 63.486 94.945 88.012 1.00 0.00 C
ATOM 12022 C SER A 756 64.804 95.524 87.435 1.00 0.00 C
ATOM 12023 O SER A 756 65.797 94.795 87.188 1.00 0.00 O
ATOM 12024 CB SER A 756 63.147 95.692 89.342 1.00 0.00 C
ATOM 12025 OG SER A 756 64.316 95.666 90.225 1.00 0.00 O
ATOM 12026 H SER A 756 63.689 93.497 89.467 1.00 0.00 H
ATOM 12027 HA SER A 756 62.651 94.995 87.314 1.00 0.00 H
ATOM 12028 HB2 SER A 756 62.934 96.743 89.148 1.00 0.00 H
ATOM 12029 HB3 SER A 756 62.378 95.086 89.821 1.00 0.00 H
ATOM 12030 HG SER A 756 64.965 96.263 89.847 1.00 0.00 H
ATOM 12031 N GLU A 757 64.856 96.783 87.060 1.00 0.00 N
ATOM 12032 CA GLU A 757 66.106 97.554 86.948 1.00 0.00 C
ATOM 12033 C GLU A 757 66.954 97.465 88.258 1.00 0.00 C
ATOM 12034 O GLU A 757 66.422 97.155 89.313 1.00 0.00 O
ATOM 12035 CB GLU A 757 65.806 98.975 86.598 1.00 0.00 C
ATOM 12036 CG GLU A 757 65.039 99.847 87.658 1.00 0.00 C
ATOM 12037 CD GLU A 757 63.542 99.757 87.461 1.00 0.00 C
ATOM 12038 OE1 GLU A 757 62.881 100.787 87.643 1.00 0.00 O
ATOM 12039 OE2 GLU A 757 62.943 98.697 87.289 1.00 0.00 O1-
ATOM 12040 H GLU A 757 64.020 97.348 87.103 1.00 0.00 H
ATOM 12041 HA GLU A 757 66.755 97.253 86.126 1.00 0.00 H
ATOM 12042 HB2 GLU A 757 66.710 99.539 86.370 1.00 0.00 H
ATOM 12043 HB3 GLU A 757 65.224 99.035 85.679 1.00 0.00 H
ATOM 12044 HG2 GLU A 757 65.356 99.768 88.698 1.00 0.00 H
ATOM 12045 HG3 GLU A 757 65.353 100.863 87.421 1.00 0.00 H
ATOM 12046 N THR A 758 68.285 97.677 88.194 1.00 0.00 N
ATOM 12047 CA THR A 758 69.063 98.099 89.347 1.00 0.00 C
ATOM 12048 C THR A 758 68.869 99.604 89.748 1.00 0.00 C
ATOM 12049 O THR A 758 68.900 100.445 88.899 1.00 0.00 O
ATOM 12050 CB THR A 758 70.544 97.754 89.118 1.00 0.00 C
ATOM 12051 CG2 THR A 758 71.419 97.888 90.318 1.00 0.00 C
ATOM 12052 OG1 THR A 758 70.667 96.364 88.667 1.00 0.00 O
ATOM 12053 H THR A 758 68.588 97.659 87.231 1.00 0.00 H
ATOM 12054 HA THR A 758 68.588 97.483 90.111 1.00 0.00 H
ATOM 12055 HB THR A 758 70.898 98.405 88.318 1.00 0.00 H
ATOM 12056 HG1 THR A 758 70.251 95.825 89.344 1.00 0.00 H
ATOM 12057 HG21 THR A 758 71.527 98.910 90.680 1.00 0.00 H
ATOM 12058 HG22 THR A 758 71.057 97.338 91.188 1.00 0.00 H
ATOM 12059 HG23 THR A 758 72.373 97.495 89.967 1.00 0.00 H
ATOM 12060 N SER A 759 68.806 99.866 91.033 1.00 0.00 N
ATOM 12061 CA SER A 759 68.852 101.172 91.668 1.00 0.00 C
ATOM 12062 C SER A 759 69.943 101.220 92.736 1.00 0.00 C
ATOM 12063 O SER A 759 70.436 100.189 93.266 1.00 0.00 O
ATOM 12064 CB SER A 759 67.560 101.384 92.377 1.00 0.00 C
ATOM 12065 OG SER A 759 67.383 102.575 93.115 1.00 0.00 O
ATOM 12066 H SER A 759 69.107 99.195 91.725 1.00 0.00 H
ATOM 12067 HA SER A 759 68.923 101.968 90.927 1.00 0.00 H
ATOM 12068 HB2 SER A 759 66.766 101.346 91.631 1.00 0.00 H
ATOM 12069 HB3 SER A 759 67.399 100.584 93.101 1.00 0.00 H
ATOM 12070 HG SER A 759 67.862 102.588 93.947 1.00 0.00 H
ATOM 12071 N ALA A 760 70.262 102.450 93.123 1.00 0.00 N
ATOM 12072 CA ALA A 760 70.909 102.870 94.367 1.00 0.00 C
ATOM 12073 C ALA A 760 69.988 102.870 95.593 1.00 0.00 C
ATOM 12074 O ALA A 760 68.787 102.739 95.406 1.00 0.00 O
ATOM 12075 CB ALA A 760 71.615 104.280 94.184 1.00 0.00 C
ATOM 12076 H ALA A 760 69.648 103.111 92.670 1.00 0.00 H
ATOM 12077 HA ALA A 760 71.720 102.163 94.543 1.00 0.00 H
ATOM 12078 HB1 ALA A 760 70.848 105.048 94.084 1.00 0.00 H
ATOM 12079 HB2 ALA A 760 72.272 104.409 95.045 1.00 0.00 H
ATOM 12080 HB3 ALA A 760 72.284 104.270 93.325 1.00 0.00 H
ATOM 12081 N THR A 761 70.443 103.091 96.843 1.00 0.00 N
ATOM 12082 CA THR A 761 69.546 103.126 97.977 1.00 0.00 C
ATOM 12083 C THR A 761 70.109 103.885 99.244 1.00 0.00 C
ATOM 12084 O THR A 761 71.304 103.719 99.553 1.00 0.00 O
ATOM 12085 CB THR A 761 68.884 101.757 98.315 1.00 0.00 C
ATOM 12086 CG2 THR A 761 69.803 100.630 98.720 1.00 0.00 C
ATOM 12087 OG1 THR A 761 67.939 102.012 99.298 1.00 0.00 O
ATOM 12088 H THR A 761 71.433 103.266 96.932 1.00 0.00 H
ATOM 12089 HA THR A 761 68.681 103.764 97.798 1.00 0.00 H
ATOM 12090 HB THR A 761 68.421 101.392 97.399 1.00 0.00 H
ATOM 12091 HG1 THR A 761 67.253 102.607 98.984 1.00 0.00 H
ATOM 12092 HG21 THR A 761 69.152 99.755 98.726 1.00 0.00 H
ATOM 12093 HG22 THR A 761 70.619 100.540 98.004 1.00 0.00 H
ATOM 12094 HG23 THR A 761 70.279 100.832 99.679 1.00 0.00 H
ATOM 12095 N TYR A 762 69.259 104.810 99.786 1.00 0.00 N
ATOM 12096 CA TYR A 762 69.617 105.812 100.763 1.00 0.00 C
ATOM 12097 C TYR A 762 68.664 105.826 102.026 1.00 0.00 C
ATOM 12098 O TYR A 762 67.465 105.601 101.890 1.00 0.00 O
ATOM 12099 CB TYR A 762 69.769 107.231 100.100 1.00 0.00 C
ATOM 12100 CG TYR A 762 71.087 107.353 99.483 1.00 0.00 C
ATOM 12101 CD1 TYR A 762 71.353 106.889 98.184 1.00 0.00 C
ATOM 12102 CD2 TYR A 762 72.129 107.919 100.258 1.00 0.00 C
ATOM 12103 CE1 TYR A 762 72.612 106.980 97.612 1.00 0.00 C
ATOM 12104 CE2 TYR A 762 73.426 108.035 99.669 1.00 0.00 C
ATOM 12105 CZ TYR A 762 73.723 107.440 98.374 1.00 0.00 C
ATOM 12106 OH TYR A 762 75.037 107.397 97.902 1.00 0.00 O
ATOM 12107 H TYR A 762 68.343 104.959 99.385 1.00 0.00 H
ATOM 12108 HA TYR A 762 70.597 105.545 101.159 1.00 0.00 H
ATOM 12109 HB2 TYR A 762 69.012 107.459 99.349 1.00 0.00 H
ATOM 12110 HB3 TYR A 762 69.675 108.074 100.785 1.00 0.00 H
ATOM 12111 HD1 TYR A 762 70.492 106.405 97.747 1.00 0.00 H
ATOM 12112 HD2 TYR A 762 71.958 108.177 101.293 1.00 0.00 H
ATOM 12113 HE1 TYR A 762 72.875 106.653 96.617 1.00 0.00 H
ATOM 12114 HE2 TYR A 762 74.273 108.404 100.228 1.00 0.00 H
ATOM 12115 HH TYR A 762 75.198 106.778 97.186 1.00 0.00 H
ATOM 12116 N PRO A 763 69.124 106.151 103.297 1.00 0.00 N
ATOM 12117 CA PRO A 763 68.270 106.245 104.423 1.00 0.00 C
ATOM 12118 C PRO A 763 67.558 107.603 104.441 1.00 0.00 C
ATOM 12119 O PRO A 763 68.146 108.683 104.313 1.00 0.00 O
ATOM 12120 CB PRO A 763 69.220 106.114 105.647 1.00 0.00 C
ATOM 12121 CG PRO A 763 70.521 106.826 105.174 1.00 0.00 C
ATOM 12122 CD PRO A 763 70.478 106.536 103.676 1.00 0.00 C
ATOM 12123 HA PRO A 763 67.541 105.435 104.459 1.00 0.00 H
ATOM 12124 HB2 PRO A 763 68.794 106.548 106.552 1.00 0.00 H
ATOM 12125 HB3 PRO A 763 69.474 105.066 105.800 1.00 0.00 H
ATOM 12126 HG2 PRO A 763 70.575 107.888 105.412 1.00 0.00 H
ATOM 12127 HG3 PRO A 763 71.298 106.221 105.640 1.00 0.00 H
ATOM 12128 HD2 PRO A 763 70.737 107.472 103.180 1.00 0.00 H
ATOM 12129 HD3 PRO A 763 71.181 105.790 103.306 1.00 0.00 H
ATOM 12130 N VAL A 764 66.279 107.578 104.723 1.00 0.00 N
ATOM 12131 CA VAL A 764 65.431 108.720 104.939 1.00 0.00 C
ATOM 12132 C VAL A 764 65.793 109.473 106.254 1.00 0.00 C
ATOM 12133 O VAL A 764 66.254 108.832 107.194 1.00 0.00 O
ATOM 12134 CB VAL A 764 63.936 108.391 105.003 1.00 0.00 C
ATOM 12135 CG1 VAL A 764 63.016 109.569 105.237 1.00 0.00 C
ATOM 12136 CG2 VAL A 764 63.440 107.579 103.756 1.00 0.00 C
ATOM 12137 H VAL A 764 65.888 106.649 104.796 1.00 0.00 H
ATOM 12138 HA VAL A 764 65.630 109.387 104.100 1.00 0.00 H
ATOM 12139 HB VAL A 764 63.761 107.799 105.902 1.00 0.00 H
ATOM 12140 HG11 VAL A 764 62.077 109.026 105.348 1.00 0.00 H
ATOM 12141 HG12 VAL A 764 63.248 110.060 106.182 1.00 0.00 H
ATOM 12142 HG13 VAL A 764 62.841 110.168 104.344 1.00 0.00 H
ATOM 12143 HG21 VAL A 764 62.360 107.437 103.805 1.00 0.00 H
ATOM 12144 HG22 VAL A 764 63.505 108.245 102.896 1.00 0.00 H
ATOM 12145 HG23 VAL A 764 64.073 106.715 103.552 1.00 0.00 H
ATOM 12146 N ASP A 765 65.741 110.800 106.238 1.00 0.00 N
ATOM 12147 CA ASP A 765 66.202 111.655 107.394 1.00 0.00 C
ATOM 12148 C ASP A 765 65.243 111.476 108.635 1.00 0.00 C
ATOM 12149 O ASP A 765 63.988 111.530 108.550 1.00 0.00 O
ATOM 12150 CB ASP A 765 66.511 113.064 106.886 1.00 0.00 C
ATOM 12151 CG ASP A 765 67.896 113.096 106.230 1.00 0.00 C
ATOM 12152 OD1 ASP A 765 68.327 114.261 106.120 1.00 0.00 O
ATOM 12153 OD2 ASP A 765 68.438 112.034 105.788 1.00 0.00 O1-
ATOM 12154 H ASP A 765 65.431 111.322 105.431 1.00 0.00 H
ATOM 12155 HA ASP A 765 67.166 111.280 107.740 1.00 0.00 H
ATOM 12156 HB2 ASP A 765 65.729 113.292 106.161 1.00 0.00 H
ATOM 12157 HB3 ASP A 765 66.445 113.796 107.691 1.00 0.00 H
ATOM 12158 N ASN A 766 65.734 111.419 109.844 1.00 0.00 N
ATOM 12159 CA ASN A 766 65.172 111.008 111.099 1.00 0.00 C
ATOM 12160 C ASN A 766 64.200 109.809 111.015 1.00 0.00 C
ATOM 12161 O ASN A 766 63.255 109.770 111.797 1.00 0.00 O
ATOM 12162 CB ASN A 766 64.512 112.297 111.727 1.00 0.00 C
ATOM 12163 CG ASN A 766 65.358 113.545 111.913 1.00 0.00 C
ATOM 12164 ND2 ASN A 766 65.088 114.733 111.327 1.00 0.00 N
ATOM 12165 OD1 ASN A 766 66.249 113.490 112.689 1.00 0.00 O
ATOM 12166 H ASN A 766 66.744 111.458 109.846 1.00 0.00 H
ATOM 12167 HA ASN A 766 66.040 110.754 111.708 1.00 0.00 H
ATOM 12168 HB2 ASN A 766 63.691 112.625 111.090 1.00 0.00 H
ATOM 12169 HB3 ASN A 766 64.147 112.036 112.721 1.00 0.00 H
ATOM 12170 HD21 ASN A 766 65.782 115.462 111.406 1.00 0.00 H
ATOM 12171 HD22 ASN A 766 64.301 114.752 110.694 1.00 0.00 H
ATOM 12172 N SER A 767 64.367 108.950 110.026 1.00 0.00 N
ATOM 12173 CA SER A 767 63.450 107.869 109.833 1.00 0.00 C
ATOM 12174 C SER A 767 64.114 106.449 109.690 1.00 0.00 C
ATOM 12175 O SER A 767 65.270 106.334 109.383 1.00 0.00 O
ATOM 12176 CB SER A 767 62.754 108.199 108.549 1.00 0.00 C
ATOM 12177 OG SER A 767 61.771 107.173 108.199 1.00 0.00 O
ATOM 12178 H SER A 767 65.093 109.154 109.354 1.00 0.00 H
ATOM 12179 HA SER A 767 62.739 107.895 110.658 1.00 0.00 H
ATOM 12180 HB2 SER A 767 62.215 109.145 108.511 1.00 0.00 H
ATOM 12181 HB3 SER A 767 63.487 108.173 107.742 1.00 0.00 H
ATOM 12182 HG SER A 767 60.933 107.613 108.361 1.00 0.00 H
ATOM 12183 N HIE A 768 63.379 105.337 110.034 1.00 0.00 N
ATOM 12184 CA HIE A 768 63.696 104.000 109.770 1.00 0.00 C
ATOM 12185 C HIE A 768 63.361 103.570 108.352 1.00 0.00 C
ATOM 12186 O HIE A 768 63.837 102.554 107.943 1.00 0.00 O
ATOM 12187 CB HIE A 768 62.998 103.123 110.780 1.00 0.00 C
ATOM 12188 CG HIE A 768 63.470 103.336 112.185 1.00 0.00 C
ATOM 12189 CD2 HIE A 768 64.443 104.134 112.723 1.00 0.00 C
ATOM 12190 ND1 HIE A 768 63.134 102.451 113.197 1.00 0.00 N
ATOM 12191 CE1 HIE A 768 63.733 102.816 114.334 1.00 0.00 C
ATOM 12192 NE2 HIE A 768 64.568 103.788 114.027 1.00 0.00 N
ATOM 12193 H HIE A 768 62.428 105.541 110.306 1.00 0.00 H
ATOM 12194 HA HIE A 768 64.743 103.765 109.958 1.00 0.00 H
ATOM 12195 HB2 HIE A 768 61.913 103.227 110.819 1.00 0.00 H
ATOM 12196 HB3 HIE A 768 63.216 102.066 110.631 1.00 0.00 H
ATOM 12197 HD2 HIE A 768 64.953 104.874 112.124 1.00 0.00 H
ATOM 12198 HE1 HIE A 768 63.671 102.335 115.299 1.00 0.00 H
ATOM 12199 HE2 HIE A 768 65.029 104.310 114.759 1.00 0.00 H
ATOM 12200 N PHE A 769 62.617 104.341 107.517 1.00 0.00 N
ATOM 12201 CA PHE A 769 62.455 104.021 106.133 1.00 0.00 C
ATOM 12202 C PHE A 769 63.714 104.275 105.308 1.00 0.00 C
ATOM 12203 O PHE A 769 64.391 105.219 105.502 1.00 0.00 O
ATOM 12204 CB PHE A 769 61.162 104.643 105.578 1.00 0.00 C
ATOM 12205 CG PHE A 769 59.961 103.905 106.105 1.00 0.00 C
ATOM 12206 CD1 PHE A 769 59.505 102.759 105.470 1.00 0.00 C
ATOM 12207 CD2 PHE A 769 59.349 104.438 107.220 1.00 0.00 C
ATOM 12208 CE1 PHE A 769 58.292 102.165 105.926 1.00 0.00 C
ATOM 12209 CE2 PHE A 769 58.275 103.720 107.812 1.00 0.00 C
ATOM 12210 CZ PHE A 769 57.756 102.643 107.165 1.00 0.00 C
ATOM 12211 H PHE A 769 62.176 105.151 107.929 1.00 0.00 H
ATOM 12212 HA PHE A 769 62.295 102.943 106.116 1.00 0.00 H
ATOM 12213 HB2 PHE A 769 60.981 105.690 105.821 1.00 0.00 H
ATOM 12214 HB3 PHE A 769 61.210 104.384 104.520 1.00 0.00 H
ATOM 12215 HD1 PHE A 769 60.019 102.371 104.603 1.00 0.00 H
ATOM 12216 HD2 PHE A 769 59.747 105.355 107.629 1.00 0.00 H
ATOM 12217 HE1 PHE A 769 57.933 101.261 105.455 1.00 0.00 H
ATOM 12218 HE2 PHE A 769 57.835 103.953 108.770 1.00 0.00 H
ATOM 12219 HZ PHE A 769 56.880 102.201 107.615 1.00 0.00 H
ATOM 12220 N TRP A 770 64.024 103.456 104.245 1.00 0.00 N
ATOM 12221 CA TRP A 770 65.022 103.731 103.210 1.00 0.00 C
ATOM 12222 C TRP A 770 64.273 104.126 101.880 1.00 0.00 C
ATOM 12223 O TRP A 770 63.245 103.547 101.554 1.00 0.00 O
ATOM 12224 CB TRP A 770 65.950 102.530 103.094 1.00 0.00 C
ATOM 12225 CG TRP A 770 67.064 102.536 104.098 1.00 0.00 C
ATOM 12226 CD1 TRP A 770 66.864 102.433 105.458 1.00 0.00 C
ATOM 12227 CD2 TRP A 770 68.489 102.521 103.922 1.00 0.00 C
ATOM 12228 CE2 TRP A 770 69.124 102.404 105.213 1.00 0.00 C
ATOM 12229 CE3 TRP A 770 69.288 102.782 102.853 1.00 0.00 C
ATOM 12230 NE1 TRP A 770 68.063 102.262 106.101 1.00 0.00 N
ATOM 12231 CZ2 TRP A 770 70.501 102.380 105.304 1.00 0.00 C
ATOM 12232 CZ3 TRP A 770 70.705 102.835 102.892 1.00 0.00 C
ATOM 12233 CH2 TRP A 770 71.334 102.658 104.199 1.00 0.00 C
ATOM 12234 H TRP A 770 63.506 102.602 104.092 1.00 0.00 H
ATOM 12235 HA TRP A 770 65.666 104.554 103.519 1.00 0.00 H
ATOM 12236 HB2 TRP A 770 65.378 101.604 103.059 1.00 0.00 H
ATOM 12237 HB3 TRP A 770 66.402 102.691 102.115 1.00 0.00 H
ATOM 12238 HD1 TRP A 770 65.864 102.372 105.861 1.00 0.00 H
ATOM 12239 HE1 TRP A 770 68.143 102.386 107.100 1.00 0.00 H
ATOM 12240 HE3 TRP A 770 68.814 102.916 101.892 1.00 0.00 H
ATOM 12241 HZ2 TRP A 770 70.926 102.259 106.289 1.00 0.00 H
ATOM 12242 HZ3 TRP A 770 71.303 102.983 102.006 1.00 0.00 H
ATOM 12243 HH2 TRP A 770 72.410 102.688 104.287 1.00 0.00 H
ATOM 12244 N LYS A 771 64.829 105.095 101.149 1.00 0.00 N
ATOM 12245 CA LYS A 771 64.352 105.437 99.789 1.00 0.00 C
ATOM 12246 C LYS A 771 64.979 104.649 98.637 1.00 0.00 C
ATOM 12247 O LYS A 771 66.144 104.195 98.799 1.00 0.00 O
ATOM 12248 CB LYS A 771 64.581 106.950 99.638 1.00 0.00 C
ATOM 12249 CG LYS A 771 63.856 107.489 98.359 1.00 0.00 C
ATOM 12250 CD LYS A 771 64.022 108.967 98.144 1.00 0.00 C
ATOM 12251 CE LYS A 771 65.356 109.557 98.437 1.00 0.00 C
ATOM 12252 NZ LYS A 771 65.387 110.966 98.060 1.00 0.00 N1+
ATOM 12253 H LYS A 771 65.689 105.544 101.431 1.00 0.00 H
ATOM 12254 HA LYS A 771 63.274 105.285 99.844 1.00 0.00 H
ATOM 12255 HB2 LYS A 771 64.149 107.346 100.557 1.00 0.00 H
ATOM 12256 HB3 LYS A 771 65.657 107.118 99.672 1.00 0.00 H
ATOM 12257 HG2 LYS A 771 64.400 107.113 97.493 1.00 0.00 H
ATOM 12258 HG3 LYS A 771 62.824 107.139 98.388 1.00 0.00 H
ATOM 12259 HD2 LYS A 771 63.852 109.322 97.128 1.00 0.00 H
ATOM 12260 HD3 LYS A 771 63.242 109.484 98.702 1.00 0.00 H
ATOM 12261 HE2 LYS A 771 65.671 109.464 99.476 1.00 0.00 H
ATOM 12262 HE3 LYS A 771 66.168 109.000 97.969 1.00 0.00 H
ATOM 12263 HZ1 LYS A 771 65.061 111.594 98.781 1.00 0.00 H
ATOM 12264 HZ2 LYS A 771 66.314 111.288 97.824 1.00 0.00 H
ATOM 12265 HZ3 LYS A 771 64.846 111.223 97.247 1.00 0.00 H
ATOM 12266 N HIE A 772 64.307 104.328 97.560 1.00 0.00 N
ATOM 12267 CA HIE A 772 64.887 103.810 96.298 1.00 0.00 C
ATOM 12268 C HIE A 772 64.082 104.462 95.053 1.00 0.00 C
ATOM 12269 O HIE A 772 63.062 105.163 95.258 1.00 0.00 O
ATOM 12270 CB HIE A 772 64.831 102.262 96.269 1.00 0.00 C
ATOM 12271 CG HIE A 772 63.349 101.830 96.033 1.00 0.00 C
ATOM 12272 CD2 HIE A 772 62.482 101.454 96.993 1.00 0.00 C
ATOM 12273 ND1 HIE A 772 62.663 101.749 94.845 1.00 0.00 N
ATOM 12274 CE1 HIE A 772 61.425 101.306 95.145 1.00 0.00 C
ATOM 12275 NE2 HIE A 772 61.317 101.083 96.416 1.00 0.00 N
ATOM 12276 H HIE A 772 63.330 104.586 97.547 1.00 0.00 H
ATOM 12277 HA HIE A 772 65.885 104.226 96.162 1.00 0.00 H
ATOM 12278 HB2 HIE A 772 65.365 101.770 95.456 1.00 0.00 H
ATOM 12279 HB3 HIE A 772 65.180 101.960 97.256 1.00 0.00 H
ATOM 12280 HD2 HIE A 772 62.664 101.489 98.057 1.00 0.00 H
ATOM 12281 HE1 HIE A 772 60.639 101.227 94.410 1.00 0.00 H
ATOM 12282 HE2 HIE A 772 60.516 100.702 96.899 1.00 0.00 H
ATOM 12283 N TRP A 773 64.567 104.151 93.837 1.00 0.00 N
ATOM 12284 CA TRP A 773 64.090 104.723 92.620 1.00 0.00 C
ATOM 12285 C TRP A 773 63.440 103.685 91.730 1.00 0.00 C
ATOM 12286 O TRP A 773 62.867 104.105 90.707 1.00 0.00 O
ATOM 12287 CB TRP A 773 65.172 105.626 92.107 1.00 0.00 C
ATOM 12288 CG TRP A 773 65.505 106.847 92.959 1.00 0.00 C
ATOM 12289 CD1 TRP A 773 64.745 107.952 92.923 1.00 0.00 C
ATOM 12290 CD2 TRP A 773 66.465 107.009 93.999 1.00 0.00 C
ATOM 12291 CE2 TRP A 773 66.342 108.338 94.568 1.00 0.00 C
ATOM 12292 CE3 TRP A 773 67.530 106.239 94.374 1.00 0.00 C
ATOM 12293 NE1 TRP A 773 65.186 108.757 93.918 1.00 0.00 N
ATOM 12294 CZ2 TRP A 773 67.313 108.798 95.450 1.00 0.00 C
ATOM 12295 CZ3 TRP A 773 68.426 106.639 95.351 1.00 0.00 C
ATOM 12296 CH2 TRP A 773 68.288 107.892 95.898 1.00 0.00 C
ATOM 12297 H TRP A 773 65.468 103.715 93.701 1.00 0.00 H
ATOM 12298 HA TRP A 773 63.275 105.427 92.790 1.00 0.00 H
ATOM 12299 HB2 TRP A 773 66.053 105.005 91.944 1.00 0.00 H
ATOM 12300 HB3 TRP A 773 64.791 105.964 91.143 1.00 0.00 H
ATOM 12301 HD1 TRP A 773 63.933 108.241 92.273 1.00 0.00 H
ATOM 12302 HE1 TRP A 773 64.805 109.687 94.024 1.00 0.00 H
ATOM 12303 HE3 TRP A 773 67.821 105.386 93.778 1.00 0.00 H
ATOM 12304 HZ2 TRP A 773 67.263 109.821 95.791 1.00 0.00 H
ATOM 12305 HZ3 TRP A 773 69.262 105.984 95.547 1.00 0.00 H
ATOM 12306 HH2 TRP A 773 69.125 108.320 96.430 1.00 0.00 H
ATOM 12307 N ILE A 774 63.540 102.374 91.979 1.00 0.00 N
ATOM 12308 CA ILE A 774 62.891 101.262 91.260 1.00 0.00 C
ATOM 12309 C ILE A 774 61.399 101.509 91.015 1.00 0.00 C
ATOM 12310 O ILE A 774 60.727 101.948 91.921 1.00 0.00 O
ATOM 12311 CB ILE A 774 63.042 99.908 91.977 1.00 0.00 C
ATOM 12312 CG1 ILE A 774 64.536 99.621 92.340 1.00 0.00 C
ATOM 12313 CG2 ILE A 774 62.535 98.822 91.089 1.00 0.00 C
ATOM 12314 CD1 ILE A 774 64.737 98.369 93.321 1.00 0.00 C
ATOM 12315 H ILE A 774 63.901 102.153 92.897 1.00 0.00 H
ATOM 12316 HA ILE A 774 63.427 101.128 90.320 1.00 0.00 H
ATOM 12317 HB ILE A 774 62.454 100.044 92.885 1.00 0.00 H
ATOM 12318 HG12 ILE A 774 65.101 99.483 91.418 1.00 0.00 H
ATOM 12319 HG13 ILE A 774 64.942 100.557 92.724 1.00 0.00 H
ATOM 12320 HG21 ILE A 774 62.689 97.822 91.496 1.00 0.00 H
ATOM 12321 HG22 ILE A 774 61.490 99.015 90.847 1.00 0.00 H
ATOM 12322 HG23 ILE A 774 63.142 98.898 90.187 1.00 0.00 H
ATOM 12323 HD11 ILE A 774 64.708 97.389 92.844 1.00 0.00 H
ATOM 12324 HD12 ILE A 774 65.668 98.511 93.870 1.00 0.00 H
ATOM 12325 HD13 ILE A 774 63.898 98.325 94.016 1.00 0.00 H
ATOM 12326 N SER A 775 60.993 101.197 89.840 1.00 0.00 N
ATOM 12327 CA SER A 775 59.649 101.362 89.288 1.00 0.00 C
ATOM 12328 C SER A 775 58.584 100.436 89.841 1.00 0.00 C
ATOM 12329 O SER A 775 57.971 99.680 89.096 1.00 0.00 O
ATOM 12330 CB SER A 775 59.696 101.170 87.755 1.00 0.00 C
ATOM 12331 OG SER A 775 60.459 102.139 87.123 1.00 0.00 O
ATOM 12332 H SER A 775 61.666 100.866 89.163 1.00 0.00 H
ATOM 12333 HA SER A 775 59.305 102.369 89.526 1.00 0.00 H
ATOM 12334 HB2 SER A 775 60.068 100.160 87.582 1.00 0.00 H
ATOM 12335 HB3 SER A 775 58.691 101.231 87.338 1.00 0.00 H
ATOM 12336 HG SER A 775 61.368 101.831 87.096 1.00 0.00 H
ATOM 12337 N THR A 776 58.426 100.511 91.175 1.00 0.00 N
ATOM 12338 CA THR A 776 57.357 99.792 91.988 1.00 0.00 C
ATOM 12339 C THR A 776 55.912 100.284 91.706 1.00 0.00 C
ATOM 12340 O THR A 776 55.732 101.511 91.730 1.00 0.00 O
ATOM 12341 CB THR A 776 57.516 99.947 93.484 1.00 0.00 C
ATOM 12342 CG2 THR A 776 58.828 99.246 94.020 1.00 0.00 C
ATOM 12343 OG1 THR A 776 57.626 101.279 93.863 1.00 0.00 O
ATOM 12344 H THR A 776 59.099 101.003 91.745 1.00 0.00 H
ATOM 12345 HA THR A 776 57.392 98.713 91.840 1.00 0.00 H
ATOM 12346 HB THR A 776 56.695 99.438 93.988 1.00 0.00 H
ATOM 12347 HG1 THR A 776 56.777 101.356 94.305 1.00 0.00 H
ATOM 12348 HG21 THR A 776 59.063 99.493 95.055 1.00 0.00 H
ATOM 12349 HG22 THR A 776 58.603 98.183 94.108 1.00 0.00 H
ATOM 12350 HG23 THR A 776 59.685 99.443 93.376 1.00 0.00 H
ATOM 12351 N LYS A 777 54.999 99.330 91.410 1.00 0.00 N
ATOM 12352 CA LYS A 777 53.556 99.560 91.309 1.00 0.00 C
ATOM 12353 C LYS A 777 52.837 99.555 92.629 1.00 0.00 C
ATOM 12354 O LYS A 777 53.347 99.038 93.593 1.00 0.00 O
ATOM 12355 CB LYS A 777 53.023 98.465 90.425 1.00 0.00 C
ATOM 12356 CG LYS A 777 53.394 98.692 88.952 1.00 0.00 C
ATOM 12357 CD LYS A 777 53.569 97.391 88.206 1.00 0.00 C
ATOM 12358 CE LYS A 777 52.176 96.942 87.684 1.00 0.00 C
ATOM 12359 NZ LYS A 777 52.219 95.604 87.085 1.00 0.00 N1+
ATOM 12360 H LYS A 777 55.373 98.431 91.678 1.00 0.00 H
ATOM 12361 HA LYS A 777 53.279 100.502 90.836 1.00 0.00 H
ATOM 12362 HB2 LYS A 777 53.217 97.441 90.744 1.00 0.00 H
ATOM 12363 HB3 LYS A 777 51.934 98.525 90.410 1.00 0.00 H
ATOM 12364 HG2 LYS A 777 52.624 99.303 88.481 1.00 0.00 H
ATOM 12365 HG3 LYS A 777 54.350 99.215 88.979 1.00 0.00 H
ATOM 12366 HD2 LYS A 777 54.163 97.619 87.321 1.00 0.00 H
ATOM 12367 HD3 LYS A 777 53.954 96.660 88.917 1.00 0.00 H
ATOM 12368 HE2 LYS A 777 51.424 96.944 88.472 1.00 0.00 H
ATOM 12369 HE3 LYS A 777 51.927 97.745 86.990 1.00 0.00 H
ATOM 12370 HZ1 LYS A 777 52.678 94.943 87.695 1.00 0.00 H
ATOM 12371 HZ2 LYS A 777 51.386 95.069 86.886 1.00 0.00 H
ATOM 12372 HZ3 LYS A 777 52.655 95.697 86.178 1.00 0.00 H
ATOM 12373 N ASP A 778 51.670 100.217 92.689 1.00 0.00 N
ATOM 12374 CA ASP A 778 50.593 99.918 93.793 1.00 0.00 C
ATOM 12375 C ASP A 778 50.209 98.421 93.785 1.00 0.00 C
ATOM 12376 O ASP A 778 50.222 97.737 92.789 1.00 0.00 O
ATOM 12377 CB ASP A 778 49.356 100.756 93.791 1.00 0.00 C
ATOM 12378 CG ASP A 778 49.549 102.267 93.705 1.00 0.00 C
ATOM 12379 OD1 ASP A 778 50.616 102.780 94.049 1.00 0.00 O
ATOM 12380 OD2 ASP A 778 48.599 102.955 93.356 1.00 0.00 O1-
ATOM 12381 H ASP A 778 51.373 100.502 91.767 1.00 0.00 H
ATOM 12382 HA ASP A 778 50.984 99.999 94.807 1.00 0.00 H
ATOM 12383 HB2 ASP A 778 48.849 100.585 92.841 1.00 0.00 H
ATOM 12384 HB3 ASP A 778 48.674 100.487 94.598 1.00 0.00 H
ATOM 12385 N GLY A 779 50.116 97.814 94.939 1.00 0.00 N
ATOM 12386 CA GLY A 779 50.108 96.384 95.080 1.00 0.00 C
ATOM 12387 C GLY A 779 51.459 95.715 95.339 1.00 0.00 C
ATOM 12388 O GLY A 779 51.429 94.482 95.670 1.00 0.00 O
ATOM 12389 H GLY A 779 50.029 98.330 95.802 1.00 0.00 H
ATOM 12390 HA2 GLY A 779 49.475 96.148 95.935 1.00 0.00 H
ATOM 12391 HA3 GLY A 779 49.706 95.863 94.211 1.00 0.00 H
ATOM 12392 N HIE A 780 52.636 96.387 95.353 1.00 0.00 N
ATOM 12393 CA HIE A 780 53.927 95.790 95.568 1.00 0.00 C
ATOM 12394 C HIE A 780 54.441 95.705 97.082 1.00 0.00 C
ATOM 12395 O HIE A 780 55.592 95.385 97.310 1.00 0.00 O
ATOM 12396 CB HIE A 780 54.956 96.395 94.572 1.00 0.00 C
ATOM 12397 CG HIE A 780 54.983 96.039 93.083 1.00 0.00 C
ATOM 12398 CD2 HIE A 780 54.162 95.215 92.463 1.00 0.00 C
ATOM 12399 ND1 HIE A 780 55.956 96.563 92.165 1.00 0.00 N
ATOM 12400 CE1 HIE A 780 55.643 95.965 91.025 1.00 0.00 C
ATOM 12401 NE2 HIE A 780 54.572 95.200 91.154 1.00 0.00 N
ATOM 12402 H HIE A 780 52.623 97.361 95.087 1.00 0.00 H
ATOM 12403 HA HIE A 780 53.965 94.748 95.251 1.00 0.00 H
ATOM 12404 HB2 HIE A 780 54.778 97.470 94.580 1.00 0.00 H
ATOM 12405 HB3 HIE A 780 55.942 96.254 95.015 1.00 0.00 H
ATOM 12406 HD2 HIE A 780 53.282 94.705 92.827 1.00 0.00 H
ATOM 12407 HE1 HIE A 780 56.204 96.063 90.107 1.00 0.00 H
ATOM 12408 HE2 HIE A 780 54.122 94.648 90.438 1.00 0.00 H
ATOM 12409 N CYS A 781 53.531 95.957 98.052 1.00 0.00 N
ATOM 12410 CA CYS A 781 53.739 95.754 99.499 1.00 0.00 C
ATOM 12411 C CYS A 781 54.099 94.297 99.772 1.00 0.00 C
ATOM 12412 O CYS A 781 53.498 93.402 99.239 1.00 0.00 O
ATOM 12413 CB CYS A 781 52.608 96.082 100.366 1.00 0.00 C
ATOM 12414 SG CYS A 781 52.272 97.868 100.361 1.00 0.00 S
ATOM 12415 H CYS A 781 52.643 96.311 97.727 1.00 0.00 H
ATOM 12416 HA CYS A 781 54.529 96.450 99.782 1.00 0.00 H
ATOM 12417 HB2 CYS A 781 51.752 95.505 100.016 1.00 0.00 H
ATOM 12418 HB3 CYS A 781 52.838 95.689 101.357 1.00 0.00 H
ATOM 12419 HG CYS A 781 51.505 97.751 99.273 1.00 0.00 H
ATOM 12420 N GLY A 782 55.178 94.123 100.558 1.00 0.00 N
ATOM 12421 CA GLY A 782 55.785 92.848 101.085 1.00 0.00 C
ATOM 12422 C GLY A 782 56.784 92.153 100.190 1.00 0.00 C
ATOM 12423 O GLY A 782 57.300 91.061 100.519 1.00 0.00 O
ATOM 12424 H GLY A 782 55.592 94.903 101.047 1.00 0.00 H
ATOM 12425 HA2 GLY A 782 56.238 92.958 102.070 1.00 0.00 H
ATOM 12426 HA3 GLY A 782 54.926 92.235 101.357 1.00 0.00 H
ATOM 12427 N LEU A 783 57.240 92.777 99.138 1.00 0.00 N
ATOM 12428 CA LEU A 783 58.282 92.319 98.261 1.00 0.00 C
ATOM 12429 C LEU A 783 59.713 92.667 98.842 1.00 0.00 C
ATOM 12430 O LEU A 783 59.864 93.843 99.228 1.00 0.00 O
ATOM 12431 CB LEU A 783 58.173 93.035 96.933 1.00 0.00 C
ATOM 12432 CG LEU A 783 57.153 92.479 95.938 1.00 0.00 C
ATOM 12433 CD1 LEU A 783 57.343 93.165 94.647 1.00 0.00 C
ATOM 12434 CD2 LEU A 783 57.101 90.982 95.748 1.00 0.00 C
ATOM 12435 H LEU A 783 56.720 93.618 98.933 1.00 0.00 H
ATOM 12436 HA LEU A 783 58.264 91.237 98.133 1.00 0.00 H
ATOM 12437 HB2 LEU A 783 58.149 94.124 96.972 1.00 0.00 H
ATOM 12438 HB3 LEU A 783 59.064 92.786 96.356 1.00 0.00 H
ATOM 12439 HG LEU A 783 56.170 92.729 96.338 1.00 0.00 H
ATOM 12440 HD11 LEU A 783 58.284 92.748 94.289 1.00 0.00 H
ATOM 12441 HD12 LEU A 783 56.480 92.916 94.030 1.00 0.00 H
ATOM 12442 HD13 LEU A 783 57.442 94.249 94.716 1.00 0.00 H
ATOM 12443 HD21 LEU A 783 56.946 90.503 96.715 1.00 0.00 H
ATOM 12444 HD22 LEU A 783 56.289 90.726 95.068 1.00 0.00 H
ATOM 12445 HD23 LEU A 783 57.996 90.621 95.240 1.00 0.00 H
ATOM 12446 N PRO A 784 60.730 91.787 98.541 1.00 0.00 N
ATOM 12447 CA PRO A 784 62.152 92.024 98.849 1.00 0.00 C
ATOM 12448 C PRO A 784 62.741 93.105 97.868 1.00 0.00 C
ATOM 12449 O PRO A 784 62.684 93.037 96.635 1.00 0.00 O
ATOM 12450 CB PRO A 784 62.913 90.670 98.761 1.00 0.00 C
ATOM 12451 CG PRO A 784 61.966 89.916 97.814 1.00 0.00 C
ATOM 12452 CD PRO A 784 60.530 90.449 97.967 1.00 0.00 C
ATOM 12453 HA PRO A 784 62.309 92.366 99.872 1.00 0.00 H
ATOM 12454 HB2 PRO A 784 63.886 90.792 98.285 1.00 0.00 H
ATOM 12455 HB3 PRO A 784 63.020 90.251 99.761 1.00 0.00 H
ATOM 12456 HG2 PRO A 784 62.381 90.160 96.836 1.00 0.00 H
ATOM 12457 HG3 PRO A 784 61.972 88.837 97.970 1.00 0.00 H
ATOM 12458 HD2 PRO A 784 60.067 90.549 96.985 1.00 0.00 H
ATOM 12459 HD3 PRO A 784 59.901 89.753 98.523 1.00 0.00 H
ATOM 12460 N ILE A 785 63.502 94.043 98.534 1.00 0.00 N
ATOM 12461 CA ILE A 785 64.814 94.572 98.044 1.00 0.00 C
ATOM 12462 C ILE A 785 65.889 93.493 98.310 1.00 0.00 C
ATOM 12463 O ILE A 785 65.980 92.980 99.391 1.00 0.00 O
ATOM 12464 CB ILE A 785 65.113 95.942 98.706 1.00 0.00 C
ATOM 12465 CG1 ILE A 785 64.094 97.014 98.215 1.00 0.00 C
ATOM 12466 CG2 ILE A 785 66.630 96.397 98.473 1.00 0.00 C
ATOM 12467 CD1 ILE A 785 64.236 97.510 96.753 1.00 0.00 C
ATOM 12468 H ILE A 785 63.378 94.127 99.533 1.00 0.00 H
ATOM 12469 HA ILE A 785 64.813 94.674 96.958 1.00 0.00 H
ATOM 12470 HB ILE A 785 64.938 95.889 99.780 1.00 0.00 H
ATOM 12471 HG12 ILE A 785 63.119 96.549 98.359 1.00 0.00 H
ATOM 12472 HG13 ILE A 785 64.086 97.827 98.942 1.00 0.00 H
ATOM 12473 HG21 ILE A 785 67.217 95.728 99.103 1.00 0.00 H
ATOM 12474 HG22 ILE A 785 67.033 96.342 97.461 1.00 0.00 H
ATOM 12475 HG23 ILE A 785 66.772 97.376 98.930 1.00 0.00 H
ATOM 12476 HD11 ILE A 785 63.944 96.751 96.027 1.00 0.00 H
ATOM 12477 HD12 ILE A 785 63.689 98.439 96.588 1.00 0.00 H
ATOM 12478 HD13 ILE A 785 65.255 97.782 96.476 1.00 0.00 H
ATOM 12479 N VAL A 786 66.656 93.114 97.324 1.00 0.00 N
ATOM 12480 CA VAL A 786 67.769 92.193 97.379 1.00 0.00 C
ATOM 12481 C VAL A 786 69.139 92.826 96.938 1.00 0.00 C
ATOM 12482 O VAL A 786 69.185 93.530 95.944 1.00 0.00 O
ATOM 12483 CB VAL A 786 67.608 90.927 96.544 1.00 0.00 C
ATOM 12484 CG1 VAL A 786 68.696 89.859 96.531 1.00 0.00 C
ATOM 12485 CG2 VAL A 786 66.397 90.144 97.047 1.00 0.00 C
ATOM 12486 H VAL A 786 66.489 93.465 96.392 1.00 0.00 H
ATOM 12487 HA VAL A 786 67.949 92.023 98.441 1.00 0.00 H
ATOM 12488 HB VAL A 786 67.409 91.177 95.502 1.00 0.00 H
ATOM 12489 HG11 VAL A 786 68.408 89.008 95.913 1.00 0.00 H
ATOM 12490 HG12 VAL A 786 69.566 90.283 96.029 1.00 0.00 H
ATOM 12491 HG13 VAL A 786 68.988 89.580 97.543 1.00 0.00 H
ATOM 12492 HG21 VAL A 786 66.337 89.192 96.520 1.00 0.00 H
ATOM 12493 HG22 VAL A 786 66.712 89.802 98.033 1.00 0.00 H
ATOM 12494 HG23 VAL A 786 65.467 90.690 96.895 1.00 0.00 H
ATOM 12495 N SER A 787 70.244 92.563 97.666 1.00 0.00 N
ATOM 12496 CA SER A 787 71.599 92.937 97.287 1.00 0.00 C
ATOM 12497 C SER A 787 72.017 92.263 96.012 1.00 0.00 C
ATOM 12498 O SER A 787 72.082 90.993 95.941 1.00 0.00 O
ATOM 12499 CB SER A 787 72.485 92.489 98.444 1.00 0.00 C
ATOM 12500 OG SER A 787 73.851 92.808 98.274 1.00 0.00 O
ATOM 12501 H SER A 787 70.163 91.925 98.445 1.00 0.00 H
ATOM 12502 HA SER A 787 71.624 94.027 97.284 1.00 0.00 H
ATOM 12503 HB2 SER A 787 72.154 93.013 99.341 1.00 0.00 H
ATOM 12504 HB3 SER A 787 72.326 91.413 98.518 1.00 0.00 H
ATOM 12505 HG SER A 787 74.320 92.390 99.000 1.00 0.00 H
ATOM 12506 N THR A 788 72.321 93.106 95.055 1.00 0.00 N
ATOM 12507 CA THR A 788 73.055 92.543 93.849 1.00 0.00 C
ATOM 12508 C THR A 788 74.523 92.180 94.151 1.00 0.00 C
ATOM 12509 O THR A 788 75.072 91.465 93.363 1.00 0.00 O
ATOM 12510 CB THR A 788 73.134 93.615 92.704 1.00 0.00 C
ATOM 12511 CG2 THR A 788 71.846 94.284 92.310 1.00 0.00 C
ATOM 12512 OG1 THR A 788 74.056 94.637 93.122 1.00 0.00 O
ATOM 12513 H THR A 788 72.133 94.098 95.067 1.00 0.00 H
ATOM 12514 HA THR A 788 72.506 91.673 93.489 1.00 0.00 H
ATOM 12515 HB THR A 788 73.585 93.252 91.780 1.00 0.00 H
ATOM 12516 HG1 THR A 788 73.711 95.053 93.915 1.00 0.00 H
ATOM 12517 HG21 THR A 788 72.087 95.082 91.608 1.00 0.00 H
ATOM 12518 HG22 THR A 788 71.169 93.590 91.811 1.00 0.00 H
ATOM 12519 HG23 THR A 788 71.352 94.649 93.211 1.00 0.00 H
ATOM 12520 N ARG A 789 75.137 92.609 95.251 1.00 0.00 N
ATOM 12521 CA ARG A 789 76.523 92.494 95.676 1.00 0.00 C
ATOM 12522 C ARG A 789 76.702 91.143 96.281 1.00 0.00 C
ATOM 12523 O ARG A 789 77.530 90.377 95.738 1.00 0.00 O
ATOM 12524 CB ARG A 789 77.131 93.617 96.602 1.00 0.00 C
ATOM 12525 CG ARG A 789 76.960 95.056 96.069 1.00 0.00 C
ATOM 12526 CD ARG A 789 77.480 96.131 97.023 1.00 0.00 C
ATOM 12527 NE ARG A 789 77.054 96.107 98.441 1.00 0.00 N
ATOM 12528 CZ ARG A 789 77.866 95.882 99.425 1.00 0.00 C
ATOM 12529 NH1 ARG A 789 79.127 95.789 99.367 1.00 0.00 N1+
ATOM 12530 NH2 ARG A 789 77.350 95.941 100.643 1.00 0.00 N
ATOM 12531 H ARG A 789 74.732 93.286 95.882 1.00 0.00 H
ATOM 12532 HA ARG A 789 77.164 92.560 94.796 1.00 0.00 H
ATOM 12533 HB2 ARG A 789 76.609 93.524 97.554 1.00 0.00 H
ATOM 12534 HB3 ARG A 789 78.145 93.234 96.713 1.00 0.00 H
ATOM 12535 HG2 ARG A 789 77.430 95.223 95.100 1.00 0.00 H
ATOM 12536 HG3 ARG A 789 75.889 95.254 96.046 1.00 0.00 H
ATOM 12537 HD2 ARG A 789 78.566 96.074 96.951 1.00 0.00 H
ATOM 12538 HD3 ARG A 789 77.299 97.141 96.656 1.00 0.00 H
ATOM 12539 HE ARG A 789 76.106 96.330 98.711 1.00 0.00 H
ATOM 12540 HH11 ARG A 789 79.676 95.862 98.523 1.00 0.00 H
ATOM 12541 HH12 ARG A 789 79.658 95.682 100.219 1.00 0.00 H
ATOM 12542 HH21 ARG A 789 76.378 96.178 100.779 1.00 0.00 H
ATOM 12543 HH22 ARG A 789 77.946 95.792 101.445 1.00 0.00 H
ATOM 12544 N ASP A 790 75.935 90.788 97.345 1.00 0.00 N
ATOM 12545 CA ASP A 790 76.188 89.669 98.202 1.00 0.00 C
ATOM 12546 C ASP A 790 75.061 88.646 98.238 1.00 0.00 C
ATOM 12547 O ASP A 790 75.180 87.608 98.837 1.00 0.00 O
ATOM 12548 CB ASP A 790 76.709 90.091 99.620 1.00 0.00 C
ATOM 12549 CG ASP A 790 75.617 90.593 100.616 1.00 0.00 C
ATOM 12550 OD1 ASP A 790 74.709 91.316 100.163 1.00 0.00 O
ATOM 12551 OD2 ASP A 790 75.666 90.556 101.840 1.00 0.00 O1-
ATOM 12552 H ASP A 790 75.334 91.487 97.756 1.00 0.00 H
ATOM 12553 HA ASP A 790 77.106 89.211 97.835 1.00 0.00 H
ATOM 12554 HB2 ASP A 790 77.390 89.310 99.961 1.00 0.00 H
ATOM 12555 HB3 ASP A 790 77.330 90.984 99.551 1.00 0.00 H
ATOM 12556 N GLY A 791 73.946 88.833 97.511 1.00 0.00 N
ATOM 12557 CA GLY A 791 72.762 87.998 97.611 1.00 0.00 C
ATOM 12558 C GLY A 791 71.791 88.157 98.905 1.00 0.00 C
ATOM 12559 O GLY A 791 70.783 87.439 99.067 1.00 0.00 O
ATOM 12560 H GLY A 791 73.967 89.554 96.805 1.00 0.00 H
ATOM 12561 HA2 GLY A 791 72.126 88.259 96.765 1.00 0.00 H
ATOM 12562 HA3 GLY A 791 73.041 86.950 97.507 1.00 0.00 H
ATOM 12563 N SER A 792 72.049 89.125 99.816 1.00 0.00 N
ATOM 12564 CA SER A 792 71.192 89.402 101.024 1.00 0.00 C
ATOM 12565 C SER A 792 69.936 90.151 100.714 1.00 0.00 C
ATOM 12566 O SER A 792 70.005 91.199 100.054 1.00 0.00 O
ATOM 12567 CB SER A 792 72.049 90.119 102.035 1.00 0.00 C
ATOM 12568 OG SER A 792 73.096 89.253 102.300 1.00 0.00 O
ATOM 12569 H SER A 792 72.972 89.524 99.727 1.00 0.00 H
ATOM 12570 HA SER A 792 70.859 88.447 101.429 1.00 0.00 H
ATOM 12571 HB2 SER A 792 72.503 91.042 101.675 1.00 0.00 H
ATOM 12572 HB3 SER A 792 71.445 90.307 102.922 1.00 0.00 H
ATOM 12573 HG SER A 792 73.848 89.835 102.432 1.00 0.00 H
ATOM 12574 N ILE A 793 68.781 89.730 101.242 1.00 0.00 N
ATOM 12575 CA ILE A 793 67.555 90.598 101.404 1.00 0.00 C
ATOM 12576 C ILE A 793 67.921 91.724 102.416 1.00 0.00 C
ATOM 12577 O ILE A 793 68.563 91.440 103.462 1.00 0.00 O
ATOM 12578 CB ILE A 793 66.354 89.759 101.835 1.00 0.00 C
ATOM 12579 CG1 ILE A 793 65.848 88.811 100.786 1.00 0.00 C
ATOM 12580 CG2 ILE A 793 65.149 90.687 102.197 1.00 0.00 C
ATOM 12581 CD1 ILE A 793 65.188 87.563 101.354 1.00 0.00 C
ATOM 12582 H ILE A 793 68.780 88.912 101.834 1.00 0.00 H
ATOM 12583 HA ILE A 793 67.376 91.004 100.409 1.00 0.00 H
ATOM 12584 HB ILE A 793 66.670 89.180 102.702 1.00 0.00 H
ATOM 12585 HG12 ILE A 793 65.190 89.214 100.016 1.00 0.00 H
ATOM 12586 HG13 ILE A 793 66.725 88.518 100.210 1.00 0.00 H
ATOM 12587 HG21 ILE A 793 64.982 91.377 101.370 1.00 0.00 H
ATOM 12588 HG22 ILE A 793 64.223 90.118 102.280 1.00 0.00 H
ATOM 12589 HG23 ILE A 793 65.288 91.214 103.141 1.00 0.00 H
ATOM 12590 HD11 ILE A 793 64.345 87.805 102.001 1.00 0.00 H
ATOM 12591 HD12 ILE A 793 64.808 87.040 100.476 1.00 0.00 H
ATOM 12592 HD13 ILE A 793 65.927 86.987 101.910 1.00 0.00 H
ATOM 12593 N LEU A 794 67.408 92.917 102.186 1.00 0.00 N
ATOM 12594 CA LEU A 794 67.773 94.082 103.012 1.00 0.00 C
ATOM 12595 C LEU A 794 66.493 94.723 103.626 1.00 0.00 C
ATOM 12596 O LEU A 794 66.643 95.422 104.599 1.00 0.00 O
ATOM 12597 CB LEU A 794 68.511 95.112 102.185 1.00 0.00 C
ATOM 12598 CG LEU A 794 69.761 94.576 101.368 1.00 0.00 C
ATOM 12599 CD1 LEU A 794 70.280 95.665 100.428 1.00 0.00 C
ATOM 12600 CD2 LEU A 794 70.966 94.117 102.242 1.00 0.00 C
ATOM 12601 H LEU A 794 66.837 93.039 101.361 1.00 0.00 H
ATOM 12602 HA LEU A 794 68.438 93.768 103.816 1.00 0.00 H
ATOM 12603 HB2 LEU A 794 67.827 95.534 101.448 1.00 0.00 H
ATOM 12604 HB3 LEU A 794 68.867 95.910 102.837 1.00 0.00 H
ATOM 12605 HG LEU A 794 69.524 93.756 100.690 1.00 0.00 H
ATOM 12606 HD11 LEU A 794 70.788 95.121 99.631 1.00 0.00 H
ATOM 12607 HD12 LEU A 794 69.506 96.333 100.052 1.00 0.00 H
ATOM 12608 HD13 LEU A 794 70.998 96.209 101.041 1.00 0.00 H
ATOM 12609 HD21 LEU A 794 71.808 93.884 101.591 1.00 0.00 H
ATOM 12610 HD22 LEU A 794 71.225 94.853 103.004 1.00 0.00 H
ATOM 12611 HD23 LEU A 794 70.671 93.176 102.706 1.00 0.00 H
ATOM 12612 N GLY A 795 65.334 94.533 102.988 1.00 0.00 N
ATOM 12613 CA GLY A 795 63.954 94.819 103.534 1.00 0.00 C
ATOM 12614 C GLY A 795 62.822 94.517 102.564 1.00 0.00 C
ATOM 12615 O GLY A 795 63.029 93.991 101.404 1.00 0.00 O
ATOM 12616 H GLY A 795 65.271 93.896 102.206 1.00 0.00 H
ATOM 12617 HA2 GLY A 795 63.819 94.250 104.454 1.00 0.00 H
ATOM 12618 HA3 GLY A 795 63.929 95.872 103.811 1.00 0.00 H
ATOM 12619 N LEU A 796 61.593 94.865 102.994 1.00 0.00 N
ATOM 12620 CA LEU A 796 60.334 94.686 102.288 1.00 0.00 C
ATOM 12621 C LEU A 796 59.693 96.039 101.991 1.00 0.00 C
ATOM 12622 O LEU A 796 59.433 96.862 102.902 1.00 0.00 O
ATOM 12623 CB LEU A 796 59.329 93.884 103.163 1.00 0.00 C
ATOM 12624 CG LEU A 796 59.584 92.391 103.559 1.00 0.00 C
ATOM 12625 CD1 LEU A 796 60.490 92.079 104.766 1.00 0.00 C
ATOM 12626 CD2 LEU A 796 58.172 91.903 104.035 1.00 0.00 C
ATOM 12627 H LEU A 796 61.486 95.220 103.933 1.00 0.00 H
ATOM 12628 HA LEU A 796 60.482 93.982 101.469 1.00 0.00 H
ATOM 12629 HB2 LEU A 796 59.355 94.453 104.092 1.00 0.00 H
ATOM 12630 HB3 LEU A 796 58.355 93.960 102.679 1.00 0.00 H
ATOM 12631 HG LEU A 796 59.707 91.807 102.646 1.00 0.00 H
ATOM 12632 HD11 LEU A 796 61.465 92.550 104.639 1.00 0.00 H
ATOM 12633 HD12 LEU A 796 60.076 92.387 105.725 1.00 0.00 H
ATOM 12634 HD13 LEU A 796 60.699 91.009 104.786 1.00 0.00 H
ATOM 12635 HD21 LEU A 796 57.662 92.585 104.715 1.00 0.00 H
ATOM 12636 HD22 LEU A 796 57.563 91.807 103.136 1.00 0.00 H
ATOM 12637 HD23 LEU A 796 58.293 90.919 104.487 1.00 0.00 H
ATOM 12638 N HIE A 797 59.453 96.235 100.689 1.00 0.00 N
ATOM 12639 CA HIE A 797 58.793 97.444 100.162 1.00 0.00 C
ATOM 12640 C HIE A 797 57.308 97.699 100.516 1.00 0.00 C
ATOM 12641 O HIE A 797 56.647 96.687 100.648 1.00 0.00 O
ATOM 12642 CB HIE A 797 58.960 97.443 98.617 1.00 0.00 C
ATOM 12643 CG HIE A 797 58.331 98.685 97.949 1.00 0.00 C
ATOM 12644 CD2 HIE A 797 57.082 98.812 97.414 1.00 0.00 C
ATOM 12645 ND1 HIE A 797 58.992 99.866 97.931 1.00 0.00 N
ATOM 12646 CE1 HIE A 797 58.117 100.737 97.359 1.00 0.00 C
ATOM 12647 NE2 HIE A 797 56.970 100.128 97.053 1.00 0.00 N
ATOM 12648 H HIE A 797 59.704 95.541 100.000 1.00 0.00 H
ATOM 12649 HA HIE A 797 59.221 98.369 100.549 1.00 0.00 H
ATOM 12650 HB2 HIE A 797 60.018 97.421 98.358 1.00 0.00 H
ATOM 12651 HB3 HIE A 797 58.515 96.531 98.219 1.00 0.00 H
ATOM 12652 HD2 HIE A 797 56.427 97.992 97.161 1.00 0.00 H
ATOM 12653 HE1 HIE A 797 58.162 101.816 97.398 1.00 0.00 H
ATOM 12654 HE2 HIE A 797 56.167 100.424 96.517 1.00 0.00 H
ATOM 12655 N SER A 798 56.947 98.941 100.786 1.00 0.00 N
ATOM 12656 CA SER A 798 55.595 99.349 101.255 1.00 0.00 C
ATOM 12657 C SER A 798 55.098 100.713 100.777 1.00 0.00 C
ATOM 12658 O SER A 798 53.920 100.775 100.506 1.00 0.00 O
ATOM 12659 CB SER A 798 55.425 99.165 102.781 1.00 0.00 C
ATOM 12660 OG SER A 798 56.399 99.961 103.421 1.00 0.00 O
ATOM 12661 H SER A 798 57.666 99.634 100.634 1.00 0.00 H
ATOM 12662 HA SER A 798 54.953 98.665 100.700 1.00 0.00 H
ATOM 12663 HB2 SER A 798 54.417 99.323 103.165 1.00 0.00 H
ATOM 12664 HB3 SER A 798 55.588 98.119 103.041 1.00 0.00 H
ATOM 12665 HG SER A 798 56.129 99.903 104.341 1.00 0.00 H
ATOM 12666 N LEU A 799 55.906 101.763 100.470 1.00 0.00 N
ATOM 12667 CA LEU A 799 55.406 103.096 100.171 1.00 0.00 C
ATOM 12668 C LEU A 799 55.847 103.726 98.834 1.00 0.00 C
ATOM 12669 O LEU A 799 56.959 103.548 98.332 1.00 0.00 O
ATOM 12670 CB LEU A 799 55.718 104.045 101.326 1.00 0.00 C
ATOM 12671 CG LEU A 799 55.702 103.598 102.837 1.00 0.00 C
ATOM 12672 CD1 LEU A 799 55.958 104.733 103.859 1.00 0.00 C
ATOM 12673 CD2 LEU A 799 54.312 103.047 103.339 1.00 0.00 C
ATOM 12674 H LEU A 799 56.908 101.639 100.428 1.00 0.00 H
ATOM 12675 HA LEU A 799 54.322 103.008 100.105 1.00 0.00 H
ATOM 12676 HB2 LEU A 799 56.722 104.406 101.103 1.00 0.00 H
ATOM 12677 HB3 LEU A 799 55.012 104.867 101.207 1.00 0.00 H
ATOM 12678 HG LEU A 799 56.525 102.894 102.961 1.00 0.00 H
ATOM 12679 HD11 LEU A 799 55.286 105.590 103.907 1.00 0.00 H
ATOM 12680 HD12 LEU A 799 55.968 104.466 104.916 1.00 0.00 H
ATOM 12681 HD13 LEU A 799 56.876 105.260 103.601 1.00 0.00 H
ATOM 12682 HD21 LEU A 799 53.790 102.485 102.565 1.00 0.00 H
ATOM 12683 HD22 LEU A 799 54.389 102.482 104.268 1.00 0.00 H
ATOM 12684 HD23 LEU A 799 53.660 103.918 103.395 1.00 0.00 H
ATOM 12685 N ALA A 800 55.100 104.776 98.567 1.00 0.00 N
ATOM 12686 CA ALA A 800 55.439 105.766 97.494 1.00 0.00 C
ATOM 12687 C ALA A 800 55.056 107.237 97.843 1.00 0.00 C
ATOM 12688 O ALA A 800 54.081 107.511 98.670 1.00 0.00 O
ATOM 12689 CB ALA A 800 54.823 105.340 96.187 1.00 0.00 C
ATOM 12690 H ALA A 800 54.270 104.904 99.128 1.00 0.00 H
ATOM 12691 HA ALA A 800 56.519 105.773 97.343 1.00 0.00 H
ATOM 12692 HB1 ALA A 800 53.762 105.571 96.281 1.00 0.00 H
ATOM 12693 HB2 ALA A 800 55.278 105.982 95.433 1.00 0.00 H
ATOM 12694 HB3 ALA A 800 55.134 104.328 95.930 1.00 0.00 H
ATOM 12695 N ASN A 801 55.829 108.201 97.360 1.00 0.00 N
ATOM 12696 CA ASN A 801 55.548 109.627 97.609 1.00 0.00 C
ATOM 12697 C ASN A 801 54.431 110.181 96.773 1.00 0.00 C
ATOM 12698 O ASN A 801 54.188 109.817 95.676 1.00 0.00 O
ATOM 12699 CB ASN A 801 56.827 110.498 97.514 1.00 0.00 C
ATOM 12700 CG ASN A 801 56.951 111.313 96.309 1.00 0.00 C
ATOM 12701 ND2 ASN A 801 56.774 112.598 96.373 1.00 0.00 N
ATOM 12702 OD1 ASN A 801 57.111 110.767 95.280 1.00 0.00 O
ATOM 12703 H ASN A 801 56.622 108.063 96.751 1.00 0.00 H
ATOM 12704 HA ASN A 801 55.222 109.663 98.649 1.00 0.00 H
ATOM 12705 HB2 ASN A 801 56.866 111.177 98.366 1.00 0.00 H
ATOM 12706 HB3 ASN A 801 57.701 109.863 97.658 1.00 0.00 H
ATOM 12707 HD21 ASN A 801 56.830 113.111 95.505 1.00 0.00 H
ATOM 12708 HD22 ASN A 801 56.789 113.095 97.253 1.00 0.00 H
ATOM 12709 N SER A 802 53.786 111.244 97.287 1.00 0.00 N
ATOM 12710 CA SER A 802 52.497 111.654 96.754 1.00 0.00 C
ATOM 12711 C SER A 802 52.621 112.570 95.469 1.00 0.00 C
ATOM 12712 O SER A 802 51.578 112.909 94.935 1.00 0.00 O
ATOM 12713 CB SER A 802 51.805 112.485 97.847 1.00 0.00 C
ATOM 12714 OG SER A 802 52.592 113.639 97.980 1.00 0.00 O
ATOM 12715 H SER A 802 54.057 111.623 98.183 1.00 0.00 H
ATOM 12716 HA SER A 802 51.964 110.732 96.521 1.00 0.00 H
ATOM 12717 HB2 SER A 802 50.802 112.770 97.529 1.00 0.00 H
ATOM 12718 HB3 SER A 802 51.929 111.955 98.791 1.00 0.00 H
ATOM 12719 HG SER A 802 53.216 113.377 98.662 1.00 0.00 H
ATOM 12720 N THR A 803 53.812 112.865 94.946 1.00 0.00 N
ATOM 12721 CA THR A 803 53.962 113.144 93.523 1.00 0.00 C
ATOM 12722 C THR A 803 54.289 111.926 92.610 1.00 0.00 C
ATOM 12723 O THR A 803 54.429 112.062 91.407 1.00 0.00 O
ATOM 12724 CB THR A 803 54.950 114.346 93.318 1.00 0.00 C
ATOM 12725 CG2 THR A 803 54.432 115.621 93.824 1.00 0.00 C
ATOM 12726 OG1 THR A 803 56.197 114.108 93.935 1.00 0.00 O
ATOM 12727 H THR A 803 54.591 112.718 95.572 1.00 0.00 H
ATOM 12728 HA THR A 803 53.068 113.561 93.058 1.00 0.00 H
ATOM 12729 HB THR A 803 55.168 114.403 92.252 1.00 0.00 H
ATOM 12730 HG1 THR A 803 56.722 114.890 93.749 1.00 0.00 H
ATOM 12731 HG21 THR A 803 54.198 115.469 94.877 1.00 0.00 H
ATOM 12732 HG22 THR A 803 55.164 116.411 93.657 1.00 0.00 H
ATOM 12733 HG23 THR A 803 53.500 115.894 93.329 1.00 0.00 H
ATOM 12734 N ASN A 804 54.371 110.752 93.155 1.00 0.00 N
ATOM 12735 CA ASN A 804 54.785 109.485 92.554 1.00 0.00 C
ATOM 12736 C ASN A 804 56.195 109.458 91.924 1.00 0.00 C
ATOM 12737 O ASN A 804 56.389 109.017 90.770 1.00 0.00 O
ATOM 12738 CB ASN A 804 53.766 108.819 91.649 1.00 0.00 C
ATOM 12739 CG ASN A 804 52.359 108.920 92.233 1.00 0.00 C
ATOM 12740 ND2 ASN A 804 51.972 108.007 93.046 1.00 0.00 N
ATOM 12741 OD1 ASN A 804 51.640 109.908 92.004 1.00 0.00 O
ATOM 12742 H ASN A 804 54.265 110.797 94.158 1.00 0.00 H
ATOM 12743 HA ASN A 804 54.883 108.746 93.350 1.00 0.00 H
ATOM 12744 HB2 ASN A 804 53.658 109.451 90.767 1.00 0.00 H
ATOM 12745 HB3 ASN A 804 54.010 107.810 91.318 1.00 0.00 H
ATOM 12746 HD21 ASN A 804 51.042 108.159 93.411 1.00 0.00 H
ATOM 12747 HD22 ASN A 804 52.320 107.061 92.984 1.00 0.00 H
ATOM 12748 N THR A 805 57.143 110.096 92.576 1.00 0.00 N
ATOM 12749 CA THR A 805 58.504 110.329 92.059 1.00 0.00 C
ATOM 12750 C THR A 805 59.620 109.621 92.770 1.00 0.00 C
ATOM 12751 O THR A 805 60.685 109.289 92.226 1.00 0.00 O
ATOM 12752 CB THR A 805 58.883 111.854 91.828 1.00 0.00 C
ATOM 12753 CG2 THR A 805 57.926 112.523 90.859 1.00 0.00 C
ATOM 12754 OG1 THR A 805 58.897 112.602 93.068 1.00 0.00 O
ATOM 12755 H THR A 805 56.973 110.451 93.506 1.00 0.00 H
ATOM 12756 HA THR A 805 58.548 109.979 91.028 1.00 0.00 H
ATOM 12757 HB THR A 805 59.874 111.813 91.378 1.00 0.00 H
ATOM 12758 HG1 THR A 805 58.125 113.154 93.217 1.00 0.00 H
ATOM 12759 HG21 THR A 805 58.027 112.184 89.828 1.00 0.00 H
ATOM 12760 HG22 THR A 805 56.864 112.402 91.076 1.00 0.00 H
ATOM 12761 HG23 THR A 805 58.121 113.590 90.760 1.00 0.00 H
ATOM 12762 N GLN A 806 59.465 109.303 94.067 1.00 0.00 N
ATOM 12763 CA GLN A 806 60.367 108.506 94.951 1.00 0.00 C
ATOM 12764 C GLN A 806 59.677 107.494 95.888 1.00 0.00 C
ATOM 12765 O GLN A 806 58.576 107.806 96.336 1.00 0.00 O
ATOM 12766 CB GLN A 806 61.202 109.510 95.732 1.00 0.00 C
ATOM 12767 CG GLN A 806 60.634 110.786 96.384 1.00 0.00 C
ATOM 12768 CD GLN A 806 61.759 111.620 96.998 1.00 0.00 C
ATOM 12769 NE2 GLN A 806 61.412 112.404 98.024 1.00 0.00 N
ATOM 12770 OE1 GLN A 806 62.926 111.583 96.761 1.00 0.00 O
ATOM 12771 H GLN A 806 58.594 109.476 94.547 1.00 0.00 H
ATOM 12772 HA GLN A 806 61.044 107.894 94.355 1.00 0.00 H
ATOM 12773 HB2 GLN A 806 61.586 108.849 96.509 1.00 0.00 H
ATOM 12774 HB3 GLN A 806 61.968 109.820 95.021 1.00 0.00 H
ATOM 12775 HG2 GLN A 806 60.101 111.328 95.603 1.00 0.00 H
ATOM 12776 HG3 GLN A 806 59.890 110.622 97.164 1.00 0.00 H
ATOM 12777 HE21 GLN A 806 62.189 112.808 98.527 1.00 0.00 H
ATOM 12778 HE22 GLN A 806 60.447 112.527 98.293 1.00 0.00 H
ATOM 12779 N ASN A 807 60.269 106.308 96.180 1.00 0.00 N
ATOM 12780 CA ASN A 807 59.570 105.139 96.713 1.00 0.00 C
ATOM 12781 C ASN A 807 60.385 104.580 97.952 1.00 0.00 C
ATOM 12782 O ASN A 807 61.570 104.837 98.190 1.00 0.00 O
ATOM 12783 CB ASN A 807 59.569 104.249 95.479 1.00 0.00 C
ATOM 12784 CG ASN A 807 58.585 104.544 94.427 1.00 0.00 C
ATOM 12785 ND2 ASN A 807 58.897 104.190 93.230 1.00 0.00 N
ATOM 12786 OD1 ASN A 807 57.527 105.107 94.511 1.00 0.00 O
ATOM 12787 H ASN A 807 61.203 106.224 95.805 1.00 0.00 H
ATOM 12788 HA ASN A 807 58.548 105.370 97.015 1.00 0.00 H
ATOM 12789 HB2 ASN A 807 60.504 104.412 94.944 1.00 0.00 H
ATOM 12790 HB3 ASN A 807 59.386 103.253 95.880 1.00 0.00 H
ATOM 12791 HD21 ASN A 807 58.172 104.406 92.559 1.00 0.00 H
ATOM 12792 HD22 ASN A 807 59.715 103.663 92.959 1.00 0.00 H
ATOM 12793 N PHE A 808 59.673 103.889 98.884 1.00 0.00 N
ATOM 12794 CA PHE A 808 60.213 103.622 100.198 1.00 0.00 C
ATOM 12795 C PHE A 808 60.067 102.210 100.758 1.00 0.00 C
ATOM 12796 O PHE A 808 59.130 101.516 100.350 1.00 0.00 O
ATOM 12797 CB PHE A 808 59.806 104.765 101.198 1.00 0.00 C
ATOM 12798 CG PHE A 808 59.870 106.163 100.747 1.00 0.00 C
ATOM 12799 CD1 PHE A 808 60.953 106.999 100.993 1.00 0.00 C
ATOM 12800 CD2 PHE A 808 58.785 106.710 100.008 1.00 0.00 C
ATOM 12801 CE1 PHE A 808 60.965 108.370 100.745 1.00 0.00 C
ATOM 12802 CE2 PHE A 808 58.807 108.020 99.597 1.00 0.00 C
ATOM 12803 CZ PHE A 808 59.824 108.851 100.043 1.00 0.00 C
ATOM 12804 H PHE A 808 58.686 103.742 98.732 1.00 0.00 H
ATOM 12805 HA PHE A 808 61.289 103.795 100.225 1.00 0.00 H
ATOM 12806 HB2 PHE A 808 58.757 104.599 101.443 1.00 0.00 H
ATOM 12807 HB3 PHE A 808 60.373 104.653 102.122 1.00 0.00 H
ATOM 12808 HD1 PHE A 808 61.781 106.556 101.527 1.00 0.00 H
ATOM 12809 HD2 PHE A 808 57.873 106.148 99.867 1.00 0.00 H
ATOM 12810 HE1 PHE A 808 61.768 108.955 101.168 1.00 0.00 H
ATOM 12811 HE2 PHE A 808 57.952 108.430 99.080 1.00 0.00 H
ATOM 12812 HZ PHE A 808 59.830 109.907 99.819 1.00 0.00 H
ATOM 12813 N TYR A 809 60.950 101.767 101.635 1.00 0.00 N
ATOM 12814 CA TYR A 809 60.868 100.349 102.114 1.00 0.00 C
ATOM 12815 C TYR A 809 61.317 100.194 103.577 1.00 0.00 C
ATOM 12816 O TYR A 809 62.130 100.949 104.180 1.00 0.00 O
ATOM 12817 CB TYR A 809 61.694 99.389 101.309 1.00 0.00 C
ATOM 12818 CG TYR A 809 63.182 99.522 101.460 1.00 0.00 C
ATOM 12819 CD1 TYR A 809 63.812 100.463 100.596 1.00 0.00 C
ATOM 12820 CD2 TYR A 809 64.005 98.644 102.192 1.00 0.00 C
ATOM 12821 CE1 TYR A 809 65.197 100.516 100.416 1.00 0.00 C
ATOM 12822 CE2 TYR A 809 65.406 98.725 102.099 1.00 0.00 C
ATOM 12823 CZ TYR A 809 66.010 99.615 101.175 1.00 0.00 C
ATOM 12824 OH TYR A 809 67.334 99.673 100.956 1.00 0.00 O
ATOM 12825 H TYR A 809 61.779 102.288 101.881 1.00 0.00 H
ATOM 12826 HA TYR A 809 59.851 99.986 101.962 1.00 0.00 H
ATOM 12827 HB2 TYR A 809 61.309 98.406 101.582 1.00 0.00 H
ATOM 12828 HB3 TYR A 809 61.494 99.558 100.251 1.00 0.00 H
ATOM 12829 HD1 TYR A 809 63.213 101.165 100.034 1.00 0.00 H
ATOM 12830 HD2 TYR A 809 63.574 97.825 102.748 1.00 0.00 H
ATOM 12831 HE1 TYR A 809 65.551 101.258 99.715 1.00 0.00 H
ATOM 12832 HE2 TYR A 809 66.002 98.125 102.770 1.00 0.00 H
ATOM 12833 HH TYR A 809 67.559 100.467 100.466 1.00 0.00 H
ATOM 12834 N ALA A 810 60.822 99.091 104.201 1.00 0.00 N
ATOM 12835 CA ALA A 810 61.067 98.646 105.589 1.00 0.00 C
ATOM 12836 C ALA A 810 62.419 97.871 105.596 1.00 0.00 C
ATOM 12837 O ALA A 810 62.433 96.698 105.299 1.00 0.00 O
ATOM 12838 CB ALA A 810 59.895 97.840 106.122 1.00 0.00 C
ATOM 12839 H ALA A 810 60.200 98.481 103.690 1.00 0.00 H
ATOM 12840 HA ALA A 810 61.268 99.559 106.149 1.00 0.00 H
ATOM 12841 HB1 ALA A 810 58.984 98.340 105.793 1.00 0.00 H
ATOM 12842 HB2 ALA A 810 59.763 96.790 105.860 1.00 0.00 H
ATOM 12843 HB3 ALA A 810 59.951 97.951 107.205 1.00 0.00 H
ATOM 12844 N ALA A 811 63.509 98.583 105.886 1.00 0.00 N
ATOM 12845 CA ALA A 811 64.791 98.094 106.047 1.00 0.00 C
ATOM 12846 C ALA A 811 64.919 97.445 107.398 1.00 0.00 C
ATOM 12847 O ALA A 811 64.419 97.926 108.421 1.00 0.00 O
ATOM 12848 CB ALA A 811 65.720 99.266 105.895 1.00 0.00 C
ATOM 12849 H ALA A 811 63.336 99.577 105.934 1.00 0.00 H
ATOM 12850 HA ALA A 811 65.014 97.310 105.323 1.00 0.00 H
ATOM 12851 HB1 ALA A 811 65.530 99.852 104.996 1.00 0.00 H
ATOM 12852 HB2 ALA A 811 65.575 99.911 106.762 1.00 0.00 H
ATOM 12853 HB3 ALA A 811 66.728 98.900 106.090 1.00 0.00 H
ATOM 12854 N PHE A 812 65.577 96.264 107.381 1.00 0.00 N
ATOM 12855 CA PHE A 812 65.984 95.546 108.560 1.00 0.00 C
ATOM 12856 C PHE A 812 66.945 96.415 109.376 1.00 0.00 C
ATOM 12857 O PHE A 812 67.777 97.154 108.770 1.00 0.00 O
ATOM 12858 CB PHE A 812 66.692 94.300 108.165 1.00 0.00 C
ATOM 12859 CG PHE A 812 65.923 93.173 107.368 1.00 0.00 C
ATOM 12860 CD1 PHE A 812 64.589 92.870 107.714 1.00 0.00 C
ATOM 12861 CD2 PHE A 812 66.551 92.497 106.333 1.00 0.00 C
ATOM 12862 CE1 PHE A 812 63.930 91.827 107.024 1.00 0.00 C
ATOM 12863 CE2 PHE A 812 65.896 91.480 105.697 1.00 0.00 C
ATOM 12864 CZ PHE A 812 64.609 91.122 106.036 1.00 0.00 C
ATOM 12865 H PHE A 812 65.999 95.970 106.512 1.00 0.00 H
ATOM 12866 HA PHE A 812 65.036 95.284 109.029 1.00 0.00 H
ATOM 12867 HB2 PHE A 812 67.460 94.639 107.469 1.00 0.00 H
ATOM 12868 HB3 PHE A 812 67.213 93.783 108.971 1.00 0.00 H
ATOM 12869 HD1 PHE A 812 64.036 93.494 108.400 1.00 0.00 H
ATOM 12870 HD2 PHE A 812 67.599 92.592 106.090 1.00 0.00 H
ATOM 12871 HE1 PHE A 812 62.904 91.635 107.300 1.00 0.00 H
ATOM 12872 HE2 PHE A 812 66.539 90.961 105.002 1.00 0.00 H
ATOM 12873 HZ PHE A 812 64.195 90.248 105.556 1.00 0.00 H
ATOM 12874 N PRO A 813 66.860 96.408 110.697 1.00 0.00 N
ATOM 12875 CA PRO A 813 67.867 96.789 111.651 1.00 0.00 C
ATOM 12876 C PRO A 813 69.041 95.907 111.678 1.00 0.00 C
ATOM 12877 O PRO A 813 68.947 94.944 111.040 1.00 0.00 O
ATOM 12878 CB PRO A 813 67.132 96.783 113.022 1.00 0.00 C
ATOM 12879 CG PRO A 813 66.064 95.863 112.922 1.00 0.00 C
ATOM 12880 CD PRO A 813 65.695 95.944 111.418 1.00 0.00 C
ATOM 12881 HA PRO A 813 68.127 97.832 111.470 1.00 0.00 H
ATOM 12882 HB2 PRO A 813 67.832 96.518 113.814 1.00 0.00 H
ATOM 12883 HB3 PRO A 813 66.705 97.778 113.138 1.00 0.00 H
ATOM 12884 HG2 PRO A 813 66.246 94.805 113.106 1.00 0.00 H
ATOM 12885 HG3 PRO A 813 65.255 96.182 113.579 1.00 0.00 H
ATOM 12886 HD2 PRO A 813 65.550 94.918 111.079 1.00 0.00 H
ATOM 12887 HD3 PRO A 813 64.825 96.583 111.268 1.00 0.00 H
ATOM 12888 N ASP A 814 70.129 96.330 112.283 1.00 0.00 N
ATOM 12889 CA ASP A 814 71.348 95.495 112.485 1.00 0.00 C
ATOM 12890 C ASP A 814 70.975 94.237 113.329 1.00 0.00 C
ATOM 12891 O ASP A 814 70.278 94.413 114.355 1.00 0.00 O
ATOM 12892 CB ASP A 814 72.517 96.229 113.139 1.00 0.00 C
ATOM 12893 CG ASP A 814 73.839 95.410 113.137 1.00 0.00 C
ATOM 12894 OD1 ASP A 814 74.690 95.727 114.004 1.00 0.00 O
ATOM 12895 OD2 ASP A 814 73.958 94.448 112.314 1.00 0.00 O1-
ATOM 12896 H ASP A 814 70.119 97.241 112.719 1.00 0.00 H
ATOM 12897 HA ASP A 814 71.718 95.192 111.506 1.00 0.00 H
ATOM 12898 HB2 ASP A 814 72.733 97.188 112.669 1.00 0.00 H
ATOM 12899 HB3 ASP A 814 72.206 96.323 114.179 1.00 0.00 H
ATOM 12900 N ASN A 815 71.406 93.095 112.867 1.00 0.00 N
ATOM 12901 CA ASN A 815 71.257 91.725 113.364 1.00 0.00 C
ATOM 12902 C ASN A 815 69.807 91.162 113.402 1.00 0.00 C
ATOM 12903 O ASN A 815 69.345 90.532 114.373 1.00 0.00 O
ATOM 12904 CB ASN A 815 72.090 91.516 114.752 1.00 0.00 C
ATOM 12905 CG ASN A 815 72.817 90.197 114.756 1.00 0.00 C
ATOM 12906 ND2 ASN A 815 73.233 89.795 115.982 1.00 0.00 N
ATOM 12907 OD1 ASN A 815 72.792 89.417 113.804 1.00 0.00 O
ATOM 12908 H ASN A 815 72.043 93.145 112.085 1.00 0.00 H
ATOM 12909 HA ASN A 815 71.739 91.138 112.582 1.00 0.00 H
ATOM 12910 HB2 ASN A 815 72.864 92.270 114.899 1.00 0.00 H
ATOM 12911 HB3 ASN A 815 71.373 91.533 115.573 1.00 0.00 H
ATOM 12912 HD21 ASN A 815 73.522 88.853 116.206 1.00 0.00 H
ATOM 12913 HD22 ASN A 815 73.170 90.395 116.792 1.00 0.00 H
ATOM 12914 N PHE A 816 69.053 91.325 112.356 1.00 0.00 N
ATOM 12915 CA PHE A 816 67.659 90.966 112.181 1.00 0.00 C
ATOM 12916 C PHE A 816 67.367 89.453 112.236 1.00 0.00 C
ATOM 12917 O PHE A 816 66.660 88.995 113.122 1.00 0.00 O
ATOM 12918 CB PHE A 816 67.092 91.714 110.958 1.00 0.00 C
ATOM 12919 CG PHE A 816 65.636 91.397 110.687 1.00 0.00 C
ATOM 12920 CD1 PHE A 816 65.351 90.224 109.834 1.00 0.00 C
ATOM 12921 CD2 PHE A 816 64.556 91.959 111.405 1.00 0.00 C
ATOM 12922 CE1 PHE A 816 64.040 89.695 109.807 1.00 0.00 C
ATOM 12923 CE2 PHE A 816 63.215 91.496 111.238 1.00 0.00 C
ATOM 12924 CZ PHE A 816 62.942 90.389 110.352 1.00 0.00 C
ATOM 12925 H PHE A 816 69.492 91.857 111.619 1.00 0.00 H
ATOM 12926 HA PHE A 816 67.157 91.396 113.047 1.00 0.00 H
ATOM 12927 HB2 PHE A 816 67.101 92.801 111.050 1.00 0.00 H
ATOM 12928 HB3 PHE A 816 67.606 91.333 110.076 1.00 0.00 H
ATOM 12929 HD1 PHE A 816 66.164 89.773 109.284 1.00 0.00 H
ATOM 12930 HD2 PHE A 816 64.703 92.864 111.976 1.00 0.00 H
ATOM 12931 HE1 PHE A 816 63.864 88.885 109.114 1.00 0.00 H
ATOM 12932 HE2 PHE A 816 62.370 91.884 111.788 1.00 0.00 H
ATOM 12933 HZ PHE A 816 61.952 89.988 110.192 1.00 0.00 H
ATOM 12934 N GLU A 817 68.155 88.660 111.551 1.00 0.00 N
ATOM 12935 CA GLU A 817 68.022 87.124 111.469 1.00 0.00 C
ATOM 12936 C GLU A 817 68.186 86.502 112.826 1.00 0.00 C
ATOM 12937 O GLU A 817 67.254 85.692 113.234 1.00 0.00 O
ATOM 12938 CB GLU A 817 68.846 86.619 110.333 1.00 0.00 C
ATOM 12939 CG GLU A 817 68.752 85.086 110.106 1.00 0.00 C
ATOM 12940 CD GLU A 817 69.550 84.307 111.200 1.00 0.00 C
ATOM 12941 OE1 GLU A 817 68.956 83.533 111.926 1.00 0.00 O
ATOM 12942 OE2 GLU A 817 70.786 84.559 111.343 1.00 0.00 O1-
ATOM 12943 H GLU A 817 68.715 89.093 110.830 1.00 0.00 H
ATOM 12944 HA GLU A 817 67.005 86.896 111.148 1.00 0.00 H
ATOM 12945 HB2 GLU A 817 68.610 87.134 109.401 1.00 0.00 H
ATOM 12946 HB3 GLU A 817 69.844 86.928 110.644 1.00 0.00 H
ATOM 12947 HG2 GLU A 817 67.707 84.777 110.089 1.00 0.00 H
ATOM 12948 HG3 GLU A 817 69.185 84.789 109.150 1.00 0.00 H
ATOM 12949 N THR A 818 69.201 87.008 113.574 1.00 0.00 N
ATOM 12950 CA THR A 818 69.434 86.594 114.964 1.00 0.00 C
ATOM 12951 C THR A 818 68.419 87.079 115.989 1.00 0.00 C
ATOM 12952 O THR A 818 68.131 86.448 117.065 1.00 0.00 O
ATOM 12953 CB THR A 818 70.881 87.090 115.257 1.00 0.00 C
ATOM 12954 CG2 THR A 818 71.399 86.487 116.596 1.00 0.00 C
ATOM 12955 OG1 THR A 818 71.899 86.797 114.311 1.00 0.00 O
ATOM 12956 H THR A 818 69.873 87.562 113.062 1.00 0.00 H
ATOM 12957 HA THR A 818 69.481 85.507 115.035 1.00 0.00 H
ATOM 12958 HB THR A 818 70.818 88.176 115.322 1.00 0.00 H
ATOM 12959 HG1 THR A 818 72.298 87.664 114.207 1.00 0.00 H
ATOM 12960 HG21 THR A 818 71.222 85.411 116.588 1.00 0.00 H
ATOM 12961 HG22 THR A 818 72.450 86.705 116.789 1.00 0.00 H
ATOM 12962 HG23 THR A 818 70.777 86.875 117.403 1.00 0.00 H
ATOM 12963 N THR A 819 67.826 88.260 115.789 1.00 0.00 N
ATOM 12964 CA THR A 819 66.837 88.868 116.766 1.00 0.00 C
ATOM 12965 C THR A 819 65.377 88.476 116.514 1.00 0.00 C
ATOM 12966 O THR A 819 64.468 88.748 117.323 1.00 0.00 O
ATOM 12967 CB THR A 819 67.079 90.376 116.782 1.00 0.00 C
ATOM 12968 CG2 THR A 819 66.496 91.153 117.941 1.00 0.00 C
ATOM 12969 OG1 THR A 819 68.493 90.638 116.884 1.00 0.00 O
ATOM 12970 H THR A 819 67.993 88.674 114.883 1.00 0.00 H
ATOM 12971 HA THR A 819 67.129 88.561 117.771 1.00 0.00 H
ATOM 12972 HB THR A 819 66.824 90.739 115.787 1.00 0.00 H
ATOM 12973 HG1 THR A 819 68.913 90.447 116.043 1.00 0.00 H
ATOM 12974 HG21 THR A 819 65.608 90.705 118.386 1.00 0.00 H
ATOM 12975 HG22 THR A 819 67.173 91.092 118.793 1.00 0.00 H
ATOM 12976 HG23 THR A 819 66.321 92.209 117.738 1.00 0.00 H
ATOM 12977 N TYR A 820 64.984 87.948 115.317 1.00 0.00 N
ATOM 12978 CA TYR A 820 63.623 87.622 114.811 1.00 0.00 C
ATOM 12979 C TYR A 820 63.368 86.241 114.329 1.00 0.00 C
ATOM 12980 O TYR A 820 62.484 85.581 114.818 1.00 0.00 O
ATOM 12981 CB TYR A 820 63.291 88.662 113.802 1.00 0.00 C
ATOM 12982 CG TYR A 820 63.132 90.021 114.472 1.00 0.00 C
ATOM 12983 CD1 TYR A 820 62.016 90.287 115.300 1.00 0.00 C
ATOM 12984 CD2 TYR A 820 64.194 90.872 114.352 1.00 0.00 C
ATOM 12985 CE1 TYR A 820 62.022 91.550 115.969 1.00 0.00 C
ATOM 12986 CE2 TYR A 820 64.194 92.119 114.928 1.00 0.00 C
ATOM 12987 CZ TYR A 820 63.102 92.425 115.790 1.00 0.00 C
ATOM 12988 OH TYR A 820 63.053 93.619 116.353 1.00 0.00 O
ATOM 12989 H TYR A 820 65.675 88.052 114.589 1.00 0.00 H
ATOM 12990 HA TYR A 820 62.871 87.729 115.593 1.00 0.00 H
ATOM 12991 HB2 TYR A 820 64.066 88.736 113.039 1.00 0.00 H
ATOM 12992 HB3 TYR A 820 62.397 88.398 113.238 1.00 0.00 H
ATOM 12993 HD1 TYR A 820 61.174 89.625 115.438 1.00 0.00 H
ATOM 12994 HD2 TYR A 820 64.957 90.592 113.641 1.00 0.00 H
ATOM 12995 HE1 TYR A 820 61.122 91.763 116.527 1.00 0.00 H
ATOM 12996 HE2 TYR A 820 65.012 92.823 114.900 1.00 0.00 H
ATOM 12997 HH TYR A 820 63.891 94.088 116.361 1.00 0.00 H
ATOM 12998 N LEU A 821 64.062 85.723 113.315 1.00 0.00 N
ATOM 12999 CA LEU A 821 63.765 84.460 112.618 1.00 0.00 C
ATOM 13000 C LEU A 821 64.245 83.289 113.472 1.00 0.00 C
ATOM 13001 O LEU A 821 63.357 82.429 113.774 1.00 0.00 O
ATOM 13002 CB LEU A 821 64.457 84.482 111.226 1.00 0.00 C
ATOM 13003 CG LEU A 821 63.979 85.669 110.306 1.00 0.00 C
ATOM 13004 CD1 LEU A 821 64.751 85.714 108.972 1.00 0.00 C
ATOM 13005 CD2 LEU A 821 62.426 85.641 109.939 1.00 0.00 C
ATOM 13006 H LEU A 821 64.861 86.266 113.021 1.00 0.00 H
ATOM 13007 HA LEU A 821 62.677 84.394 112.626 1.00 0.00 H
ATOM 13008 HB2 LEU A 821 65.533 84.432 111.397 1.00 0.00 H
ATOM 13009 HB3 LEU A 821 64.110 83.608 110.674 1.00 0.00 H
ATOM 13010 HG LEU A 821 64.238 86.569 110.865 1.00 0.00 H
ATOM 13011 HD11 LEU A 821 64.523 86.597 108.376 1.00 0.00 H
ATOM 13012 HD12 LEU A 821 65.820 85.843 109.140 1.00 0.00 H
ATOM 13013 HD13 LEU A 821 64.490 84.782 108.470 1.00 0.00 H
ATOM 13014 HD21 LEU A 821 62.307 84.944 109.109 1.00 0.00 H
ATOM 13015 HD22 LEU A 821 61.852 85.188 110.747 1.00 0.00 H
ATOM 13016 HD23 LEU A 821 62.150 86.685 109.787 1.00 0.00 H
ATOM 13017 N SER A 822 65.487 83.208 113.869 1.00 0.00 N
ATOM 13018 CA SER A 822 66.060 82.195 114.727 1.00 0.00 C
ATOM 13019 C SER A 822 65.665 82.294 116.188 1.00 0.00 C
ATOM 13020 O SER A 822 65.745 81.298 116.874 1.00 0.00 O
ATOM 13021 CB SER A 822 67.556 82.187 114.548 1.00 0.00 C
ATOM 13022 OG SER A 822 68.147 83.505 114.860 1.00 0.00 O
ATOM 13023 H SER A 822 66.045 83.992 113.562 1.00 0.00 H
ATOM 13024 HA SER A 822 65.687 81.248 114.337 1.00 0.00 H
ATOM 13025 HB2 SER A 822 68.050 81.565 115.295 1.00 0.00 H
ATOM 13026 HB3 SER A 822 67.882 81.791 113.587 1.00 0.00 H
ATOM 13027 HG SER A 822 68.541 83.794 114.033 1.00 0.00 H
ATOM 13028 N ASN A 823 65.267 83.474 116.636 1.00 0.00 N
ATOM 13029 CA ASN A 823 64.500 83.836 117.842 1.00 0.00 C
ATOM 13030 C ASN A 823 63.015 83.295 117.938 1.00 0.00 C
ATOM 13031 O ASN A 823 62.190 83.728 118.796 1.00 0.00 O
ATOM 13032 CB ASN A 823 64.404 85.395 117.869 1.00 0.00 C
ATOM 13033 CG ASN A 823 64.371 85.882 119.283 1.00 0.00 C
ATOM 13034 ND2 ASN A 823 63.282 86.484 119.727 1.00 0.00 N
ATOM 13035 OD1 ASN A 823 65.463 85.872 119.893 1.00 0.00 O
ATOM 13036 H ASN A 823 65.260 84.126 115.864 1.00 0.00 H
ATOM 13037 HA ASN A 823 65.085 83.434 118.669 1.00 0.00 H
ATOM 13038 HB2 ASN A 823 65.293 85.823 117.405 1.00 0.00 H
ATOM 13039 HB3 ASN A 823 63.525 85.833 117.395 1.00 0.00 H
ATOM 13040 HD21 ASN A 823 63.340 86.951 120.621 1.00 0.00 H
ATOM 13041 HD22 ASN A 823 62.377 86.424 119.284 1.00 0.00 H
ATOM 13042 N GLN A 824 62.616 82.307 117.113 1.00 0.00 N
ATOM 13043 CA GLN A 824 61.229 81.815 117.129 1.00 0.00 C
ATOM 13044 C GLN A 824 60.615 81.381 118.450 1.00 0.00 C
ATOM 13045 O GLN A 824 59.448 81.460 118.689 1.00 0.00 O
ATOM 13046 CB GLN A 824 61.248 80.679 116.045 1.00 0.00 C
ATOM 13047 CG GLN A 824 61.848 79.312 116.483 1.00 0.00 C
ATOM 13048 CD GLN A 824 61.235 78.086 115.655 1.00 0.00 C
ATOM 13049 NE2 GLN A 824 61.182 77.003 116.400 1.00 0.00 N
ATOM 13050 OE1 GLN A 824 60.781 78.109 114.523 1.00 0.00 O
ATOM 13051 H GLN A 824 63.229 82.025 116.361 1.00 0.00 H
ATOM 13052 HA GLN A 824 60.501 82.504 116.701 1.00 0.00 H
ATOM 13053 HB2 GLN A 824 60.222 80.374 115.842 1.00 0.00 H
ATOM 13054 HB3 GLN A 824 61.666 80.977 115.083 1.00 0.00 H
ATOM 13055 HG2 GLN A 824 62.917 79.387 116.282 1.00 0.00 H
ATOM 13056 HG3 GLN A 824 61.627 79.104 117.530 1.00 0.00 H
ATOM 13057 HE21 GLN A 824 60.831 76.173 115.943 1.00 0.00 H
ATOM 13058 HE22 GLN A 824 61.455 77.102 117.367 1.00 0.00 H
ATOM 13059 N ASP A 825 61.445 80.883 119.360 1.00 0.00 N
ATOM 13060 CA ASP A 825 61.025 80.220 120.622 1.00 0.00 C
ATOM 13061 C ASP A 825 61.317 81.027 121.937 1.00 0.00 C
ATOM 13062 O ASP A 825 61.304 80.441 123.002 1.00 0.00 O
ATOM 13063 CB ASP A 825 61.720 78.752 120.568 1.00 0.00 C
ATOM 13064 CG ASP A 825 61.232 77.808 119.550 1.00 0.00 C
ATOM 13065 OD1 ASP A 825 60.044 77.846 119.176 1.00 0.00 O
ATOM 13066 OD2 ASP A 825 62.017 77.052 118.981 1.00 0.00 O1-
ATOM 13067 H ASP A 825 62.446 80.991 119.279 1.00 0.00 H
ATOM 13068 HA ASP A 825 59.952 80.042 120.681 1.00 0.00 H
ATOM 13069 HB2 ASP A 825 62.804 78.860 120.624 1.00 0.00 H
ATOM 13070 HB3 ASP A 825 61.443 78.241 121.490 1.00 0.00 H
ATOM 13071 N ASN A 826 61.634 82.298 121.809 1.00 0.00 N
ATOM 13072 CA ASN A 826 61.714 83.082 122.949 1.00 0.00 C
ATOM 13073 C ASN A 826 60.380 83.576 123.449 1.00 0.00 C
ATOM 13074 O ASN A 826 59.530 83.884 122.652 1.00 0.00 O
ATOM 13075 CB ASN A 826 62.702 84.212 122.614 1.00 0.00 C
ATOM 13076 CG ASN A 826 64.212 83.732 122.644 1.00 0.00 C
ATOM 13077 ND2 ASN A 826 65.073 84.729 122.902 1.00 0.00 N
ATOM 13078 OD1 ASN A 826 64.602 82.538 122.531 1.00 0.00 O
ATOM 13079 H ASN A 826 61.655 82.767 120.914 1.00 0.00 H
ATOM 13080 HA ASN A 826 62.188 82.484 123.728 1.00 0.00 H
ATOM 13081 HB2 ASN A 826 62.423 84.634 121.648 1.00 0.00 H
ATOM 13082 HB3 ASN A 826 62.663 84.982 123.385 1.00 0.00 H
ATOM 13083 HD21 ASN A 826 66.048 84.573 122.689 1.00 0.00 H
ATOM 13084 HD22 ASN A 826 64.695 85.649 122.727 1.00 0.00 H
ATOM 13085 N ASP A 827 60.211 83.874 124.739 1.00 0.00 N
ATOM 13086 CA ASP A 827 58.882 84.134 125.270 1.00 0.00 C
ATOM 13087 C ASP A 827 58.274 85.546 124.993 1.00 0.00 C
ATOM 13088 O ASP A 827 57.399 85.988 125.780 1.00 0.00 O
ATOM 13089 CB ASP A 827 58.900 83.699 126.792 1.00 0.00 C
ATOM 13090 CG ASP A 827 60.052 84.458 127.625 1.00 0.00 C
ATOM 13091 OD1 ASP A 827 59.647 85.332 128.413 1.00 0.00 O
ATOM 13092 OD2 ASP A 827 61.243 84.024 127.521 1.00 0.00 O1-
ATOM 13093 H ASP A 827 60.872 83.566 125.437 1.00 0.00 H
ATOM 13094 HA ASP A 827 58.184 83.403 124.863 1.00 0.00 H
ATOM 13095 HB2 ASP A 827 57.879 83.856 127.139 1.00 0.00 H
ATOM 13096 HB3 ASP A 827 59.060 82.621 126.833 1.00 0.00 H
ATOM 13097 N ASN A 828 58.709 86.234 123.924 1.00 0.00 N
ATOM 13098 CA ASN A 828 58.266 87.657 123.686 1.00 0.00 C
ATOM 13099 C ASN A 828 57.244 87.696 122.533 1.00 0.00 C
ATOM 13100 O ASN A 828 56.745 88.742 122.273 1.00 0.00 O
ATOM 13101 CB ASN A 828 59.463 88.490 123.335 1.00 0.00 C
ATOM 13102 CG ASN A 828 60.309 88.084 122.100 1.00 0.00 C
ATOM 13103 ND2 ASN A 828 60.919 89.079 121.481 1.00 0.00 N
ATOM 13104 OD1 ASN A 828 60.431 86.965 121.621 1.00 0.00 O
ATOM 13105 H ASN A 828 59.329 85.770 123.275 1.00 0.00 H
ATOM 13106 HA ASN A 828 57.759 88.006 124.585 1.00 0.00 H
ATOM 13107 HB2 ASN A 828 59.093 89.483 123.081 1.00 0.00 H
ATOM 13108 HB3 ASN A 828 60.093 88.569 124.220 1.00 0.00 H
ATOM 13109 HD21 ASN A 828 61.599 88.871 120.764 1.00 0.00 H
ATOM 13110 HD22 ASN A 828 60.590 90.033 121.518 1.00 0.00 H
ATOM 13111 N TRP A 829 56.950 86.591 121.844 1.00 0.00 N
ATOM 13112 CA TRP A 829 55.864 86.453 120.794 1.00 0.00 C
ATOM 13113 C TRP A 829 54.498 86.629 121.316 1.00 0.00 C
ATOM 13114 O TRP A 829 54.161 86.257 122.460 1.00 0.00 O
ATOM 13115 CB TRP A 829 56.123 85.073 120.121 1.00 0.00 C
ATOM 13116 CG TRP A 829 57.377 85.061 119.340 1.00 0.00 C
ATOM 13117 CD1 TRP A 829 58.705 84.971 119.755 1.00 0.00 C
ATOM 13118 CD2 TRP A 829 57.489 85.051 117.877 1.00 0.00 C
ATOM 13119 CE2 TRP A 829 58.892 84.988 117.500 1.00 0.00 C
ATOM 13120 CE3 TRP A 829 56.500 85.026 116.813 1.00 0.00 C
ATOM 13121 NE1 TRP A 829 59.520 84.839 118.667 1.00 0.00 N
ATOM 13122 CZ2 TRP A 829 59.204 84.781 116.098 1.00 0.00 C
ATOM 13123 CZ3 TRP A 829 56.859 84.921 115.443 1.00 0.00 C
ATOM 13124 CH2 TRP A 829 58.188 84.771 115.101 1.00 0.00 C
ATOM 13125 H TRP A 829 57.574 85.808 121.977 1.00 0.00 H
ATOM 13126 HA TRP A 829 56.067 87.150 119.981 1.00 0.00 H
ATOM 13127 HB2 TRP A 829 56.236 84.306 120.887 1.00 0.00 H
ATOM 13128 HB3 TRP A 829 55.185 84.840 119.617 1.00 0.00 H
ATOM 13129 HD1 TRP A 829 59.084 84.969 120.766 1.00 0.00 H
ATOM 13130 HE1 TRP A 829 60.518 84.692 118.617 1.00 0.00 H
ATOM 13131 HE3 TRP A 829 55.448 84.971 117.055 1.00 0.00 H
ATOM 13132 HZ2 TRP A 829 60.253 84.673 115.865 1.00 0.00 H
ATOM 13133 HZ3 TRP A 829 56.041 84.802 114.748 1.00 0.00 H
ATOM 13134 HH2 TRP A 829 58.379 84.480 114.078 1.00 0.00 H
ATOM 13135 N ILE A 830 53.681 87.262 120.546 1.00 0.00 N
ATOM 13136 CA ILE A 830 52.379 87.814 120.926 1.00 0.00 C
ATOM 13137 C ILE A 830 51.161 87.195 120.270 1.00 0.00 C
ATOM 13138 O ILE A 830 51.150 87.099 119.063 1.00 0.00 O
ATOM 13139 CB ILE A 830 52.318 89.321 120.756 1.00 0.00 C
ATOM 13140 CG1 ILE A 830 53.694 90.067 121.113 1.00 0.00 C
ATOM 13141 CG2 ILE A 830 51.208 89.941 121.654 1.00 0.00 C
ATOM 13142 CD1 ILE A 830 53.725 91.546 121.395 1.00 0.00 C
ATOM 13143 H ILE A 830 54.084 87.614 119.690 1.00 0.00 H
ATOM 13144 HA ILE A 830 52.292 87.576 121.986 1.00 0.00 H
ATOM 13145 HB ILE A 830 52.009 89.568 119.740 1.00 0.00 H
ATOM 13146 HG12 ILE A 830 53.924 89.674 122.103 1.00 0.00 H
ATOM 13147 HG13 ILE A 830 54.433 89.926 120.325 1.00 0.00 H
ATOM 13148 HG21 ILE A 830 51.051 90.998 121.441 1.00 0.00 H
ATOM 13149 HG22 ILE A 830 50.258 89.407 121.633 1.00 0.00 H
ATOM 13150 HG23 ILE A 830 51.496 89.915 122.705 1.00 0.00 H
ATOM 13151 HD11 ILE A 830 54.765 91.863 121.474 1.00 0.00 H
ATOM 13152 HD12 ILE A 830 53.098 92.107 120.702 1.00 0.00 H
ATOM 13153 HD13 ILE A 830 53.354 91.725 122.404 1.00 0.00 H
ATOM 13154 N LYS A 831 50.107 86.830 120.989 1.00 0.00 N
ATOM 13155 CA LYS A 831 48.760 86.422 120.466 1.00 0.00 C
ATOM 13156 C LYS A 831 47.808 87.528 120.412 1.00 0.00 C
ATOM 13157 O LYS A 831 48.015 88.502 121.105 1.00 0.00 O
ATOM 13158 CB LYS A 831 48.195 85.330 121.408 1.00 0.00 C
ATOM 13159 CG LYS A 831 48.629 83.934 120.856 1.00 0.00 C
ATOM 13160 CD LYS A 831 50.041 83.491 121.264 1.00 0.00 C
ATOM 13161 CE LYS A 831 50.219 81.962 121.235 1.00 0.00 C
ATOM 13162 NZ LYS A 831 50.172 81.389 122.603 1.00 0.00 N1+
ATOM 13163 H LYS A 831 50.169 87.118 121.956 1.00 0.00 H
ATOM 13164 HA LYS A 831 48.893 85.984 119.477 1.00 0.00 H
ATOM 13165 HB2 LYS A 831 48.416 85.452 122.468 1.00 0.00 H
ATOM 13166 HB3 LYS A 831 47.108 85.346 121.333 1.00 0.00 H
ATOM 13167 HG2 LYS A 831 47.959 83.140 121.184 1.00 0.00 H
ATOM 13168 HG3 LYS A 831 48.711 83.962 119.770 1.00 0.00 H
ATOM 13169 HD2 LYS A 831 50.694 83.880 120.482 1.00 0.00 H
ATOM 13170 HD3 LYS A 831 50.303 83.873 122.251 1.00 0.00 H
ATOM 13171 HE2 LYS A 831 49.428 81.604 120.576 1.00 0.00 H
ATOM 13172 HE3 LYS A 831 51.190 81.732 120.797 1.00 0.00 H
ATOM 13173 HZ1 LYS A 831 49.390 81.831 123.065 1.00 0.00 H
ATOM 13174 HZ2 LYS A 831 49.965 80.402 122.550 1.00 0.00 H
ATOM 13175 HZ3 LYS A 831 51.041 81.612 123.067 1.00 0.00 H
ATOM 13176 N GLN A 832 46.739 87.448 119.685 1.00 0.00 N
ATOM 13177 CA GLN A 832 45.675 88.491 119.489 1.00 0.00 C
ATOM 13178 C GLN A 832 46.120 89.894 118.892 1.00 0.00 C
ATOM 13179 O GLN A 832 45.287 90.804 118.765 1.00 0.00 O
ATOM 13180 CB GLN A 832 44.878 88.742 120.785 1.00 0.00 C
ATOM 13181 CG GLN A 832 44.554 87.472 121.633 1.00 0.00 C
ATOM 13182 CD GLN A 832 43.368 87.658 122.530 1.00 0.00 C
ATOM 13183 NE2 GLN A 832 43.480 87.505 123.799 1.00 0.00 N
ATOM 13184 OE1 GLN A 832 42.236 87.988 122.043 1.00 0.00 O
ATOM 13185 H GLN A 832 46.606 86.585 119.177 1.00 0.00 H
ATOM 13186 HA GLN A 832 44.915 88.064 118.835 1.00 0.00 H
ATOM 13187 HB2 GLN A 832 45.288 89.501 121.451 1.00 0.00 H
ATOM 13188 HB3 GLN A 832 43.899 89.156 120.542 1.00 0.00 H
ATOM 13189 HG2 GLN A 832 44.386 86.573 121.040 1.00 0.00 H
ATOM 13190 HG3 GLN A 832 45.346 87.243 122.345 1.00 0.00 H
ATOM 13191 HE21 GLN A 832 42.625 87.422 124.330 1.00 0.00 H
ATOM 13192 HE22 GLN A 832 44.362 87.183 124.172 1.00 0.00 H
ATOM 13193 N TRP A 833 47.437 90.202 118.683 1.00 0.00 N
ATOM 13194 CA TRP A 833 47.896 91.531 118.371 1.00 0.00 C
ATOM 13195 C TRP A 833 47.323 92.268 117.188 1.00 0.00 C
ATOM 13196 O TRP A 833 46.957 91.652 116.206 1.00 0.00 O
ATOM 13197 CB TRP A 833 49.433 91.502 118.415 1.00 0.00 C
ATOM 13198 CG TRP A 833 50.040 92.865 118.243 1.00 0.00 C
ATOM 13199 CD1 TRP A 833 50.378 93.741 119.206 1.00 0.00 C
ATOM 13200 CD2 TRP A 833 50.439 93.504 116.969 1.00 0.00 C
ATOM 13201 CE2 TRP A 833 51.054 94.686 117.330 1.00 0.00 C
ATOM 13202 CE3 TRP A 833 50.322 93.112 115.609 1.00 0.00 C
ATOM 13203 NE1 TRP A 833 50.909 94.863 118.669 1.00 0.00 N
ATOM 13204 CZ2 TRP A 833 51.557 95.528 116.349 1.00 0.00 C
ATOM 13205 CZ3 TRP A 833 50.836 93.988 114.595 1.00 0.00 C
ATOM 13206 CH2 TRP A 833 51.467 95.141 115.016 1.00 0.00 C
ATOM 13207 H TRP A 833 48.170 89.530 118.861 1.00 0.00 H
ATOM 13208 HA TRP A 833 47.582 92.071 119.263 1.00 0.00 H
ATOM 13209 HB2 TRP A 833 49.627 91.074 119.398 1.00 0.00 H
ATOM 13210 HB3 TRP A 833 49.924 90.916 117.638 1.00 0.00 H
ATOM 13211 HD1 TRP A 833 50.212 93.530 120.252 1.00 0.00 H
ATOM 13212 HE1 TRP A 833 51.217 95.587 119.302 1.00 0.00 H
ATOM 13213 HE3 TRP A 833 49.862 92.168 115.355 1.00 0.00 H
ATOM 13214 HZ2 TRP A 833 52.081 96.459 116.512 1.00 0.00 H
ATOM 13215 HZ3 TRP A 833 50.701 93.764 113.547 1.00 0.00 H
ATOM 13216 HH2 TRP A 833 51.942 95.733 114.248 1.00 0.00 H
ATOM 13217 N ARG A 834 47.235 93.603 117.350 1.00 0.00 N
ATOM 13218 CA ARG A 834 46.561 94.431 116.356 1.00 0.00 C
ATOM 13219 C ARG A 834 47.504 95.590 115.945 1.00 0.00 C
ATOM 13220 O ARG A 834 48.060 96.272 116.806 1.00 0.00 O
ATOM 13221 CB ARG A 834 45.230 94.906 116.880 1.00 0.00 C
ATOM 13222 CG ARG A 834 44.236 93.709 116.844 1.00 0.00 C
ATOM 13223 CD ARG A 834 42.751 93.802 117.283 1.00 0.00 C
ATOM 13224 NE ARG A 834 42.059 92.520 117.330 1.00 0.00 N
ATOM 13225 CZ ARG A 834 41.562 91.903 118.396 1.00 0.00 C
ATOM 13226 NH1 ARG A 834 41.662 92.350 119.614 1.00 0.00 N1+
ATOM 13227 NH2 ARG A 834 40.864 90.783 118.187 1.00 0.00 N
ATOM 13228 H ARG A 834 47.667 94.000 118.172 1.00 0.00 H
ATOM 13229 HA ARG A 834 46.389 93.916 115.411 1.00 0.00 H
ATOM 13230 HB2 ARG A 834 45.318 95.151 117.938 1.00 0.00 H
ATOM 13231 HB3 ARG A 834 44.867 95.674 116.197 1.00 0.00 H
ATOM 13232 HG2 ARG A 834 44.204 93.239 115.861 1.00 0.00 H
ATOM 13233 HG3 ARG A 834 44.705 92.958 117.480 1.00 0.00 H
ATOM 13234 HD2 ARG A 834 42.714 94.190 118.301 1.00 0.00 H
ATOM 13235 HD3 ARG A 834 42.185 94.493 116.658 1.00 0.00 H
ATOM 13236 HE ARG A 834 41.978 92.110 116.410 1.00 0.00 H
ATOM 13237 HH11 ARG A 834 42.299 93.084 119.890 1.00 0.00 H
ATOM 13238 HH12 ARG A 834 41.399 91.655 120.298 1.00 0.00 H
ATOM 13239 HH21 ARG A 834 40.816 90.411 117.249 1.00 0.00 H
ATOM 13240 HH22 ARG A 834 40.537 90.197 118.942 1.00 0.00 H
ATOM 13241 N TYR A 835 47.495 95.984 114.695 1.00 0.00 N
ATOM 13242 CA TYR A 835 48.256 97.027 114.168 1.00 0.00 C
ATOM 13243 C TYR A 835 47.825 98.439 114.547 1.00 0.00 C
ATOM 13244 O TYR A 835 46.636 98.826 114.722 1.00 0.00 O
ATOM 13245 CB TYR A 835 48.162 97.021 112.624 1.00 0.00 C
ATOM 13246 CG TYR A 835 48.885 98.095 111.888 1.00 0.00 C
ATOM 13247 CD1 TYR A 835 48.138 98.968 111.119 1.00 0.00 C
ATOM 13248 CD2 TYR A 835 50.280 98.246 111.835 1.00 0.00 C
ATOM 13249 CE1 TYR A 835 48.753 99.988 110.323 1.00 0.00 C
ATOM 13250 CE2 TYR A 835 50.919 99.285 111.117 1.00 0.00 C
ATOM 13251 CZ TYR A 835 50.161 100.116 110.285 1.00 0.00 C
ATOM 13252 OH TYR A 835 50.722 101.059 109.438 1.00 0.00 O
ATOM 13253 H TYR A 835 47.066 95.400 113.991 1.00 0.00 H
ATOM 13254 HA TYR A 835 49.302 96.853 114.417 1.00 0.00 H
ATOM 13255 HB2 TYR A 835 48.640 96.132 112.214 1.00 0.00 H
ATOM 13256 HB3 TYR A 835 47.115 96.910 112.339 1.00 0.00 H
ATOM 13257 HD1 TYR A 835 47.070 98.880 110.982 1.00 0.00 H
ATOM 13258 HD2 TYR A 835 50.903 97.617 112.453 1.00 0.00 H
ATOM 13259 HE1 TYR A 835 48.168 100.565 109.622 1.00 0.00 H
ATOM 13260 HE2 TYR A 835 51.991 99.395 111.180 1.00 0.00 H
ATOM 13261 HH TYR A 835 51.616 100.791 109.212 1.00 0.00 H
ATOM 13262 N ASN A 836 48.805 99.372 114.615 1.00 0.00 N
ATOM 13263 CA ASN A 836 48.680 100.786 114.919 1.00 0.00 C
ATOM 13264 C ASN A 836 49.862 101.521 114.201 1.00 0.00 C
ATOM 13265 O ASN A 836 51.046 101.188 114.450 1.00 0.00 O
ATOM 13266 CB ASN A 836 48.740 101.083 116.428 1.00 0.00 C
ATOM 13267 CG ASN A 836 48.724 102.582 116.744 1.00 0.00 C
ATOM 13268 ND2 ASN A 836 48.667 102.974 118.042 1.00 0.00 N
ATOM 13269 OD1 ASN A 836 48.564 103.425 115.921 1.00 0.00 O
ATOM 13270 H ASN A 836 49.737 99.086 114.353 1.00 0.00 H
ATOM 13271 HA ASN A 836 47.701 101.157 114.614 1.00 0.00 H
ATOM 13272 HB2 ASN A 836 47.909 100.631 116.970 1.00 0.00 H
ATOM 13273 HB3 ASN A 836 49.681 100.681 116.804 1.00 0.00 H
ATOM 13274 HD21 ASN A 836 48.499 103.942 118.278 1.00 0.00 H
ATOM 13275 HD22 ASN A 836 48.712 102.315 118.806 1.00 0.00 H
ATOM 13276 N PRO A 837 49.598 102.394 113.279 1.00 0.00 N
ATOM 13277 CA PRO A 837 50.632 103.156 112.448 1.00 0.00 C
ATOM 13278 C PRO A 837 51.613 103.991 113.283 1.00 0.00 C
ATOM 13279 O PRO A 837 52.668 104.268 112.778 1.00 0.00 O
ATOM 13280 CB PRO A 837 49.814 104.072 111.605 1.00 0.00 C
ATOM 13281 CG PRO A 837 48.484 103.396 111.433 1.00 0.00 C
ATOM 13282 CD PRO A 837 48.255 102.689 112.716 1.00 0.00 C
ATOM 13283 HA PRO A 837 51.237 102.512 111.810 1.00 0.00 H
ATOM 13284 HB2 PRO A 837 49.688 105.060 112.047 1.00 0.00 H
ATOM 13285 HB3 PRO A 837 50.252 104.355 110.648 1.00 0.00 H
ATOM 13286 HG2 PRO A 837 47.681 104.046 111.085 1.00 0.00 H
ATOM 13287 HG3 PRO A 837 48.715 102.697 110.629 1.00 0.00 H
ATOM 13288 HD2 PRO A 837 47.682 103.305 113.409 1.00 0.00 H
ATOM 13289 HD3 PRO A 837 47.662 101.807 112.476 1.00 0.00 H
ATOM 13290 N ASP A 838 51.310 104.199 114.586 1.00 0.00 N
ATOM 13291 CA ASP A 838 52.153 104.954 115.420 1.00 0.00 C
ATOM 13292 C ASP A 838 53.295 104.274 116.138 1.00 0.00 C
ATOM 13293 O ASP A 838 54.144 104.997 116.584 1.00 0.00 O
ATOM 13294 CB ASP A 838 51.181 105.679 116.390 1.00 0.00 C
ATOM 13295 CG ASP A 838 50.302 106.707 115.657 1.00 0.00 C
ATOM 13296 OD1 ASP A 838 50.847 107.601 115.038 1.00 0.00 O
ATOM 13297 OD2 ASP A 838 49.055 106.742 115.917 1.00 0.00 O1-
ATOM 13298 H ASP A 838 50.426 103.890 114.963 1.00 0.00 H
ATOM 13299 HA ASP A 838 52.657 105.728 114.841 1.00 0.00 H
ATOM 13300 HB2 ASP A 838 50.490 104.960 116.830 1.00 0.00 H
ATOM 13301 HB3 ASP A 838 51.774 106.266 117.093 1.00 0.00 H
ATOM 13302 N GLU A 839 53.349 102.910 116.117 1.00 0.00 N
ATOM 13303 CA GLU A 839 54.462 102.160 116.645 1.00 0.00 C
ATOM 13304 C GLU A 839 55.675 102.129 115.690 1.00 0.00 C
ATOM 13305 O GLU A 839 56.668 101.465 115.994 1.00 0.00 O
ATOM 13306 CB GLU A 839 54.086 100.680 116.834 1.00 0.00 C
ATOM 13307 CG GLU A 839 52.900 100.405 117.729 1.00 0.00 C
ATOM 13308 CD GLU A 839 53.121 100.994 119.142 1.00 0.00 C
ATOM 13309 OE1 GLU A 839 53.110 102.247 119.335 1.00 0.00 O
ATOM 13310 OE2 GLU A 839 53.259 100.149 120.058 1.00 0.00 O1-
ATOM 13311 H GLU A 839 52.535 102.461 115.724 1.00 0.00 H
ATOM 13312 HA GLU A 839 54.829 102.520 117.606 1.00 0.00 H
ATOM 13313 HB2 GLU A 839 54.066 100.169 115.871 1.00 0.00 H
ATOM 13314 HB3 GLU A 839 54.875 100.142 117.359 1.00 0.00 H
ATOM 13315 HG2 GLU A 839 52.059 100.905 117.249 1.00 0.00 H
ATOM 13316 HG3 GLU A 839 52.753 99.328 117.650 1.00 0.00 H
ATOM 13317 N VAL A 840 55.523 102.703 114.490 1.00 0.00 N
ATOM 13318 CA VAL A 840 56.486 102.703 113.350 1.00 0.00 C
ATOM 13319 C VAL A 840 57.184 104.030 113.196 1.00 0.00 C
ATOM 13320 O VAL A 840 56.561 105.082 113.477 1.00 0.00 O
ATOM 13321 CB VAL A 840 55.685 102.291 112.063 1.00 0.00 C
ATOM 13322 CG1 VAL A 840 56.590 102.530 110.839 1.00 0.00 C
ATOM 13323 CG2 VAL A 840 55.310 100.836 112.100 1.00 0.00 C
ATOM 13324 H VAL A 840 54.678 103.191 114.232 1.00 0.00 H
ATOM 13325 HA VAL A 840 57.228 101.935 113.568 1.00 0.00 H
ATOM 13326 HB VAL A 840 54.755 102.852 111.964 1.00 0.00 H
ATOM 13327 HG11 VAL A 840 56.740 103.552 110.492 1.00 0.00 H
ATOM 13328 HG12 VAL A 840 57.563 102.140 111.139 1.00 0.00 H
ATOM 13329 HG13 VAL A 840 56.104 102.038 109.997 1.00 0.00 H
ATOM 13330 HG21 VAL A 840 55.144 100.436 111.100 1.00 0.00 H
ATOM 13331 HG22 VAL A 840 56.107 100.231 112.533 1.00 0.00 H
ATOM 13332 HG23 VAL A 840 54.366 100.774 112.641 1.00 0.00 H
ATOM 13333 N CYS A 841 58.513 104.056 112.899 1.00 0.00 N
ATOM 13334 CA CYS A 841 59.388 105.281 112.708 1.00 0.00 C
ATOM 13335 C CYS A 841 59.434 105.804 111.197 1.00 0.00 C
ATOM 13336 O CYS A 841 60.442 105.746 110.450 1.00 0.00 O
ATOM 13337 CB CYS A 841 60.800 105.032 113.274 1.00 0.00 C
ATOM 13338 SG CYS A 841 60.926 104.635 115.080 1.00 0.00 S
ATOM 13339 H CYS A 841 59.011 103.178 112.859 1.00 0.00 H
ATOM 13340 HA CYS A 841 58.862 106.034 113.295 1.00 0.00 H
ATOM 13341 HB2 CYS A 841 61.239 104.246 112.660 1.00 0.00 H
ATOM 13342 HB3 CYS A 841 61.423 105.906 113.079 1.00 0.00 H
ATOM 13343 HG CYS A 841 60.669 103.327 114.998 1.00 0.00 H
ATOM 13344 N TRP A 842 58.294 106.353 110.847 1.00 0.00 N
ATOM 13345 CA TRP A 842 58.164 107.186 109.673 1.00 0.00 C
ATOM 13346 C TRP A 842 59.158 108.372 109.581 1.00 0.00 C
ATOM 13347 O TRP A 842 59.505 108.860 108.467 1.00 0.00 O
ATOM 13348 CB TRP A 842 56.747 107.723 109.640 1.00 0.00 C
ATOM 13349 CG TRP A 842 55.706 106.808 109.965 1.00 0.00 C
ATOM 13350 CD1 TRP A 842 54.962 106.819 111.108 1.00 0.00 C
ATOM 13351 CD2 TRP A 842 55.203 105.688 109.191 1.00 0.00 C
ATOM 13352 CE2 TRP A 842 54.112 105.085 109.949 1.00 0.00 C
ATOM 13353 CE3 TRP A 842 55.477 105.041 107.924 1.00 0.00 C
ATOM 13354 NE1 TRP A 842 54.095 105.811 111.130 1.00 0.00 N
ATOM 13355 CZ2 TRP A 842 53.487 103.904 109.492 1.00 0.00 C
ATOM 13356 CZ3 TRP A 842 54.797 103.972 107.439 1.00 0.00 C
ATOM 13357 CH2 TRP A 842 53.808 103.326 108.236 1.00 0.00 C
ATOM 13358 H TRP A 842 57.443 106.157 111.355 1.00 0.00 H
ATOM 13359 HA TRP A 842 58.296 106.470 108.862 1.00 0.00 H
ATOM 13360 HB2 TRP A 842 56.576 108.616 110.241 1.00 0.00 H
ATOM 13361 HB3 TRP A 842 56.500 108.156 108.671 1.00 0.00 H
ATOM 13362 HD1 TRP A 842 55.037 107.538 111.910 1.00 0.00 H
ATOM 13363 HE1 TRP A 842 53.685 105.556 112.017 1.00 0.00 H
ATOM 13364 HE3 TRP A 842 56.321 105.363 107.333 1.00 0.00 H
ATOM 13365 HZ2 TRP A 842 52.736 103.478 110.140 1.00 0.00 H
ATOM 13366 HZ3 TRP A 842 55.016 103.682 106.422 1.00 0.00 H
ATOM 13367 HH2 TRP A 842 53.208 102.509 107.863 1.00 0.00 H
ATOM 13368 N GLY A 843 59.612 108.911 110.738 1.00 0.00 N
ATOM 13369 CA GLY A 843 60.525 110.105 110.715 1.00 0.00 C
ATOM 13370 C GLY A 843 59.956 111.326 109.948 1.00 0.00 C
ATOM 13371 O GLY A 843 58.798 111.710 110.045 1.00 0.00 O
ATOM 13372 H GLY A 843 59.385 108.572 111.662 1.00 0.00 H
ATOM 13373 HA2 GLY A 843 60.757 110.325 111.757 1.00 0.00 H
ATOM 13374 HA3 GLY A 843 61.420 109.744 110.207 1.00 0.00 H
ATOM 13375 N SER A 844 60.871 112.009 109.231 1.00 0.00 N
ATOM 13376 CA SER A 844 60.484 113.055 108.327 1.00 0.00 C
ATOM 13377 C SER A 844 59.406 112.761 107.251 1.00 0.00 C
ATOM 13378 O SER A 844 58.826 113.778 106.833 1.00 0.00 O
ATOM 13379 CB SER A 844 61.597 113.733 107.586 1.00 0.00 C
ATOM 13380 OG SER A 844 62.225 112.876 106.794 1.00 0.00 O
ATOM 13381 H SER A 844 61.808 111.655 109.106 1.00 0.00 H
ATOM 13382 HA SER A 844 60.077 113.930 108.835 1.00 0.00 H
ATOM 13383 HB2 SER A 844 61.101 114.462 106.946 1.00 0.00 H
ATOM 13384 HB3 SER A 844 62.369 114.162 108.225 1.00 0.00 H
ATOM 13385 HG SER A 844 62.956 112.473 107.269 1.00 0.00 H
ATOM 13386 N LEU A 845 59.127 111.574 106.819 1.00 0.00 N
ATOM 13387 CA LEU A 845 57.877 111.164 106.013 1.00 0.00 C
ATOM 13388 C LEU A 845 56.633 111.392 106.807 1.00 0.00 C
ATOM 13389 O LEU A 845 56.624 111.057 108.054 1.00 0.00 O
ATOM 13390 CB LEU A 845 57.981 109.788 105.578 1.00 0.00 C
ATOM 13391 CG LEU A 845 59.340 109.409 105.024 1.00 0.00 C
ATOM 13392 CD1 LEU A 845 59.308 107.954 104.554 1.00 0.00 C
ATOM 13393 CD2 LEU A 845 59.644 110.172 103.762 1.00 0.00 C
ATOM 13394 H LEU A 845 59.678 110.806 107.174 1.00 0.00 H
ATOM 13395 HA LEU A 845 57.908 111.808 105.134 1.00 0.00 H
ATOM 13396 HB2 LEU A 845 57.580 109.114 106.335 1.00 0.00 H
ATOM 13397 HB3 LEU A 845 57.271 109.621 104.768 1.00 0.00 H
ATOM 13398 HG LEU A 845 60.043 109.611 105.833 1.00 0.00 H
ATOM 13399 HD11 LEU A 845 58.755 107.886 103.617 1.00 0.00 H
ATOM 13400 HD12 LEU A 845 60.329 107.594 104.426 1.00 0.00 H
ATOM 13401 HD13 LEU A 845 58.700 107.335 105.214 1.00 0.00 H
ATOM 13402 HD21 LEU A 845 58.729 110.116 103.173 1.00 0.00 H
ATOM 13403 HD22 LEU A 845 60.020 111.178 103.951 1.00 0.00 H
ATOM 13404 HD23 LEU A 845 60.433 109.672 103.201 1.00 0.00 H
ATOM 13405 N GLN A 846 55.480 111.746 106.207 1.00 0.00 N
ATOM 13406 CA GLN A 846 54.161 111.646 106.854 1.00 0.00 C
ATOM 13407 C GLN A 846 53.106 110.845 106.041 1.00 0.00 C
ATOM 13408 O GLN A 846 52.989 111.153 104.850 1.00 0.00 O
ATOM 13409 CB GLN A 846 53.733 113.032 107.310 1.00 0.00 C
ATOM 13410 CG GLN A 846 52.333 113.164 107.903 1.00 0.00 C
ATOM 13411 CD GLN A 846 52.425 112.893 109.365 1.00 0.00 C
ATOM 13412 NE2 GLN A 846 52.591 113.947 110.058 1.00 0.00 N
ATOM 13413 OE1 GLN A 846 52.276 111.815 109.844 1.00 0.00 O
ATOM 13414 H GLN A 846 55.447 111.956 105.220 1.00 0.00 H
ATOM 13415 HA GLN A 846 54.218 111.108 107.800 1.00 0.00 H
ATOM 13416 HB2 GLN A 846 54.424 113.337 108.096 1.00 0.00 H
ATOM 13417 HB3 GLN A 846 53.906 113.744 106.504 1.00 0.00 H
ATOM 13418 HG2 GLN A 846 51.945 114.175 107.782 1.00 0.00 H
ATOM 13419 HG3 GLN A 846 51.623 112.486 107.428 1.00 0.00 H
ATOM 13420 HE21 GLN A 846 52.788 113.805 111.038 1.00 0.00 H
ATOM 13421 HE22 GLN A 846 52.821 114.872 109.723 1.00 0.00 H
ATOM 13422 N LEU A 847 52.455 109.894 106.699 1.00 0.00 N
ATOM 13423 CA LEU A 847 51.566 108.933 106.010 1.00 0.00 C
ATOM 13424 C LEU A 847 50.175 109.448 105.713 1.00 0.00 C
ATOM 13425 O LEU A 847 49.602 110.149 106.526 1.00 0.00 O
ATOM 13426 CB LEU A 847 51.586 107.719 106.844 1.00 0.00 C
ATOM 13427 CG LEU A 847 50.882 106.482 106.392 1.00 0.00 C
ATOM 13428 CD1 LEU A 847 51.416 106.096 105.009 1.00 0.00 C
ATOM 13429 CD2 LEU A 847 51.168 105.460 107.510 1.00 0.00 C
ATOM 13430 H LEU A 847 52.605 109.740 107.686 1.00 0.00 H
ATOM 13431 HA LEU A 847 51.955 108.656 105.031 1.00 0.00 H
ATOM 13432 HB2 LEU A 847 52.642 107.459 106.926 1.00 0.00 H
ATOM 13433 HB3 LEU A 847 51.286 107.819 107.887 1.00 0.00 H
ATOM 13434 HG LEU A 847 49.799 106.458 106.278 1.00 0.00 H
ATOM 13435 HD11 LEU A 847 50.966 105.146 104.721 1.00 0.00 H
ATOM 13436 HD12 LEU A 847 50.998 106.849 104.342 1.00 0.00 H
ATOM 13437 HD13 LEU A 847 52.501 105.996 104.963 1.00 0.00 H
ATOM 13438 HD21 LEU A 847 51.086 104.461 107.081 1.00 0.00 H
ATOM 13439 HD22 LEU A 847 52.188 105.520 107.891 1.00 0.00 H
ATOM 13440 HD23 LEU A 847 50.409 105.631 108.273 1.00 0.00 H
ATOM 13441 N LYS A 848 49.573 109.066 104.580 1.00 0.00 N
ATOM 13442 CA LYS A 848 48.089 109.004 104.318 1.00 0.00 C
ATOM 13443 C LYS A 848 47.361 107.872 105.052 1.00 0.00 C
ATOM 13444 O LYS A 848 47.465 106.706 104.734 1.00 0.00 O
ATOM 13445 CB LYS A 848 48.014 108.940 102.765 1.00 0.00 C
ATOM 13446 CG LYS A 848 46.528 109.176 102.440 1.00 0.00 C
ATOM 13447 CD LYS A 848 46.077 109.056 101.019 1.00 0.00 C
ATOM 13448 CE LYS A 848 46.258 110.267 100.090 1.00 0.00 C
ATOM 13449 NZ LYS A 848 45.924 109.909 98.683 1.00 0.00 N1+
ATOM 13450 H LYS A 848 50.188 108.714 103.860 1.00 0.00 H
ATOM 13451 HA LYS A 848 47.754 109.961 104.718 1.00 0.00 H
ATOM 13452 HB2 LYS A 848 48.670 109.675 102.298 1.00 0.00 H
ATOM 13453 HB3 LYS A 848 48.531 108.094 102.314 1.00 0.00 H
ATOM 13454 HG2 LYS A 848 45.942 108.409 102.946 1.00 0.00 H
ATOM 13455 HG3 LYS A 848 46.194 110.154 102.788 1.00 0.00 H
ATOM 13456 HD2 LYS A 848 46.634 108.210 100.614 1.00 0.00 H
ATOM 13457 HD3 LYS A 848 45.046 108.711 101.097 1.00 0.00 H
ATOM 13458 HE2 LYS A 848 45.573 111.018 100.484 1.00 0.00 H
ATOM 13459 HE3 LYS A 848 47.266 110.663 100.213 1.00 0.00 H
ATOM 13460 HZ1 LYS A 848 46.408 109.060 98.429 1.00 0.00 H
ATOM 13461 HZ2 LYS A 848 44.940 109.713 98.565 1.00 0.00 H
ATOM 13462 HZ3 LYS A 848 46.091 110.621 97.987 1.00 0.00 H
ATOM 13463 N ARG A 849 46.624 108.129 106.100 1.00 0.00 N
ATOM 13464 CA ARG A 849 45.955 107.099 106.939 1.00 0.00 C
ATOM 13465 C ARG A 849 44.676 106.666 106.202 1.00 0.00 C
ATOM 13466 O ARG A 849 44.149 107.357 105.386 1.00 0.00 O
ATOM 13467 CB ARG A 849 45.806 107.545 108.371 1.00 0.00 C
ATOM 13468 CG ARG A 849 47.122 107.432 109.140 1.00 0.00 C
ATOM 13469 CD ARG A 849 46.997 108.116 110.449 1.00 0.00 C
ATOM 13470 NE ARG A 849 48.343 108.271 110.986 1.00 0.00 N
ATOM 13471 CZ ARG A 849 48.760 108.053 112.218 1.00 0.00 C
ATOM 13472 NH1 ARG A 849 48.177 107.321 113.113 1.00 0.00 N1+
ATOM 13473 NH2 ARG A 849 49.897 108.572 112.612 1.00 0.00 N
ATOM 13474 H ARG A 849 46.420 109.069 106.409 1.00 0.00 H
ATOM 13475 HA ARG A 849 46.594 106.217 106.984 1.00 0.00 H
ATOM 13476 HB2 ARG A 849 45.301 108.504 108.483 1.00 0.00 H
ATOM 13477 HB3 ARG A 849 45.118 106.831 108.824 1.00 0.00 H
ATOM 13478 HG2 ARG A 849 47.188 106.352 109.273 1.00 0.00 H
ATOM 13479 HG3 ARG A 849 47.958 107.884 108.607 1.00 0.00 H
ATOM 13480 HD2 ARG A 849 46.510 109.083 110.323 1.00 0.00 H
ATOM 13481 HD3 ARG A 849 46.400 107.538 111.155 1.00 0.00 H
ATOM 13482 HE ARG A 849 48.882 108.781 110.301 1.00 0.00 H
ATOM 13483 HH11 ARG A 849 47.258 106.943 112.937 1.00 0.00 H
ATOM 13484 HH12 ARG A 849 48.602 107.160 114.015 1.00 0.00 H
ATOM 13485 HH21 ARG A 849 50.203 109.252 111.931 1.00 0.00 H
ATOM 13486 HH22 ARG A 849 50.254 108.500 113.554 1.00 0.00 H
ATOM 13487 N ASP A 850 44.125 105.545 106.590 1.00 0.00 N
ATOM 13488 CA ASP A 850 42.873 104.893 106.062 1.00 0.00 C
ATOM 13489 C ASP A 850 41.545 105.389 106.662 1.00 0.00 C
ATOM 13490 O ASP A 850 40.546 104.637 106.572 1.00 0.00 O
ATOM 13491 CB ASP A 850 42.990 103.401 106.141 1.00 0.00 C
ATOM 13492 CG ASP A 850 43.326 102.891 107.580 1.00 0.00 C
ATOM 13493 OD1 ASP A 850 43.260 103.691 108.505 1.00 0.00 O
ATOM 13494 OD2 ASP A 850 43.673 101.691 107.691 1.00 0.00 O1-
ATOM 13495 H ASP A 850 44.664 105.056 107.290 1.00 0.00 H
ATOM 13496 HA ASP A 850 42.719 105.129 105.009 1.00 0.00 H
ATOM 13497 HB2 ASP A 850 42.112 102.908 105.724 1.00 0.00 H
ATOM 13498 HB3 ASP A 850 43.832 103.058 105.541 1.00 0.00 H
ATOM 13499 N ILE A 851 41.606 106.567 107.306 1.00 0.00 N
ATOM 13500 CA ILE A 851 40.414 107.125 107.973 1.00 0.00 C
ATOM 13501 C ILE A 851 40.088 108.498 107.371 1.00 0.00 C
ATOM 13502 O ILE A 851 40.961 109.405 107.456 1.00 0.00 O
ATOM 13503 CB ILE A 851 40.652 107.166 109.483 1.00 0.00 C
ATOM 13504 CG1 ILE A 851 39.561 108.011 110.266 1.00 0.00 C
ATOM 13505 CG2 ILE A 851 42.103 107.554 109.936 1.00 0.00 C
ATOM 13506 CD1 ILE A 851 39.577 107.537 111.720 1.00 0.00 C
ATOM 13507 H ILE A 851 42.507 107.022 107.333 1.00 0.00 H
ATOM 13508 HA ILE A 851 39.527 106.501 107.856 1.00 0.00 H
ATOM 13509 HB ILE A 851 40.629 106.149 109.876 1.00 0.00 H
ATOM 13510 HG12 ILE A 851 39.853 109.061 110.266 1.00 0.00 H
ATOM 13511 HG13 ILE A 851 38.573 107.794 109.859 1.00 0.00 H
ATOM 13512 HG21 ILE A 851 42.196 107.508 111.021 1.00 0.00 H
ATOM 13513 HG22 ILE A 851 42.934 106.976 109.532 1.00 0.00 H
ATOM 13514 HG23 ILE A 851 42.239 108.617 109.739 1.00 0.00 H
ATOM 13515 HD11 ILE A 851 39.043 108.291 112.299 1.00 0.00 H
ATOM 13516 HD12 ILE A 851 39.035 106.594 111.783 1.00 0.00 H
ATOM 13517 HD13 ILE A 851 40.556 107.363 112.168 1.00 0.00 H
ATOM 13518 N PRO A 852 38.841 108.877 106.914 1.00 0.00 N
ATOM 13519 CA PRO A 852 38.448 110.256 106.492 1.00 0.00 C
ATOM 13520 C PRO A 852 38.484 111.341 107.575 1.00 0.00 C
ATOM 13521 O PRO A 852 38.132 111.130 108.756 1.00 0.00 O
ATOM 13522 CB PRO A 852 37.070 110.124 105.854 1.00 0.00 C
ATOM 13523 CG PRO A 852 37.054 108.669 105.375 1.00 0.00 C
ATOM 13524 CD PRO A 852 37.744 108.041 106.596 1.00 0.00 C
ATOM 13525 HA PRO A 852 39.212 110.581 105.787 1.00 0.00 H
ATOM 13526 HB2 PRO A 852 36.238 110.452 106.476 1.00 0.00 H
ATOM 13527 HB3 PRO A 852 36.996 110.719 104.943 1.00 0.00 H
ATOM 13528 HG2 PRO A 852 35.994 108.428 105.299 1.00 0.00 H
ATOM 13529 HG3 PRO A 852 37.603 108.587 104.436 1.00 0.00 H
ATOM 13530 HD2 PRO A 852 37.050 107.999 107.436 1.00 0.00 H
ATOM 13531 HD3 PRO A 852 37.871 106.972 106.424 1.00 0.00 H
ATOM 13532 N GLN A 853 38.957 112.513 107.163 1.00 0.00 N
ATOM 13533 CA GLN A 853 39.087 113.697 108.111 1.00 0.00 C
ATOM 13534 C GLN A 853 38.981 115.077 107.421 1.00 0.00 C
ATOM 13535 O GLN A 853 39.179 115.147 106.167 1.00 0.00 O
ATOM 13536 CB GLN A 853 40.273 113.490 109.011 1.00 0.00 C
ATOM 13537 CG GLN A 853 41.565 113.608 108.189 1.00 0.00 C
ATOM 13538 CD GLN A 853 42.762 114.194 108.922 1.00 0.00 C
ATOM 13539 NE2 GLN A 853 43.893 114.341 108.332 1.00 0.00 N
ATOM 13540 OE1 GLN A 853 42.622 114.739 110.043 1.00 0.00 O
ATOM 13541 H GLN A 853 39.196 112.640 106.190 1.00 0.00 H
ATOM 13542 HA GLN A 853 38.211 113.621 108.754 1.00 0.00 H
ATOM 13543 HB2 GLN A 853 40.284 114.190 109.847 1.00 0.00 H
ATOM 13544 HB3 GLN A 853 40.174 112.536 109.527 1.00 0.00 H
ATOM 13545 HG2 GLN A 853 41.867 112.590 107.944 1.00 0.00 H
ATOM 13546 HG3 GLN A 853 41.422 114.217 107.297 1.00 0.00 H
ATOM 13547 HE21 GLN A 853 44.703 114.508 108.912 1.00 0.00 H
ATOM 13548 HE22 GLN A 853 44.074 113.828 107.481 1.00 0.00 H
ATOM 13549 N SER A 854 38.740 116.143 108.199 1.00 0.00 N
ATOM 13550 CA SER A 854 38.453 117.412 107.624 1.00 0.00 C
ATOM 13551 C SER A 854 39.688 117.983 107.048 1.00 0.00 C
ATOM 13552 O SER A 854 40.714 118.130 107.715 1.00 0.00 O
ATOM 13553 CB SER A 854 37.819 118.387 108.673 1.00 0.00 C
ATOM 13554 OG SER A 854 37.444 119.605 107.999 1.00 0.00 O
ATOM 13555 H SER A 854 38.520 115.995 109.174 1.00 0.00 H
ATOM 13556 HA SER A 854 37.634 117.261 106.921 1.00 0.00 H
ATOM 13557 HB2 SER A 854 37.050 117.841 109.219 1.00 0.00 H
ATOM 13558 HB3 SER A 854 38.558 118.661 109.427 1.00 0.00 H
ATOM 13559 HG SER A 854 36.561 119.467 107.649 1.00 0.00 H
ATOM 13560 N PRO A 855 39.711 118.428 105.784 1.00 0.00 N
ATOM 13561 CA PRO A 855 40.745 119.345 105.352 1.00 0.00 C
ATOM 13562 C PRO A 855 40.814 120.618 106.261 1.00 0.00 C
ATOM 13563 O PRO A 855 41.992 121.093 106.378 1.00 0.00 O
ATOM 13564 CB PRO A 855 40.513 119.694 103.874 1.00 0.00 C
ATOM 13565 CG PRO A 855 38.964 119.499 103.775 1.00 0.00 C
ATOM 13566 CD PRO A 855 38.638 118.403 104.829 1.00 0.00 C
ATOM 13567 HA PRO A 855 41.690 118.817 105.483 1.00 0.00 H
ATOM 13568 HB2 PRO A 855 40.928 120.610 103.454 1.00 0.00 H
ATOM 13569 HB3 PRO A 855 41.016 118.875 103.359 1.00 0.00 H
ATOM 13570 HG2 PRO A 855 38.493 120.386 104.198 1.00 0.00 H
ATOM 13571 HG3 PRO A 855 38.551 119.200 102.812 1.00 0.00 H
ATOM 13572 HD2 PRO A 855 37.669 118.470 105.323 1.00 0.00 H
ATOM 13573 HD3 PRO A 855 38.612 117.416 104.368 1.00 0.00 H
ATOM 13574 N PHE A 856 39.757 121.101 106.941 1.00 0.00 N
ATOM 13575 CA PHE A 856 39.998 122.246 107.818 1.00 0.00 C
ATOM 13576 C PHE A 856 40.808 121.964 109.124 1.00 0.00 C
ATOM 13577 O PHE A 856 40.973 122.856 109.941 1.00 0.00 O
ATOM 13578 CB PHE A 856 38.788 122.995 108.205 1.00 0.00 C
ATOM 13579 CG PHE A 856 37.727 123.243 107.074 1.00 0.00 C
ATOM 13580 CD1 PHE A 856 36.440 122.882 107.301 1.00 0.00 C
ATOM 13581 CD2 PHE A 856 38.055 123.967 105.922 1.00 0.00 C
ATOM 13582 CE1 PHE A 856 35.539 122.928 106.212 1.00 0.00 C
ATOM 13583 CE2 PHE A 856 37.181 123.961 104.768 1.00 0.00 C
ATOM 13584 CZ PHE A 856 35.956 123.383 104.948 1.00 0.00 C
ATOM 13585 H PHE A 856 38.850 120.664 106.857 1.00 0.00 H
ATOM 13586 HA PHE A 856 40.700 122.957 107.383 1.00 0.00 H
ATOM 13587 HB2 PHE A 856 38.270 122.403 108.959 1.00 0.00 H
ATOM 13588 HB3 PHE A 856 38.972 124.024 108.515 1.00 0.00 H
ATOM 13589 HD1 PHE A 856 36.037 122.581 108.257 1.00 0.00 H
ATOM 13590 HD2 PHE A 856 39.093 124.257 105.838 1.00 0.00 H
ATOM 13591 HE1 PHE A 856 34.523 122.600 106.371 1.00 0.00 H
ATOM 13592 HE2 PHE A 856 37.458 124.473 103.858 1.00 0.00 H
ATOM 13593 HZ PHE A 856 35.135 123.410 104.247 1.00 0.00 H
ATOM 13594 N THR A 857 41.507 120.764 109.293 1.00 0.00 N
ATOM 13595 CA THR A 857 42.607 120.527 110.275 1.00 0.00 C
ATOM 13596 C THR A 857 43.843 121.283 109.964 1.00 0.00 C
ATOM 13597 O THR A 857 44.184 121.491 108.808 1.00 0.00 O
ATOM 13598 CB THR A 857 42.978 119.048 110.386 1.00 0.00 C
ATOM 13599 CG2 THR A 857 43.745 118.492 109.268 1.00 0.00 C
ATOM 13600 OG1 THR A 857 43.637 118.806 111.634 1.00 0.00 O
ATOM 13601 H THR A 857 41.580 120.138 108.504 1.00 0.00 H
ATOM 13602 HA THR A 857 42.285 120.816 111.275 1.00 0.00 H
ATOM 13603 HB THR A 857 41.990 118.608 110.521 1.00 0.00 H
ATOM 13604 HG1 THR A 857 43.346 117.929 111.892 1.00 0.00 H
ATOM 13605 HG21 THR A 857 44.042 117.445 109.337 1.00 0.00 H
ATOM 13606 HG22 THR A 857 43.210 118.692 108.339 1.00 0.00 H
ATOM 13607 HG23 THR A 857 44.737 118.906 109.088 1.00 0.00 H
ATOM 13608 N ILE A 858 44.643 121.521 111.064 1.00 0.00 N
ATOM 13609 CA ILE A 858 45.985 122.157 110.909 1.00 0.00 C
ATOM 13610 C ILE A 858 47.016 121.294 110.221 1.00 0.00 C
ATOM 13611 O ILE A 858 47.945 121.811 109.654 1.00 0.00 O
ATOM 13612 CB ILE A 858 46.404 122.863 112.310 1.00 0.00 C
ATOM 13613 CG1 ILE A 858 47.541 123.893 112.078 1.00 0.00 C
ATOM 13614 CG2 ILE A 858 46.859 121.765 113.265 1.00 0.00 C
ATOM 13615 CD1 ILE A 858 47.638 124.997 113.210 1.00 0.00 C
ATOM 13616 H ILE A 858 44.282 121.155 111.933 1.00 0.00 H
ATOM 13617 HA ILE A 858 45.895 122.914 110.130 1.00 0.00 H
ATOM 13618 HB ILE A 858 45.585 123.509 112.626 1.00 0.00 H
ATOM 13619 HG12 ILE A 858 48.400 123.270 111.825 1.00 0.00 H
ATOM 13620 HG13 ILE A 858 47.152 124.384 111.187 1.00 0.00 H
ATOM 13621 HG21 ILE A 858 47.209 122.225 114.190 1.00 0.00 H
ATOM 13622 HG22 ILE A 858 45.950 121.198 113.462 1.00 0.00 H
ATOM 13623 HG23 ILE A 858 47.621 121.135 112.806 1.00 0.00 H
ATOM 13624 HD11 ILE A 858 48.159 125.842 112.759 1.00 0.00 H
ATOM 13625 HD12 ILE A 858 46.617 125.301 113.443 1.00 0.00 H
ATOM 13626 HD13 ILE A 858 48.145 124.726 114.136 1.00 0.00 H
ATOM 13627 N CYS A 859 46.883 119.962 110.319 1.00 0.00 N
ATOM 13628 CA CYS A 859 47.841 118.957 109.843 1.00 0.00 C
ATOM 13629 C CYS A 859 47.999 118.792 108.364 1.00 0.00 C
ATOM 13630 O CYS A 859 47.015 119.024 107.652 1.00 0.00 O
ATOM 13631 CB CYS A 859 47.339 117.650 110.450 1.00 0.00 C
ATOM 13632 SG CYS A 859 47.199 117.814 112.287 1.00 0.00 S
ATOM 13633 H CYS A 859 46.017 119.565 110.653 1.00 0.00 H
ATOM 13634 HA CYS A 859 48.811 119.271 110.228 1.00 0.00 H
ATOM 13635 HB2 CYS A 859 46.394 117.369 109.987 1.00 0.00 H
ATOM 13636 HB3 CYS A 859 48.113 116.901 110.282 1.00 0.00 H
ATOM 13637 HG CYS A 859 46.563 116.647 112.420 1.00 0.00 H
ATOM 13638 N LYS A 860 49.194 118.321 107.894 1.00 0.00 N
ATOM 13639 CA LYS A 860 49.598 118.034 106.467 1.00 0.00 C
ATOM 13640 C LYS A 860 48.732 116.986 105.738 1.00 0.00 C
ATOM 13641 O LYS A 860 48.468 115.836 106.226 1.00 0.00 O
ATOM 13642 CB LYS A 860 51.131 117.719 106.559 1.00 0.00 C
ATOM 13643 CG LYS A 860 51.791 117.593 105.167 1.00 0.00 C
ATOM 13644 CD LYS A 860 53.251 117.073 105.207 1.00 0.00 C
ATOM 13645 CE LYS A 860 54.300 118.205 105.477 1.00 0.00 C
ATOM 13646 NZ LYS A 860 54.469 119.024 104.234 1.00 0.00 N1+
ATOM 13647 H LYS A 860 49.962 118.251 108.547 1.00 0.00 H
ATOM 13648 HA LYS A 860 49.550 118.992 105.949 1.00 0.00 H
ATOM 13649 HB2 LYS A 860 51.699 118.544 106.988 1.00 0.00 H
ATOM 13650 HB3 LYS A 860 51.185 116.861 107.230 1.00 0.00 H
ATOM 13651 HG2 LYS A 860 51.233 116.868 104.575 1.00 0.00 H
ATOM 13652 HG3 LYS A 860 51.751 118.488 104.546 1.00 0.00 H
ATOM 13653 HD2 LYS A 860 53.308 116.374 106.041 1.00 0.00 H
ATOM 13654 HD3 LYS A 860 53.440 116.511 104.292 1.00 0.00 H
ATOM 13655 HE2 LYS A 860 54.148 118.723 106.424 1.00 0.00 H
ATOM 13656 HE3 LYS A 860 55.245 117.706 105.694 1.00 0.00 H
ATOM 13657 HZ1 LYS A 860 54.628 118.507 103.381 1.00 0.00 H
ATOM 13658 HZ2 LYS A 860 53.641 119.586 104.101 1.00 0.00 H
ATOM 13659 HZ3 LYS A 860 55.265 119.640 104.311 1.00 0.00 H
ATOM 13660 N LEU A 861 48.463 117.363 104.477 1.00 0.00 N
ATOM 13661 CA LEU A 861 47.785 116.523 103.516 1.00 0.00 C
ATOM 13662 C LEU A 861 48.497 116.413 102.176 1.00 0.00 C
ATOM 13663 O LEU A 861 48.098 115.662 101.359 1.00 0.00 O
ATOM 13664 CB LEU A 861 46.345 117.015 103.366 1.00 0.00 C
ATOM 13665 CG LEU A 861 45.388 117.155 104.636 1.00 0.00 C
ATOM 13666 CD1 LEU A 861 44.074 117.760 104.404 1.00 0.00 C
ATOM 13667 CD2 LEU A 861 45.135 115.682 105.133 1.00 0.00 C
ATOM 13668 H LEU A 861 48.616 118.325 104.208 1.00 0.00 H
ATOM 13669 HA LEU A 861 47.687 115.482 103.825 1.00 0.00 H
ATOM 13670 HB2 LEU A 861 46.515 118.037 103.027 1.00 0.00 H
ATOM 13671 HB3 LEU A 861 45.811 116.424 102.622 1.00 0.00 H
ATOM 13672 HG LEU A 861 45.941 117.795 105.323 1.00 0.00 H
ATOM 13673 HD11 LEU A 861 43.665 117.223 103.549 1.00 0.00 H
ATOM 13674 HD12 LEU A 861 43.370 117.582 105.216 1.00 0.00 H
ATOM 13675 HD13 LEU A 861 44.192 118.809 104.129 1.00 0.00 H
ATOM 13676 HD21 LEU A 861 46.037 115.114 105.360 1.00 0.00 H
ATOM 13677 HD22 LEU A 861 44.577 115.748 106.067 1.00 0.00 H
ATOM 13678 HD23 LEU A 861 44.610 115.160 104.333 1.00 0.00 H
ATOM 13679 N LEU A 862 49.512 117.217 101.897 1.00 0.00 N
ATOM 13680 CA LEU A 862 50.194 117.358 100.578 1.00 0.00 C
ATOM 13681 C LEU A 862 51.686 117.355 100.779 1.00 0.00 C
ATOM 13682 O LEU A 862 52.155 117.795 101.879 1.00 0.00 O
ATOM 13683 CB LEU A 862 49.639 118.601 99.849 1.00 0.00 C
ATOM 13684 CG LEU A 862 48.182 118.628 99.384 1.00 0.00 C
ATOM 13685 CD1 LEU A 862 47.716 120.105 99.267 1.00 0.00 C
ATOM 13686 CD2 LEU A 862 47.938 117.948 98.018 1.00 0.00 C
ATOM 13687 H LEU A 862 49.821 117.909 102.564 1.00 0.00 H
ATOM 13688 HA LEU A 862 49.912 116.446 100.052 1.00 0.00 H
ATOM 13689 HB2 LEU A 862 49.960 119.523 100.335 1.00 0.00 H
ATOM 13690 HB3 LEU A 862 50.268 118.684 98.963 1.00 0.00 H
ATOM 13691 HG LEU A 862 47.574 118.124 100.136 1.00 0.00 H
ATOM 13692 HD11 LEU A 862 48.480 120.693 98.758 1.00 0.00 H
ATOM 13693 HD12 LEU A 862 46.756 120.164 98.755 1.00 0.00 H
ATOM 13694 HD13 LEU A 862 47.577 120.456 100.290 1.00 0.00 H
ATOM 13695 HD21 LEU A 862 48.225 116.906 98.157 1.00 0.00 H
ATOM 13696 HD22 LEU A 862 46.919 118.076 97.654 1.00 0.00 H
ATOM 13697 HD23 LEU A 862 48.461 118.449 97.203 1.00 0.00 H
ATOM 13698 N THR A 863 52.427 116.978 99.732 1.00 0.00 N
ATOM 13699 CA THR A 863 53.921 117.047 99.793 1.00 0.00 C
ATOM 13700 C THR A 863 54.488 118.450 99.477 1.00 0.00 C
ATOM 13701 O THR A 863 53.988 119.206 98.613 1.00 0.00 O
ATOM 13702 CB THR A 863 54.523 116.000 98.985 1.00 0.00 C
ATOM 13703 CG2 THR A 863 54.472 116.102 97.479 1.00 0.00 C
ATOM 13704 OG1 THR A 863 55.918 115.926 99.233 1.00 0.00 O
ATOM 13705 H THR A 863 51.973 116.847 98.839 1.00 0.00 H
ATOM 13706 HA THR A 863 54.189 116.860 100.833 1.00 0.00 H
ATOM 13707 HB THR A 863 54.087 115.046 99.282 1.00 0.00 H
ATOM 13708 HG1 THR A 863 56.102 114.984 99.214 1.00 0.00 H
ATOM 13709 HG21 THR A 863 54.977 115.203 97.125 1.00 0.00 H
ATOM 13710 HG22 THR A 863 53.445 116.017 97.123 1.00 0.00 H
ATOM 13711 HG23 THR A 863 55.071 116.966 97.194 1.00 0.00 H
ATOM 13712 N ASP A 864 55.556 118.801 100.181 1.00 0.00 N
ATOM 13713 CA ASP A 864 56.317 120.078 99.757 1.00 0.00 C
ATOM 13714 C ASP A 864 57.788 119.863 99.892 1.00 0.00 C
ATOM 13715 O ASP A 864 58.177 118.844 100.558 1.00 0.00 O
ATOM 13716 CB ASP A 864 55.736 121.316 100.559 1.00 0.00 C
ATOM 13717 CG ASP A 864 56.069 122.698 100.057 1.00 0.00 C
ATOM 13718 OD1 ASP A 864 56.663 122.885 98.986 1.00 0.00 O
ATOM 13719 OD2 ASP A 864 55.858 123.743 100.716 1.00 0.00 O1-
ATOM 13720 H ASP A 864 56.050 118.145 100.770 1.00 0.00 H
ATOM 13721 HA ASP A 864 56.164 120.320 98.706 1.00 0.00 H
ATOM 13722 HB2 ASP A 864 54.647 121.270 100.566 1.00 0.00 H
ATOM 13723 HB3 ASP A 864 56.182 121.269 101.552 1.00 0.00 H
ATOM 13724 N LEU A 865 58.666 120.720 99.290 1.00 0.00 N
ATOM 13725 CA LEU A 865 60.079 120.332 99.213 1.00 0.00 C
ATOM 13726 C LEU A 865 60.774 120.225 100.539 1.00 0.00 C
ATOM 13727 O LEU A 865 61.897 119.727 100.680 1.00 0.00 O
ATOM 13728 CB LEU A 865 60.852 121.322 98.355 1.00 0.00 C
ATOM 13729 CG LEU A 865 60.592 121.362 96.812 1.00 0.00 C
ATOM 13730 CD1 LEU A 865 61.117 122.681 96.130 1.00 0.00 C
ATOM 13731 CD2 LEU A 865 61.124 120.148 96.133 1.00 0.00 C
ATOM 13732 H LEU A 865 58.241 121.359 98.633 1.00 0.00 H
ATOM 13733 HA LEU A 865 60.029 119.334 98.776 1.00 0.00 H
ATOM 13734 HB2 LEU A 865 60.603 122.310 98.741 1.00 0.00 H
ATOM 13735 HB3 LEU A 865 61.932 121.190 98.416 1.00 0.00 H
ATOM 13736 HG LEU A 865 59.510 121.356 96.679 1.00 0.00 H
ATOM 13737 HD11 LEU A 865 62.190 122.506 96.047 1.00 0.00 H
ATOM 13738 HD12 LEU A 865 60.679 122.844 95.145 1.00 0.00 H
ATOM 13739 HD13 LEU A 865 60.923 123.561 96.744 1.00 0.00 H
ATOM 13740 HD21 LEU A 865 62.173 119.954 96.353 1.00 0.00 H
ATOM 13741 HD22 LEU A 865 60.528 119.294 96.456 1.00 0.00 H
ATOM 13742 HD23 LEU A 865 61.072 120.268 95.051 1.00 0.00 H
ATOM 13743 N ASP A 866 60.212 120.788 101.643 1.00 0.00 N
ATOM 13744 CA ASP A 866 60.811 120.697 103.026 1.00 0.00 C
ATOM 13745 C ASP A 866 60.049 119.686 103.932 1.00 0.00 C
ATOM 13746 O ASP A 866 60.313 119.662 105.092 1.00 0.00 O
ATOM 13747 CB ASP A 866 60.899 122.139 103.670 1.00 0.00 C
ATOM 13748 CG ASP A 866 59.646 122.986 103.373 1.00 0.00 C
ATOM 13749 OD1 ASP A 866 58.530 122.389 103.206 1.00 0.00 O
ATOM 13750 OD2 ASP A 866 59.712 124.252 103.262 1.00 0.00 O1-
ATOM 13751 H ASP A 866 59.345 121.306 101.606 1.00 0.00 H
ATOM 13752 HA ASP A 866 61.851 120.374 102.982 1.00 0.00 H
ATOM 13753 HB2 ASP A 866 60.945 122.006 104.751 1.00 0.00 H
ATOM 13754 HB3 ASP A 866 61.728 122.767 103.344 1.00 0.00 H
ATOM 13755 N GLY A 867 59.093 119.001 103.383 1.00 0.00 N
ATOM 13756 CA GLY A 867 58.277 118.088 104.129 1.00 0.00 C
ATOM 13757 C GLY A 867 57.500 117.084 103.244 1.00 0.00 C
ATOM 13758 O GLY A 867 56.397 117.334 102.712 1.00 0.00 O
ATOM 13759 H GLY A 867 58.957 119.069 102.384 1.00 0.00 H
ATOM 13760 HA2 GLY A 867 58.858 117.385 104.726 1.00 0.00 H
ATOM 13761 HA3 GLY A 867 57.596 118.714 104.705 1.00 0.00 H
ATOM 13762 N GLU A 868 58.091 115.977 103.028 1.00 0.00 N
ATOM 13763 CA GLU A 868 57.464 114.931 102.183 1.00 0.00 C
ATOM 13764 C GLU A 868 56.184 114.420 102.852 1.00 0.00 C
ATOM 13765 O GLU A 868 56.110 114.340 104.076 1.00 0.00 O
ATOM 13766 CB GLU A 868 58.572 113.730 102.130 1.00 0.00 C
ATOM 13767 CG GLU A 868 58.327 112.567 101.126 1.00 0.00 C
ATOM 13768 CD GLU A 868 58.001 113.058 99.707 1.00 0.00 C
ATOM 13769 OE1 GLU A 868 56.909 113.543 99.336 1.00 0.00 O
ATOM 13770 OE2 GLU A 868 58.833 113.003 98.785 1.00 0.00 O1-
ATOM 13771 H GLU A 868 58.929 115.744 103.542 1.00 0.00 H
ATOM 13772 HA GLU A 868 57.222 115.395 101.227 1.00 0.00 H
ATOM 13773 HB2 GLU A 868 59.507 114.185 101.804 1.00 0.00 H
ATOM 13774 HB3 GLU A 868 58.819 113.259 103.082 1.00 0.00 H
ATOM 13775 HG2 GLU A 868 59.218 111.939 101.132 1.00 0.00 H
ATOM 13776 HG3 GLU A 868 57.445 111.989 101.403 1.00 0.00 H
ATOM 13777 N PHE A 869 55.232 114.080 101.964 1.00 0.00 N
ATOM 13778 CA PHE A 869 53.938 113.365 102.228 1.00 0.00 C
ATOM 13779 C PHE A 869 53.764 112.152 101.424 1.00 0.00 C
ATOM 13780 O PHE A 869 54.093 112.103 100.228 1.00 0.00 O
ATOM 13781 CB PHE A 869 52.731 114.307 101.959 1.00 0.00 C
ATOM 13782 CG PHE A 869 51.457 113.840 102.658 1.00 0.00 C
ATOM 13783 CD1 PHE A 869 51.277 114.041 104.019 1.00 0.00 C
ATOM 13784 CD2 PHE A 869 50.422 113.212 101.944 1.00 0.00 C
ATOM 13785 CE1 PHE A 869 50.067 113.671 104.678 1.00 0.00 C
ATOM 13786 CE2 PHE A 869 49.273 112.697 102.572 1.00 0.00 C
ATOM 13787 CZ PHE A 869 49.171 112.859 103.954 1.00 0.00 C
ATOM 13788 H PHE A 869 55.488 114.254 101.003 1.00 0.00 H
ATOM 13789 HA PHE A 869 53.878 113.112 103.287 1.00 0.00 H
ATOM 13790 HB2 PHE A 869 53.000 115.312 102.285 1.00 0.00 H
ATOM 13791 HB3 PHE A 869 52.601 114.389 100.880 1.00 0.00 H
ATOM 13792 HD1 PHE A 869 52.078 114.532 104.551 1.00 0.00 H
ATOM 13793 HD2 PHE A 869 50.598 112.996 100.900 1.00 0.00 H
ATOM 13794 HE1 PHE A 869 49.996 113.902 105.731 1.00 0.00 H
ATOM 13795 HE2 PHE A 869 48.685 111.986 102.010 1.00 0.00 H
ATOM 13796 HZ PHE A 869 48.435 112.201 104.391 1.00 0.00 H
ATOM 13797 N VAL A 870 53.421 111.016 102.050 1.00 0.00 N
ATOM 13798 CA VAL A 870 53.594 109.631 101.510 1.00 0.00 C
ATOM 13799 C VAL A 870 52.331 108.704 101.697 1.00 0.00 C
ATOM 13800 O VAL A 870 51.565 108.847 102.600 1.00 0.00 O
ATOM 13801 CB VAL A 870 54.879 108.919 101.879 1.00 0.00 C
ATOM 13802 CG1 VAL A 870 56.147 109.633 101.515 1.00 0.00 C
ATOM 13803 CG2 VAL A 870 54.986 108.506 103.329 1.00 0.00 C
ATOM 13804 H VAL A 870 53.065 111.171 102.982 1.00 0.00 H
ATOM 13805 HA VAL A 870 53.646 109.782 100.431 1.00 0.00 H
ATOM 13806 HB VAL A 870 55.037 108.081 101.199 1.00 0.00 H
ATOM 13807 HG11 VAL A 870 56.938 108.883 101.511 1.00 0.00 H
ATOM 13808 HG12 VAL A 870 55.981 110.048 100.521 1.00 0.00 H
ATOM 13809 HG13 VAL A 870 56.345 110.451 102.208 1.00 0.00 H
ATOM 13810 HG21 VAL A 870 55.114 109.378 103.971 1.00 0.00 H
ATOM 13811 HG22 VAL A 870 54.127 107.934 103.681 1.00 0.00 H
ATOM 13812 HG23 VAL A 870 55.838 107.840 103.463 1.00 0.00 H
ATOM 13813 N TYR A 871 52.160 107.777 100.799 1.00 0.00 N
ATOM 13814 CA TYR A 871 50.994 106.803 100.704 1.00 0.00 C
ATOM 13815 C TYR A 871 51.517 105.338 100.475 1.00 0.00 C
ATOM 13816 O TYR A 871 52.609 105.093 99.965 1.00 0.00 O
ATOM 13817 CB TYR A 871 50.092 107.300 99.584 1.00 0.00 C
ATOM 13818 CG TYR A 871 50.402 106.801 98.210 1.00 0.00 C
ATOM 13819 CD1 TYR A 871 49.793 105.677 97.687 1.00 0.00 C
ATOM 13820 CD2 TYR A 871 51.295 107.489 97.341 1.00 0.00 C
ATOM 13821 CE1 TYR A 871 50.142 105.081 96.468 1.00 0.00 C
ATOM 13822 CE2 TYR A 871 51.677 106.921 96.109 1.00 0.00 C
ATOM 13823 CZ TYR A 871 51.129 105.703 95.699 1.00 0.00 C
ATOM 13824 OH TYR A 871 51.514 105.127 94.590 1.00 0.00 O
ATOM 13825 H TYR A 871 52.919 107.683 100.139 1.00 0.00 H
ATOM 13826 HA TYR A 871 50.380 106.849 101.604 1.00 0.00 H
ATOM 13827 HB2 TYR A 871 49.070 107.144 99.930 1.00 0.00 H
ATOM 13828 HB3 TYR A 871 50.195 108.385 99.564 1.00 0.00 H
ATOM 13829 HD1 TYR A 871 48.973 105.253 98.247 1.00 0.00 H
ATOM 13830 HD2 TYR A 871 51.834 108.351 97.704 1.00 0.00 H
ATOM 13831 HE1 TYR A 871 49.636 104.188 96.130 1.00 0.00 H
ATOM 13832 HE2 TYR A 871 52.407 107.482 95.545 1.00 0.00 H
ATOM 13833 HH TYR A 871 51.200 104.236 94.423 1.00 0.00 H
ATOM 13834 N THR A 872 50.725 104.327 100.922 1.00 0.00 N
ATOM 13835 CA THR A 872 51.065 102.924 100.674 1.00 0.00 C
ATOM 13836 C THR A 872 50.707 102.469 99.254 1.00 0.00 C
ATOM 13837 O THR A 872 49.662 102.795 98.718 1.00 0.00 O
ATOM 13838 CB THR A 872 50.347 102.106 101.759 1.00 0.00 C
ATOM 13839 CG2 THR A 872 50.714 100.636 101.781 1.00 0.00 C
ATOM 13840 OG1 THR A 872 50.670 102.697 103.001 1.00 0.00 O
ATOM 13841 H THR A 872 49.787 104.615 101.160 1.00 0.00 H
ATOM 13842 HA THR A 872 52.134 102.765 100.820 1.00 0.00 H
ATOM 13843 HB THR A 872 49.280 102.076 101.539 1.00 0.00 H
ATOM 13844 HG1 THR A 872 50.120 103.481 103.070 1.00 0.00 H
ATOM 13845 HG21 THR A 872 50.238 99.949 101.082 1.00 0.00 H
ATOM 13846 HG22 THR A 872 51.789 100.577 101.614 1.00 0.00 H
ATOM 13847 HG23 THR A 872 50.441 100.177 102.731 1.00 0.00 H
ATOM 13848 N GLN A 873 51.547 101.641 98.685 1.00 0.00 N
ATOM 13849 CA GLN A 873 51.267 100.904 97.461 1.00 0.00 C
ATOM 13850 C GLN A 873 50.388 99.726 97.506 1.00 0.00 C
ATOM 13851 O GLN A 873 49.251 99.812 97.081 1.00 0.00 O
ATOM 13852 CB GLN A 873 52.648 100.538 96.945 1.00 0.00 C
ATOM 13853 CG GLN A 873 53.354 101.809 96.583 1.00 0.00 C
ATOM 13854 CD GLN A 873 54.090 101.714 95.250 1.00 0.00 C
ATOM 13855 NE2 GLN A 873 53.532 102.205 94.225 1.00 0.00 N
ATOM 13856 OE1 GLN A 873 55.242 101.274 95.196 1.00 0.00 O
ATOM 13857 OXT GLN A 873 50.865 98.654 97.882 1.00 0.00 O1-
ATOM 13858 H GLN A 873 52.311 101.310 99.256 1.00 0.00 H
ATOM 13859 HA GLN A 873 50.796 101.465 96.654 1.00 0.00 H
ATOM 13860 HB2 GLN A 873 53.236 99.879 97.583 1.00 0.00 H
ATOM 13861 HB3 GLN A 873 52.523 99.965 96.026 1.00 0.00 H
ATOM 13862 HG2 GLN A 873 52.669 102.648 96.458 1.00 0.00 H
ATOM 13863 HG3 GLN A 873 54.035 102.156 97.360 1.00 0.00 H
ATOM 13864 HE21 GLN A 873 54.144 102.506 93.481 1.00 0.00 H
ATOM 13865 HE22 GLN A 873 52.530 102.132 94.120 1.00 0.00 H
TER
ATOM 13866 C1 OGK B 874 77.181 66.158 80.380 1.00 0.00 C
ATOM 13867 N1 OGK B 874 77.949 63.313 75.964 1.00 0.00 N
ATOM 13868 O1 OGK B 874 76.766 63.812 82.289 1.00 0.00 O
ATOM 13869 C2 OGK B 874 76.769 64.669 80.119 1.00 0.00 C
ATOM 13870 O2 OGK B 874 79.320 65.041 76.007 1.00 0.00 O
ATOM 13871 C3 OGK B 874 77.040 67.030 79.130 1.00 0.00 C
ATOM 13872 O3 OGK B 874 78.031 63.899 72.893 1.00 0.00 O
ATOM 13873 C4 OGK B 874 77.252 63.838 81.247 1.00 0.00 C
ATOM 13874 O4 OGK B 874 80.118 63.756 73.496 1.00 0.00 O
ATOM 13875 C5 OGK B 874 77.431 64.026 78.885 1.00 0.00 C
ATOM 13876 C6 OGK B 874 78.589 63.109 80.829 1.00 0.00 C
ATOM 13877 C7 OGK B 874 78.825 63.417 79.325 1.00 0.00 C
ATOM 13878 C8 OGK B 874 77.566 65.017 77.640 1.00 0.00 C
ATOM 13879 C9 OGK B 874 78.369 64.514 76.499 1.00 0.00 C
ATOM 13880 C10 OGK B 874 77.941 66.477 78.017 1.00 0.00 C
ATOM 13881 C11 OGK B 874 77.278 68.553 79.385 1.00 0.00 C
ATOM 13882 C12 OGK B 874 78.777 68.917 79.536 1.00 0.00 C
ATOM 13883 C13 OGK B 874 78.650 62.677 74.894 1.00 0.00 C
ATOM 13884 C14 OGK B 874 78.260 61.225 74.650 1.00 0.00 C
ATOM 13885 C15 OGK B 874 79.556 61.572 75.353 1.00 0.00 C
ATOM 13886 C16 OGK B 874 79.014 63.491 73.705 1.00 0.00 C
ATOM 13887 C17 OGK B 874 78.291 60.352 73.427 1.00 0.00 C
ATOM 13888 C18 OGK B 874 78.495 58.888 73.778 1.00 0.00 C
ATOM 13889 H1 OGK B 874 76.730 66.561 81.295 1.00 0.00 H
ATOM 13890 H2 OGK B 874 78.252 66.084 80.601 1.00 0.00 H
ATOM 13891 H3 OGK B 874 75.679 64.568 80.045 1.00 0.00 H
ATOM 13892 H4 OGK B 874 78.448 62.025 80.924 1.00 0.00 H
ATOM 13893 H5 OGK B 874 79.398 63.418 81.502 1.00 0.00 H
ATOM 13894 H6 OGK B 874 79.704 64.066 79.232 1.00 0.00 H
ATOM 13895 H7 OGK B 874 78.969 62.514 78.720 1.00 0.00 H
ATOM 13896 H8 OGK B 874 76.863 63.109 78.685 1.00 0.00 H
ATOM 13897 H9 OGK B 874 76.530 65.051 77.280 1.00 0.00 H
ATOM 13898 H10 OGK B 874 78.962 66.536 78.413 1.00 0.00 H
ATOM 13899 H11 OGK B 874 77.882 67.072 77.097 1.00 0.00 H
ATOM 13900 H12 OGK B 874 76.007 66.936 78.772 1.00 0.00 H
ATOM 13901 H13 OGK B 874 76.757 68.769 80.325 1.00 0.00 H
ATOM 13902 H14 OGK B 874 76.886 69.134 78.541 1.00 0.00 H
ATOM 13903 H15 OGK B 874 79.312 68.694 78.605 1.00 0.00 H
ATOM 13904 H16 OGK B 874 79.320 68.409 80.342 1.00 0.00 H
ATOM 13905 H17 OGK B 874 78.828 69.996 79.726 1.00 0.00 H
ATOM 13906 H18 OGK B 874 77.007 63.041 76.220 1.00 0.00 H
ATOM 13907 H19 OGK B 874 77.416 60.908 75.256 1.00 0.00 H
ATOM 13908 H20 OGK B 874 77.364 60.562 72.880 1.00 0.00 H
ATOM 13909 H21 OGK B 874 79.068 60.837 72.823 1.00 0.00 H
ATOM 13910 H22 OGK B 874 79.159 58.704 74.631 1.00 0.00 H
ATOM 13911 H23 OGK B 874 78.831 58.362 72.876 1.00 0.00 H
ATOM 13912 H24 OGK B 874 77.519 58.456 74.031 1.00 0.00 H
ATOM 13913 H25 OGK B 874 79.650 61.434 76.427 1.00 0.00 H
ATOM 13914 H26 OGK B 874 80.380 61.429 74.659 1.00 0.00 H
ATOM 13915 H27 OGK B 874 77.310 63.337 73.225 1.00 0.00 H
END