What is this model: a life cycle assessment from cradle to gate comparing a theoretical industrial production system of recombinant antivenoms, with exiting animal based antivenoms
What does it do: it quantifies the entire environmental footprint of both processes on emissions and water usage
What does it tell us: it allows us to quantify which production system has a higher environmental impact and why. Allowing us to not only compare both of them, but make recommendations based on sustainable design on how to improve existing processes
As part of a drive towards sustainability, we wanted to test the potential environmental impact of the antivenom industry in the context of Mexico. The goal to see if microbial production systems could have a smaller carbon footprint than those based on immunized horses. Livestock is known to have a relatively high carbon footprint (‘FAO on the Common but Flawed Comparisons of Greenhouse Gas Emissions from Livestock and Transport’, n.d.). Microbial production systems have been studied as an alternative to livestock in multiple fields, usually an alternative to animal protein for human consumption. In these cases, depending on the specific source of energy used, microbial systems have shown an improvement in the environmental footprint over animals, although questions about scalability remain (Niu et al., 2025; Parsons et al., 2018; Sillman et al., 2020).
To evaluate theoretical production of antivenoms in microorganisms, against existing animal-based methods we decided to make a life cycle assessment (LCA) of the water and carbon footprint of both production systems in a cradle to gate analysis. We focused on 3 measurements, the total impact of unitary production (the production of the first dose of antivenom) the impact of the total production of doses produced in Mexico each year, and the marginal impact (the impact derived from producing a single additional dose).
To our knowledge there is no single publicly available LCA of antivenom production of any part of the world, so we had to build one. There are existing tools and databases to perform LCAs, even open access ones like OpenLCA. However, available open databases that include Mexican data are limited, so we had to build much of the formulation ourselves. When available worked based on existing Mexican LCA for much of the calculation (Amezcua-Allieri et al., 2019; Escamilla-Alvarado et al., 2017; Fuentes et al., 2018). We also asked our stakeholders to help us fill some of the information gaps with their industry knowledge, since they have not carried out an LCA themselves we still needed to fill some gaps.
Methodology
We had access to industry experts to ensure that our model reflects one the main producers of antivenom in Mexico, some specifics of the process are industry secrets and we are limited in the internal information of these processes we can show, because of this we are choosing to build the comparative LCAs as grey-box models. Since all mayor manufacturers of antivenoms in Mexico must follow local and international regulations, we were advised to base the general production process and calculation on the WHO Guidelines for the production, control and regulation of snake antivenom immunoglobulins. Figure 1 shows this process. Manufacturing antivenom takes place in 3 distinct installations:
- Scorpion farms from where the venom of multiple species of scorpion (between 4 and 6 species all belonging to the Centruroides genus) is extracted.
- Horse ranches. Where horses are maintained and taken care of. These facilities usually are dedicated to horses for antivenom production, so the impact (in water, waste, electricity, and emissions) of all animals can be used to calculate the total environmental impact.
- Extraction and formulation. Horses will have an increasing amount of venom injected into them. After a few months their blood will be extracted, antibodies separated from the plasma. Plasma will be returned to the animal, while the antibodies are used for antivenoms production.

Figure 1. WHO guideline for snake antivenom immunoglobulins.
For microbial antivenom production, no current process currently is commercially available. Calculating the impact of existing laboratory scale processes would fail to capture the scale necessary to satisfy the demand for medicine to treat the more than 300 thousand stings in Mexico. Microbial recombinant protein has multiple studies available when it comes to LCAs (Chatzipanagiotou et al., 2025; Järviö et al., 2021; Niu et al., 2025; Trinidad et al., 2023). We combined existing information with the Mexican context and knowledge of existing recombinant production systems in Mexico to formulate the microbial LCA. We are basing our design of existing production systems of antibodies or equivalent like scFvs. Our calculations are made for Yeast (P. pastoris) and E. coli systems. While CHO cells and other mammalian cell lines are also commonly utilized for recombinant antibody production, yeast and bacteria better reflect existing production systems for antivenoms at laboratory scale in Mexico (Alonso Villela et al., 2023; Riaño-Umbarila et al., 2021, 2025). The general process appears in Figure 2.

Figure 2. General manufacturing process of antivenoms.
Parameters
Our goal was to explore the potential environmental impact of changing the production process of antivenoms from horses to microorganisms. We want to avoid potentially tilting the scale to make it seem as if microbial production is inherently more sustainable than animal one. For these reasons we are discussing some of the parameters and assumptions we have taken. First, as much as possible we are limiting the impact to the processes directly involved in antivenom production for both sides. Some horse ranches involved in antivenom production have other animals whose emissions will not be part of the analysis. For the impact of energy use we are using the climate transparency report which positions Mexico at 439 gCO2 per KWh (Climate Transparency, 2025), take into account that depending on the state the process takes place emissions could be reduced. The southern part of Mexico takes most of its electricity from hydroelectric plants for example, but we are using the generalized estimate since most pharmaceutical manufacturers are in the center or north of the country, better represented by the climate transparency figure. For both processes, transport related emissions where unclear, we were given estimates of the type of vehicle used for some movement related tasks, but for others, specifically those that are carried by third parties we could not calculate an approximate value. Because of this we are not including transport-related emissions. Be aware that supply chain-related emissions, depending on the country, can account for around 70% of the total emissions of any given pharmaceutical product (Ashworth et al., 2025). Not including them does reduce the accuracy of the LCAs considerably, but partial inclusion could also compromise the objective of comparing the 2 processes.
Calculations
At its core LCAs are economic analysis based on a system of inputs and outputs. It can be modeled as an equation:
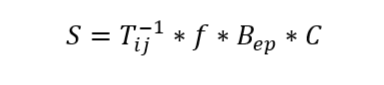
Where T is the technological matrix, where each column (i) is the input needed per output process (j). x is the scaling vector, the amount of each process to meet demand, and f is the demand vector for the functional unit of the system. B is an environmental matrix of dimensions emissions (e) x process (p) and C is a characterization matrix that converts each process into an equivalent of environmental impact. S are the numbers we are reporting, alongside selected inputs, as it represents the total impact across our 3 categories: energy usage, water usage and direct CO2 equivalent emissions (Dicks & Hent, 2015; Finkbeiner, 2016; Guinée & Heijungs, 2017; Neugebauer et al., 2016). We built matrixes for 3 different 3 step processes: for animal-derived antivenom we built a set for the scorpion farm, the horse ranch, and the formulation facility. The last one also included the portion of the process to extract the plasma of the immunized animal and separate it from the antivenom. For microbial production we built 2 sets, one for bacteria, the other for yeast. In each set we included a step to build the organism, one for bioreactor bioproduction and another for purification and formulation.
Results
Venom production
Traditional antivenoms use between 4 and 6 species of scorpions, from which doses of venom are extracted to be injected into horses in increasing doses over a period of six months (How Mexico Revolutionized the Science of Antivenom, 2025; Riaño-Umbarila et al., 2025). Although the species are different, they are all available in similar facilities, where the venom can be purchased directly. Milking scorpions yield inconsistent amounts of venom. Around 5 grams of total venom is required over a period of six months to immunize a single horse.We estimated that the average daily venom production per scorpion is 2 mg. It is possible to milk scorpions repeatedly, but since it generates stress on the animal, they require rest, there is a recording system to keep track of how many times the same scorpion has been used to produce the same dose of venom. We had confirmation that scorpion milking required “hundreds if not thousands” of scorpions to generate the venom for a single immunization but lacked specific numbers. Under suggestion of an advisor, we fixed the number to around 500 scorpions, not distinguishing by species. Additionally, they also suggested fixing the number of scorpions from an individual farm to 40000 animals of multiple species. They also provided numbers for the energy and water consumption of one of these facilities. We must note that those numbers (both of animals and utilities) may be outdated. To calculate the CO2 equivalent emissions of both milked and basal scorpions, we used existing studies from other scorpion species (Van Aardt et al., 2016). The equivalent emissions of the electric instrument used to extract venom, and other instruments are considered to be part of the total electricity consumption. We were not provided with a feedstock estimate. Table 1 contains the general footprint of the production of venom.
Table 1. General footprint estimated for venom production.
| Scorpion Farm | |
|---|---|
| Number of used scorpions | Total number of scorpions |
| 500 | 40000 |
| Metabolic rate of scorpions | µLO2/gh |
| Milked | Unmilked |
| 50.29 | 36.12 |
| Utilities of production process per month | |
| Water (Liters) | Electricity (kwh) |
| 300 | 800 |
| CO2 equivalent (Kg) | |
| Only for immediate production | For entire maintenance of scorpions |
| 2.8378647 | 1286.446574 |
Horse maintenance
The biggest difference between microbial and traditional antivenoms is the use of animals themselves. As arthropods, scorpion environmental footprints are relatively small, the same cannot be said for horses. We based our count on one of the main 3 producers of antivenom in Mexico. We had limited information on the specifics of each individual animal, so information is completed by the requirements of Mexican and international regulation, as well as existing studies on the environmental impact of horses (Hadin et al., 2016; Havukainen et al., 2020). The limitations here is that the main manufacturers of antivenoms produce different medicines, for most stings, multiple doses will need to be applied for the patient to have a good recovery (Alonso Villela et al., 2023; Riaño-Umbarila et al., 2025). Because of this and lacking access to all the mayor manufacturers installations, we decided to set sights on the yearly 350 thousand doses of the highest profile manufacturer (How Mexico Revolutionized the Science of Antivenom, 2025). Here each horse produces more than 2000 vials of antivenom a year, with more than a 100 horses in the facility. For purposes of unitary calculations, we are only considering the equivalent emissions of the six months that takes for a dose of antivenom to be produced. For other calculations we considered the entire lifespan of horses. For emissions and water consumption we are considering both direct costs from the animals themselves, as well as all the aspects caused by their maintenance, which include but are not limited to water, veterinarian care, transport, field care, among others. Table 2 contains the final data for the maintenance of the horses.
Table 2. Horse maintenance calculations.
| Horse maintenance | |||
|---|---|---|---|
| Number of horses in the facility | Doses per horse | Yearly doses | |
| 160-170 | 2000+ | 350000 | |
| CO2 eq emissions per horse per month (kg) | Water consumption per horse per month (l) | ||
| 386.3929583 | 1198 | ||
| Monthly cost | Unitary cost | Total cost | Marginal cost |
| Water (l) | 7188 | 46865760 | 287520 |
| CO2 eq emissions (kg) | 3952.35775 | 15383501.53 | 94397.31 |
| Energy consumption of entire care installation per month (kwh) | |||
| 4115.75 |
Plasma extraction, separation and anti-venom formulation
Each horse can produce a few grams of antivenom that are extracted from its blood. The antibodies are separated from the blood so that it can be injected back into the animal. The modern antivenoms produced in Mexico, including the one approved by the FDA, all use enzymatic digestion to produce F(ab) fragments. Reducing potential adverse effects in comparison to whole igG (Scorpion (Centruroides) Immune Fab2 Antivenin (Equine), n.d.; UA Scorpion Antivenom Collaboration Gains FDA Approval | University of Arizona News, n.d.). The process is complemented by chromatography stages to eliminate other substances from the media. Formulation then takes place in the form of lyophilization, leaving a powder that is to be reconstructed by saline before administration. The input and output of this section of the process is presented in table 3.
Table 3. Antivenom production calculations.
| Separation & formulation | ||
|---|---|---|
| Doses per batch | Batches per month | |
| 2000 | 14 | |
| Batch emissions and usage | ||
| Electricity consumption (KWh) | Water usage (l) | Co2 eq emissions (Kg) |
| 528.57 | 1231 | 237743 |
Microbial production
Since no microbial anti-venom production currently is commercially available, we focused our analysis on similar recombinant production processes for 2 organisms. The bacteria E. coli and the yeast P. pastoris. Both processes are similar, the yeast offers an streamlined purification process, since the use of secretion factors allows to purify the protein without requiring cell lysis, unlike the bacteria. On the other hand, bacteria can be easier to manipulate. While scale-up of antivenoms is currently taking place, initial results suggest that yeast-based cell factories outperform bacteria (Gómez-Ramírez et al., 2023; Riaño-Umbarila et al., 2025; Zarei et al., 2014). The 3 major phases of microbial recombinant protein production (fabrication of the cell factory, fermentation, and purification) can be carried out in the same installations, which complicates the separation of the use of water and electricity into each phase, we are presenting those numbers as a single entity, per batch. Table 4 has the total outputs of the microbial production systems.
Table 4. Bacterial production systems calculations.
| Microbial production | |
|---|---|
| Bacteria | |
| Water usage per batch (l) | Electricity consumption per batch (KWh) |
| 567 | 789 |
| Estimated doses produced per batch | Emissions per batch (CO2 eq Kg) |
| 6200 | 167234 |
| Yeast | |
| Water usage per batch (l) | Electricity consumption per batch (KWh) |
| 633 | 789 |
| Estimated doses produced per batch | Emissions per batch (CO2 eq Kg) |
| 24000 | 152143 |
Comparative analysis
We are making 3 comparisons: the total impact of the production processes to produce 300 thousand doses of antivenom, the individual impact of each dose by itself and the marginal impact of producing an additional batch. Table 5 has the comparative analysis of the 3 types of process.
Table 5. Comparative analysis for each type of process.
| Total impact | |||||
|---|---|---|---|---|---|
| Process | Total electric use (KWh) | Electric use converted to CO2 eq (Kg) | Water usage (l) | Emissions without electricity (Kg) | Emissions with electricity (Kg) |
| Horse antivenom | 147788.76 | 64879.26564 | 562599528 | 55325611.98 | 55390491.24 |
| Bacterial antivenom | 38177.41935 | 16759.8871 | 27435.48387 | 8091967.742 | 8108727.629 |
| Yeast antivenom | 9862.5 | 4329.6375 | 7912.5 | 1901787.5 | 1906117.138 |
| Unitary impact | |||||
| Process | Total electric use (KWh) | Electric use converted to CO2 eq (Kg) | Water usage | Emissions without electricity (Kg) | Emissions with electricity (Kg) |
| Horse antivenom | 3.92216 | 1.72182824 | 7275.929571 | 4105.283626 | 4107.005455 |
| Bacterial antivenom | 0.127258065 | 0.05586629 | 0.091451613 | 26.97322581 | 27.0290921 |
| Yeast antivenom | 0.032875 | 0.014432125 | 0.026375 | 6.339291667 | 6.353723792 |
| Marginal impact | |||||
| Process | Total electric use (KWh) | Electric use converted to CO2 eq (Kg) | Water usage (l) | Emissions without electricity (Kg) | Emissions with electricity (Kg) |
| Horse antivenom | 181.4773333 | 79.66854933 | 289051 | 332143.1479 | 332222.8164 |
| Bacterial antivenom | 789 | 346.371 | 567 | 167234 | 167580.371 |
| Yeast antivenom | 789 | 346.371 | 633 | 152143 | 152489.371 |
Discussion
At first glance, the environmental impact of horse antivenom production is multiple times that of either microbial alternative by orders of magnitude in some metrics. The use of animals increases emissions by a large margin, not only do horses need an entire separate installation for care and maintenance, as large mammals generate a significant amount of emissions and consume large amounts of water. Scorpion farms environmental impact remains comparatively low, this is backed by existing studies comparing the impact of livestock to that of insects in the context of diet, how insect protein could be a sustainable substitute for beef and pork (Halloran et al., 2016). The conclusion should not be as simplistic as just replacing the existing systems with recombinant antivenom, yes the emissions and water usage would be lower and the process can be scaled up easier, at least in theory. Remember that currently no commercial recombinant antivenom exists, with trials ongoing (Olivares-Hernández et al., 2024). Mexican recombinant antivenoms have just recently started to aim for polyvalency as an important characteristic (Riaño-Umbarila et al., 2021, 2025). We didn’t compare the theoretical process of producing the venoms in microorganisms, one of the strategies proposed to reduce variability in batches of antivenoms, it could reduce the environmental impact depending on yields, but it would not eliminate the biggest contributing factors to the environmental footprint of antivenoms.
While sustainability is an important goal to stride to, we must remember that sustainability is more than just reducing emissions and water usage. If we talk about recombinant antivenoms as an alternative to traditional antivenoms, that transition must not come at the cost of effective, safe, and affordable medicine. It is likely that even after the initial commercialization of microbial antivenoms, both alternatives will exist simultaneously in the market for a while, before one faces out if the microbial alternative proves effective. This part of our project shows that recombinant antivenoms have a lower environmental impact compared to the traditional approach, with yeast expression systems in particular being preferable due to the streamlined purification process and higher yields. That being said, we must abstain from just assuming microbial production is better, as at the moment it is still a developing technology, years from commercial implementation.
Bibliography
Alonso Villela, S. M., Kraïem-Ghezal, H., Bouhaouala-Zahar, B., Bideaux, C., Aceves Lara, C. A., & Fillaudeau, L. (2023). Production of recombinant scorpion antivenoms in E. coli: Current state and perspectives. Applied Microbiology and Biotechnology, 107(13), 4133–4152. https://doi.org/10.1007/s00253-023-12578-1
Amezcua-Allieri, M. A., Martínez-Hernández, E., Anaya-Reza, O., Magdaleno-Molina, M., Melgarejo-Flores, L. A., Palmerín-Ruiz, M. E., Eguía-Lis, J. A. Z., Rosas-Molina, A., Enríquez-Poy, M., & Aburto, J. (2019). Techno-economic analysis and life cycle assessment for energy generation from sugarcane bagasse: Case study for a sugar mill in Mexico. Food and Bioproducts Processing, 118, 281–292. https://doi.org/10.1016/j.fbp.2019.09.014
Ashworth, B., Plessis, M. J. du, Goedhals-Gerber, L. L., & Eeden, J. van. (2025). Emissions in pharmaceutical distribution: A systematic literature review of accounting methodologies in supply chains. Journal of Transport and Supply Chain Management, 19(0), 15. https://doi.org/10.4102/jtscm.v19i0.1150
Chatzipanagiotou, K.-R., Pappas, A., Petrakli, F., Antonaropoulos, G., & Koumoulos, E. P. (2025). Sustainability Assessment in Recombinant Human Insulin Production—Evaluating the Environmental Impacts of Microbial Growth Medium Components and Formulations. Journal of Experimental and Theoretical Analyses, 3(3), 28. https://doi.org/10.3390/jeta3030028
Climate Transparency. (2025, April 23). Climate Transparency. https://www.climate-transparency.org/
Dicks, A. P., & Hent, A. (2015). An Introduction to Life Cycle Assessment. In A. P. Dicks & A. Hent, Green Chemistry Metrics (pp. 81–90). Springer International Publishing. https://doi.org/10.1007/978-3-319-10500-0_5
Escamilla-Alvarado, C., Poggi-Varaldo, H., & Ponce-Noyola, M. (2017). Bioenergy and bioproducts from municipal organic waste as alternative to landfilling: A comparative life cycle assessment with prospective application to Mexico. Environmental Science & Pollution Research, 24(33), Article 33. https://doi.org/10.1007/s11356-016-6939-z
FAO on the common but flawed comparisons of greenhouse gas emissions from livestock and transport. (n.d.). CGIAR. Retrieved 27 September 2025, from https://www.cgiar.org/news-events/news/fao-common-flawed-comparisons-greenhouse-gas-emissions-livestock-transport/
Finkbeiner, M. (2016). Introducing “Special Types of Life Cycle Assessment”. In M. Finkbeiner (Ed.), Special Types of Life Cycle Assessment (pp. 1–9). Springer Netherlands. https://doi.org/10.1007/978-94-017-7610-3_1
Fuentes, A., García, C., Hennecke, A., & Masera, O. (2018). Life cycle assessment of Jatropha curcas biodiesel production: A case study in Mexico. Clean Technologies and Environmental Policy, 20(7), Article 7. https://doi.org/10.1007/s10098-018-1558-7
Gómez-Ramírez, I. V., Corrales-García, L. L., Possani, L. D., Riaño-Umbarila, L., & Becerril, B. (2023). Expression in Pichia pastoris of human antibody fragments that neutralize venoms of Mexican scorpions. Toxicon, 223, 107012. https://doi.org/10.1016/j.toxicon.2022.107012
Guinée, J., & Heijungs, R. (2017). Introduction to Life Cycle Assessment. In Y. Bouchery, C. J. Corbett, J. C. Fransoo, & T. Tan (Eds), Sustainable Supply Chains (Vol. 4, pp. 15–41). Springer International Publishing. https://doi.org/10.1007/978-3-319-29791-0_2
Hadin, Å., Eriksson, O., & Hillman, K. (2016). A review of potential critical factors in horse keeping for anaerobic digestion of horse manure. Renewable and Sustainable Energy Reviews, 65, 432–442. https://doi.org/10.1016/j.rser.2016.06.058
Halloran, A., Roos, N., Eilenberg, J., Cerutti, A., & Bruun, S. (2016). Life cycle assessment of edible insects for food protein: A review. Agronomy for Sustainable Development, 36(4), 57. https://doi.org/10.1007/s13593-016-0392-8
Havukainen, J., Väisänen, S., Rantala, T., Saunila, M., & Ukko, J. (2020). Environmental impacts of manure management based on life cycle assessment approach. Journal of Cleaner Production, 264, 121576. https://doi.org/10.1016/j.jclepro.2020.121576
How Mexico revolutionized the science of antivenom. (2025, September 22). Animals. https://www.nationalgeographic.com/animals/article/how-mexico-revolutionized-the-science-of-antivenom
Järviö, N., Maljanen, N.-L., Kobayashi, Y., Ryynänen, T., & Tuomisto, H. L. (2021). An attributional life cycle assessment of microbial protein production: A case study on using hydrogen-oxidizing bacteria. Science of The Total Environment, 776, 145764. https://doi.org/10.1016/j.scitotenv.2021.145764
Neugebauer, S., Forin, S., & Finkbeiner, M. (2016). From life cycle costing to economic life cycle assessment—Introducing an economic impact pathway. Sustainability, 8(5), 428.
Niu, S., Qin, J., Ma, C., Xu, S., & Li, C. (2025). Life cycle assessment and techno-economic analysis of plastic recycling in microbial protein factory. Chemical Engineering Journal, 168721.
Olivares-Hernández, R., Riaño-Umbarila, L., Becerril, B., Alagón, A., & Vázquez-López, H. (2024). Pharmacokinetic evaluation of a single chain antibody fragment against scorpion toxins in sheep. Toxicon, 242, 107691. https://doi.org/10.1016/j.toxicon.2024.107691
Parsons, S., Chuck, C. J., & McManus, M. C. (2018). Microbial lipids: Progress in life cycle assessment (LCA) and future outlook of heterotrophic algae and yeast-derived oils. Journal of Cleaner Production, 172, 661–672.
Riaño-Umbarila, L., Romero-Moreno, J. A., Ledezma-Candanoza, L. M., Olamendi-Portugal, T., Possani, L. D., & Becerril, B. (2021). Full Neutralization of Centruroides sculpturatus Scorpion Venom by Combining Two Human Antibody Fragments. Toxins, 13(10), Article 10. https://doi.org/10.3390/toxins13100708
Riaño-Umbarila, L., Romero-Moreno, J. A., Possani, L. D., & Becerril, B. (2025). State of the art on the development of a recombinant antivenom against Mexican scorpion stings. Toxicon: Official Journal of the International Society on Toxinology, 257, 108306. https://doi.org/10.1016/j.toxicon.2025.108306
Scorpion (centruroides) immune Fab2 antivenin (equine). (n.d.). Retrieved 29 September 2025, from https://go.drugbank.com/drugs/DB13905
Sillman, J., Uusitalo, V., Ruuskanen, V., Ojala, L., Kahiluoto, H., Soukka, R., & Ahola, J. (2020). A life cycle environmental sustainability analysis of microbial protein production via power-to-food approaches. The International Journal of Life Cycle Assessment, 25(11), 2190–2203. https://doi.org/10.1007/s11367-020-01771-3
Trinidad, K. R., Ashizawa, R., Nikkhah, A., Semper, C., Casolaro, C., Kaplan, D. L., Savchenko, A., & Blackstone, N. T. (2023). Environmental life cycle assessment of recombinant growth factor production for cultivated meat applications. Journal of Cleaner Production, 419, 138153. https://doi.org/10.1016/j.jclepro.2023.138153
UA Scorpion Antivenom Collaboration Gains FDA Approval | University of Arizona News. (n.d.). Retrieved 23 September 2025, from https://news.arizona.edu/news/ua-scorpion-antivenom-collaboration-gains-fda-approval
Van Aardt, W. J., Le Roux, J. M., Lindeque, J. Z., Mason, S., & Louw, R. (2016). The effect of temperature on the respiration and metabolism of the African burrowing scorpion ( Opistophthalmus latimanus ). Comparative Biochemistry and Physiology Part D: Genomics and Proteomics, 20, 50–56. https://doi.org/10.1016/j.cbd.2016.07.003
Zarei, N., Vaziri, B., Shokrgozar, M. A., Mahdian, R., Fazel, R., & Khalaj, V. (2014). High efficient expression of a functional humanized single-chain variable fragment (scFv) antibody against CD22 in Pichia pastoris. Applied Microbiology and Biotechnology, 98(24), 10023–10039. https://doi.org/10.1007/s00253-014-6071-2