
We constructed Mfp3 and Mfp5 using homologous recombinant. To generate sufficient quantity of DNA fragments for downstream cloning, we amplified the target DNA fragments (Mfp3, Mfp5) and linearized empty vector (pET21a) through PCR, and verified successful amplification by agarose gel electrophoresis on a 1% agarose gel. The result of gel electrophoresis (Fig. 1) shows a distinct band of the empty vector at expected size of 5300bp~. Both bands of Mfp3 and Mfp5 samples also appear distinctly at expected sizes (Mfp3: 141bp, Mfp5: 231bp). The DL5000 DNA marker was included for size reference. The result confirmed our successful PCR amplification of linearized empty vector, Mfp3 and Mfp5 DNA fragments without DNA degradation.

Fig. 1. The gel electrophoresis validation of linearized empty vector, Mfp3 and Mfp5 fragments.
After Gel extraction of the target fragments and purification, we ligated the PCR product of Mfp3, Mfp5 and the linearized vevtor. We transformed the plasmids Mfp3 and Mfp5 into DH5α, and Fig. 2A showes the growth of single clones, compared to the control group which had no Amp resistance. We selected clones 1-4 of Mfp3 and Mfp5 respectively to perform PCR verification. Fig.2B showes bands that matched the expected size, indicating successful construction and transformation.

Fig. 2. The monoclonal antibody validation of Mfp3 and Mfp5.
Note:
A. The plate images of respectively Mfp3 and Mfp5 transformed into E.Coil DH5α cells, and the control groups.
B. The images showing the verification of single colony PCR of Mfp3 and Mfp5.

Fig. 3 Sanger sequencing of pET21a-Mfp3, pET21a-Mfp5
We confirmed the correctness of the final constructed plasmid through Sanger sequencing. The results are shown in the figure. The sequencing signal was stable and matched the theoretical designed sequence.
In order to assess the effectiveness of bacterial disruption and solubility of our target protein in supernatants (SUP), we performed SDS-PAGE using whole-cell lysates (WL) derived from E. coli harboring recombinant plasmids (Mfp3, Mfp5) and supernatant (SUP) obtained after centrifugation as samples. For Mfp3 and Mfp5 in Fig. 4, the existence of the bands of WL and Sup with similar intensity indicates that both samples expressed target protein, hence indicates successful cell lysis and confirms that the target protein is soluble in supernatant.

Fig. 4. The SDS-PAGE protein gel of WL and SUP of Mfp3 and Mfp5.
WL: whole cell lysis; SUP: supernatant
To evaluate the purity of target protein Mfp3 and Mfp5(Fig. 5) after purifying the protein-containing Sup by nickel column affinity chromatography, we use flow-through, wash fractions of imidazole in different concentrations (10mM, 20mM, 50mM, 100mM, 150mM) and elution fraction of imidazole concentration 500mM as samples to run SDS-PAGE.
As concentration of imidazole increases, the single band of target protein existed., hence showing that purification of target protein increases. Elution fraction shows higher intensity, hence higher concentration as well as higher purification in contrast to adjacent bands.

Fig. 5. The SDS-PAGE protein gel of different fractions of Mfp3 and Mfp5
We use Bicinchoninic Acid (BCA) Assay to determine the concentration of Mfp3 and Mfp5 in each wash fractions and elution fraction with bovine serum albumin (BSA) standards (0-2000 μg/mL) labeled as A-I. Standards A-D (conc. = 2000-750 μg/mL) were excluded as outliers in the construction of standard curve due to the inconsistent OD value of standard D, where concentrations of all samples to be tested were included in the linear range of 0-500 μg/mL (OD562 = 0.1243-0.7809, R² = 0.9998). This improved the linearity of the optimal standard curve.
We extracted mfp3 and mfp5 proteins and performed hydroxylation treatment on both. To evaluate their DOPA characterization and adhesive properties, we conducted both macroscopic tests and staining-based visualization assays, aiming to identify which protein exhibits the best adhesion after modification.
Hydroxylation reaction and NBT Staining Assays:
Mfps is rich in polyphenyl groups and positively charged amino acids. The polyphenyl groups not only have powerful anti-inflammatory and antioxidant functions but also endow Mfps with strong underwater adhesion, enabling it to effectively adhere to the surface of medical device implants in body fluids.
To enhance the adhesive properties of the protein, we first performed the hydroxylation reaction. After that, we performed the NBT staining and analyzed the DOPA conversion rates to verify the success of the hydroxylation reaction.

Fig 6. NBT staining for the identification of protein hydroxylation.
From left to right: negative control (BSA), Post-Hydroxylation (dMfp3,dMfp5), Pre-Hydroxylation (Mfp3, Mfp5), positive control (Cell-Tak)
From the staining result, we observe that the post-hydroxylation sample showed significantly stronger staining compared to the pre-hydroxylation sample. This indicates that the hydroxylation process was successful.
|
Recombinant protein |
DOPA conversion rate (%) |
|
Mfp3 |
22.2 |
|
Mfp5 |
26.7 |
Table 1. Amino Acid Analyzer: DOPA conversion rates of different recombinant proteins
The DOPA conversion rates measured by the amino acid analyzer confirmed the success of the hydroxylation reaction. Moreover, the conversion rate of mfp3 was lower than that of mfp5 (22.2% <26.7%), indicating that mfp5 underwent more efficient hydroxylation.
To further evaluate and compare the adhesive performance between mfp3 and mfp5, we performed the Coomassie Brilliant Blue Staining:
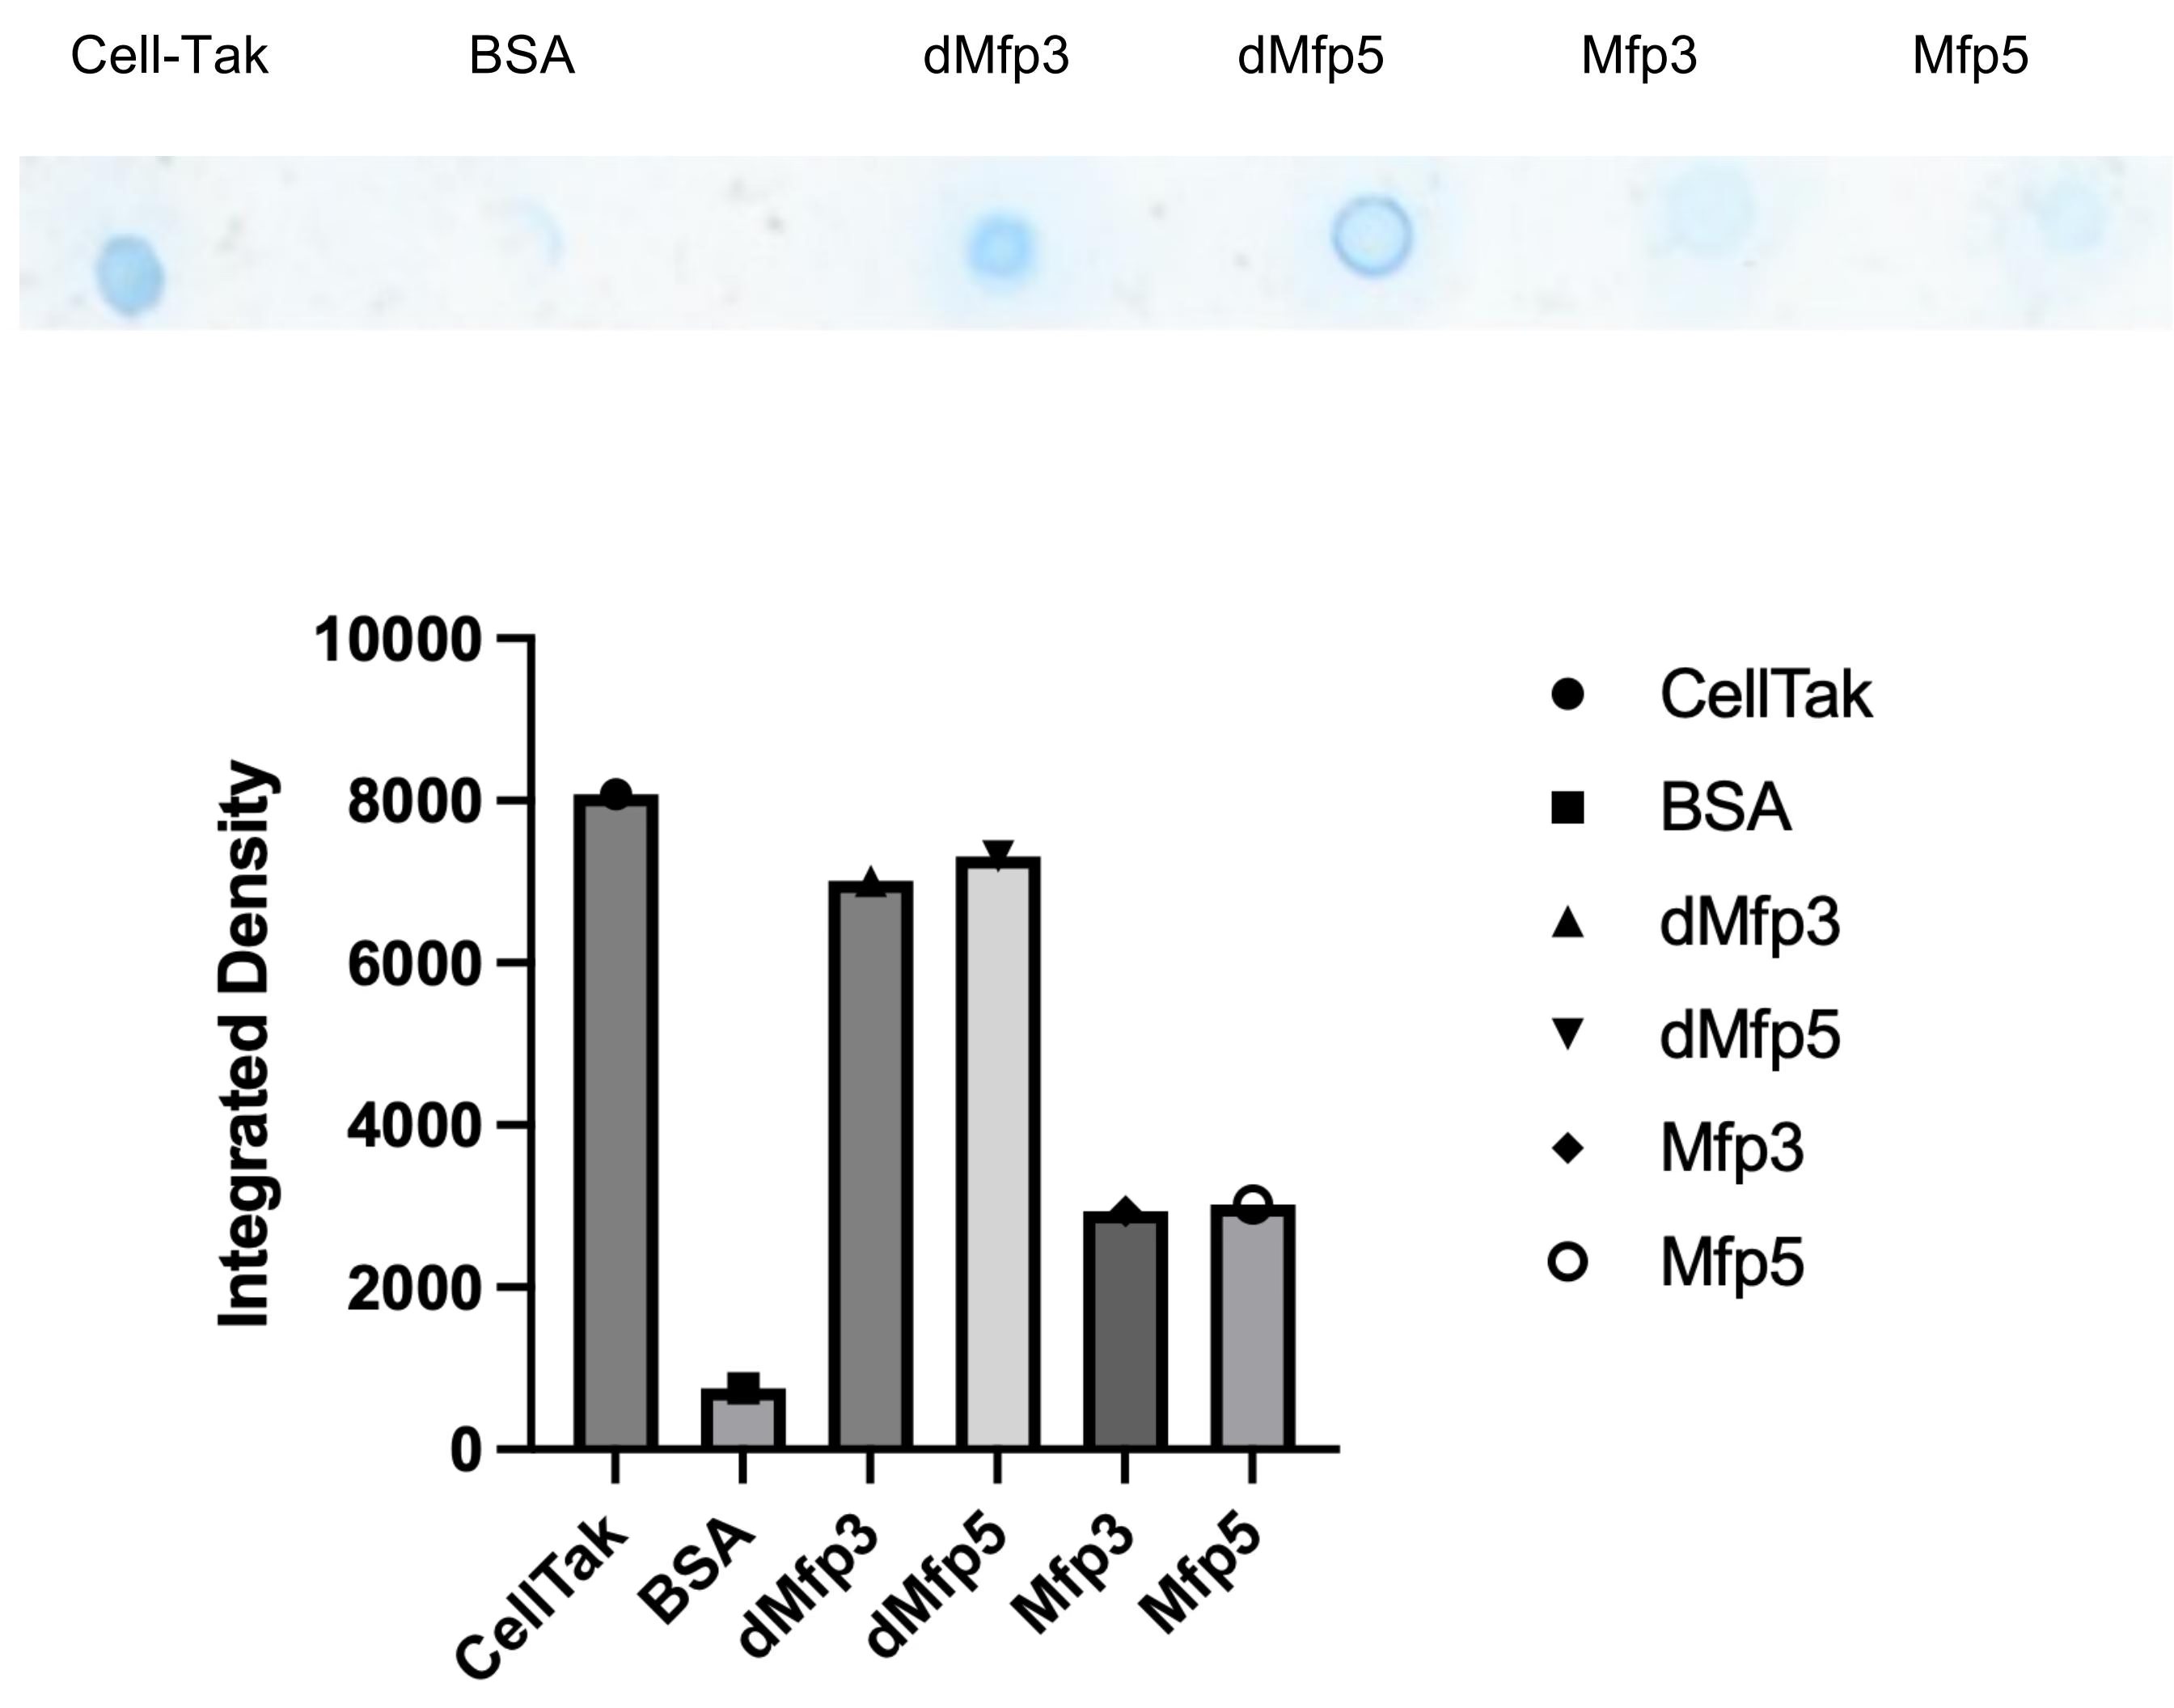
Fig .7 Coomassie brilliant blue staining of different groups of protein and Image J analysis.
To evaluate the relative adhesion capacity of Mfp3 and Mfp5 after hydroxylation, we conducted a grayscale intensity analysis of Coomassie blue staining using ImageJ. The integrated gray values were extracted for each protein as an measure of protein abundance, where a lower gray value corresponds to a light stain, indicating weak staining and thus a lower protein adhension.
According to ImageJ analysis, the gray value of dMfp3 was a little lower than that of dMfp5. At the same time, we can see thay hydroxylated group are all significantly higher than that of non-hydroxylation group (Mfp3,Mfp5). The higher gray value of dMfp5 indicates stronger staining and thus higher protein retention, suggesting superior adhesive capacity.
Therefore, combined with the result of amino acid analyzer, Mfp5 was incorporated into the final fused protein due to its strong adhesive properties.
We used a pipette tip adhesion test to further assess adhesive strength macroscopically. The lids of 50-milliliter centrifuge tubes (PP, Polypropylene) and the tips of 10-microliter pipettes (PP, Polypropylene) were respectively used. On the surface of four test tube caps, we applied equal amounts of four sample groups:
- Negative Control (BSA),
- Untreated Mfp5 Protein (non-hydroxylated),
- Hydroxylated Protein Mfp5
- Positive Control (commercial protein production for cell adhension culture, Corning® Cell-Tak™ Cell and Tissue Adhesive (354240) ).
After applying pipette tips onto each sample, the caps were incubated at 37°C until completely dry. Then, we inverted the test tubes. As expected, the pipette tips in the negative control and non-hydroxylated groups fell off, whereas the hydroxylated samples and positive control remained adhered, indicating that our modified Mfp3 proteins possess adhesive capabilities after hydroxylation.
Mfp5:

Fig .8 Adhesion test of Mfp5 using pipette tips
A: Befor Hydroxylated and positive control remained; B: after rotation
C: Hydroxylated Mfp5 remained sticky for one day
By comparing the results of different group, we observe that mfp5’s adhesion is sufficient validated. The hydroxylated sample stayed adhered, whereas the untreated mfp5 group detached, indicating that hydroxylation enhances the adhesive properties of mfp5, and its overall adhesion strength is significantly obvious. So for the future construction and final functional test, we chose the Mfp5 as our adhensive module to combined with antimicrobial peptide and zwitterionic peptide.
Through literature review, we found that in the research of 2006 (Loose et al., 2006), D51 is an antimicrobial peptide containing 20 amino acids, which was designed based on natural antimicrobial peptides through a language model. D51 only contains hydrophobic and cationic amino acids (sequence FLFRVASKVFPALIGKFKKK).
Tet213, as a broad-spectrum antibacterial peptide with 10 amino acids, plays a significant role in promoting the repair of infected wounds and can be used in combination with collagen to exert its function (Sequence KRWWKWWRRC).
Melittin is the main component and active substance of bee venom. As a cationic linear peptide, it contains 26 amino acids: GIGAVLKVLTTGLPALISWIKRKRQQ. Its primary sequence is amphiphilic. Studies have shown that melittin has significant antibacterial activity against bacteria, fungi and mold spores.
To evaluate the antibacterial efficacy of different antimicrobial peptides (AMPs), we chose three distinct peptides for comparison: D51, Tet213 and Melittin. We obtained these three antibacterial agents respectively through synthesis, and tested their bactericidal activity effects on two bacterial species: Escherichia coli (E. coli) and Bacillus subtilis (B. subtilis).
For each peptide, five experimental groups were prepared: one control group (no peptide added), and four treatment groups with peptide concentrations ranging from 25 μg/ml to 400 μg/ml.
Each bacterial strain was cultured to an optimal density (OD600), and measurements were taken hourly over 24 hours to monitor bacterial growth. These measurements were then compared to the baseline values recorded at time=0.

Fig .9 Antimicrobial test of synthetic peptide (D51, Tet213, Melittin)
From the graph above, we observe that D51 exhibits the strongest antibacterial efficacy against both E. coli and B. subtilis compared to Tet213 and Melittin.
At the same concentrations, D51 consistently shows the lowest growth curve slope, indicating the most effective inhibition of bacterial growth. This effect is particularly displayed on E.coli, where at 50, 100 and 400 μg/ml, the bacterial growth is almost completely suppressed.
Therefore, we choose D51 as our antimicrobial peptide for the construction and functional verification of composite fusion protein.
We constructed zwi-mfp5-D51 fused plasmid using homologous recombinant. To generate sufficient quantity of DNA fragments for downstream cloning, we amplified the target DNA fragments (zwi-mfp5-D51 fused) through PCR, and verified successful amplification by agarose gel electrophoresis. The result of gel electrophoresis shows a distinct band of the fused fragment which matches the expected size of 420bp. The result confirmed our successful PCR amplification of the fused DNA fragments without DNA degradation.

Fig. 10. The gel electrophoresis validation of the zwi-mfp5-D51 fused fragment.
We transformed the fused plasmids into DH5α, and Fig. 11A showed the growth of single clony, compared to the control group which had no Amp resistance. We selected clony 1-4 of colonies harboring fused plasmids respectively to perform colony PCR verification. Fig. 11B showed bands that matched the expected size of 420bp, indicating successful liagtion and transformation. Then we choose the positive colony for Sanger sequencing to further verify the construction.

Fig. 11 Colony PCR verification of the pET21a- zwi-mfp5-D51

Fig. 12 Sanger sequencing of pET28a-zwi-Mfp5-D51
We confirmed the correctness of the final constructed plasmid of pET28a-zwi-Mfp5-D51 through Sanger sequencing. The results are shown in the Fig. 12. The sequencing signal was stable and matched the theoretical designed sequence.
In order to assess the effectiveness of bacterial disruption and solubility of our target protein in Sup, we performed SDS-PAGE using WL derived from E. coli harboring recombinant zwi-mfp5-D51 fused plasmids and Sup obtained after centrifugation as samples. Similarity between WL and Sup indicates our successful ultrasonic disruption, and our target protein are soluble in supernatant.

Fig. 13. The SDS-PAGE protein gel of WL and Sup of Mfp3 and Mfp5.
To evaluate the purity of target protein zwi-mfp5-D51 after purifying the protein-containing Sup by nickel column affinity chromatography, we use flow-through, wash fractions of imidazole in different concentrations (20mM, 50mM, 100mM, 150mM) and elution fraction of imidazole concentration 500mM as samples to run SDS-PAGE.
As concentration of imidazole increases, the band of target protein stood out, hence showing that purification of target protein increases. Elution fraction shows higher intensity, hence higher concentration as well as higher purification in contrast to adjacent bands.

Fig. 14. The SDS-PAGE protein gel of different fractions of fused protein.

Fig. 15 NBT staining of fusion protein zwi-Mfp5-D51
To enhance the adhesion of the protein, mushroom tyrosinase was used for the in vitro modification of the target protein, converting the tyrosine residues into dopamine (Dopa) under the conditions of 37°C for 30 minutes. In an alkaline environment, when potassium glycine was used as a reducing agent, nitroblue tetrazolium (NBT) could react with DOPA, producing a blue-purple color. NBT staining indicates that the in vitro modification of Dopa in the fusion protein was successful.

Fig. 16 Coomassie brilliant blue staing of zwi-Mfp5-D51
Take 5 microliters each of 0.3 mg/mL BSA, commercial mussel foot protein Cell-TakTM, and hydroxylated/non-hydroxylated recombinant protein samples, and place them on the surfaces of clean polystyrene plates and glass slides. Dry at room temperature for 12 hours, shake in pure water for 0.5 hours, dry at room temperature, and stain with Coomassie Brilliant Blue G-250 for 10 minutes. Compare the adsorption capacity of the protein samples on different substrate surfaces based on the staining intensity.
The hydroxylated fusion protein shows good adsorption capacity on the surfaces of polystyrene and glass slides.

Fig. 17 Adhession test of zwi-Mfp5-D51 by pipette tips. a) BSA, b) Cell-Tak, c) Fusion protein (Hydroxylation), d) Fusion protein (Non-hydroxylation)
For the fused protein, we observed that after inverting the sample, only the hydroxylated group remained attached, while all other groups detached from the surface of the lid, indicating that the hydroxylated fused protein exhibits strong adhesive properties.

Fig. 18 Anti-fouling test of the coated glass and stainless steel by zwi-Mfp5-D51
After preparing coatings by combining the fusion protein zwi-Mfp5-D51 with glass and stainless steel, we established co-culture systems with Escherichia coli and Bacillus subtilis for both coating materials. After incubation, we plated the bacteria that adhered to the washed coatings. As shown in the above image, we observed that the number of colonies with coatings on both materials was significantly lower than that of the uncoated material group. The above results indicate that the dual ion peptide in the fusion protein meets the project's design goals and can achieve a certain level of anti-fouling effect.


Fig. 19 Antibacterial testing of fusion proteins by bacterial growth curve method
In a co-culture system, glass and stainless steel material samples coated with fusion proteins were continuously incubated on a porous plate with Escherichia coli and Bacillus subtilis. Monitoring the bacterial growth through changes in turbidity and dynamic measurements of OD600 absorbance over time revealed that the fusion protein coating on the glass surface exhibited a significantly stronger antibacterial effect compared to that on stainless steel. Notably, at a coating concentration of 3 mg/mL, the growth of both bacterial strains was markedly inhibited. These results indicate that glass materials demonstrate superior compatibility for fusion protein coatings in terms of adhesion and antibacterial efficacy.